Experimental Study on Characteristics of Synergistic Effect of Fuel Mixing on Number Density and Size of Soot in Ethylene-base Counterflow Diffusion
Flames by Laser Techniques
Jae-Hyuk Choi†
(Received May 12, 2009 ; Revised May 22, 2009 ; Accepted May 25, 2009)
Abstract: The effect of fuel mixing on soot structure with methane, ethane, and propane to ethylene-base counterflow diffusion flames has been investigated by measuring the volume fraction, number density, and particle size of soot by adopting the light extinction/scattering techniques. The experimental result showed that the mixing of ethane and propane in ethylene diffusion flame increased soot volume fraction while the mixing of methane decreased. As compare to the ethylene-base flame, the diameters of soot particles for mixture flames are slightly smaller. While the soot number densities for the mixture flames are much higher. Thus, the increase in the soot volume fraction can be attributed to the appreciably increased soot number density by the fuel mixing.
Key words :Counterflow, Soot, Laser extinction, Laser scattering, Volume fraction, Number density
†Corresponding Author(Korean Register of Shipping, E-mail:[email protected], Tel: 042-869-9511)
1. Introduction
Soot particles produced in flames play an important role as a heat radiating medium which can be desirable in improving radiation heat transfer in large scale boilers or furnaces, while soot is one of the dominant air pollutants and soot deposition on piston and/or cylinder of internal engine may cause significant problem. Especially, soot emission from large cargo ship worse than expected, and tugboats puff out more soot for the amount of fuel used than other commercial vessels [1] . Therefore, the effective control of soot emission and
formation processes is an interesting subject.
The species generated from fuel pyrolysis lead to incipient ring formation such as benzene (C 6 H 6 )and naphthalene (C 10 H 8 ),which grow to PAHs and finally to
soot [2],[3] . Extensive studies on soot
inception and the distribution of soot
particle size in laminar diffusion and
premixed ethylene flames have been
investigated experimentally and
numerically [4]-[6] . Especially, fuel mixing
and doping experiments have been
performed to improve the understanding
of fuel structure effect on PAH and soot
formation mechanisms in diffusion
flames [7],[8] .
Propargyl plays important roles for both the incipient ring formation through the propargyl recombination reaction [9] and PAH growth through odd-carbon chemistries [10],[11] .
The synergistic effect has been observed where the mixture fuels produced more PAH and soot than the respective pure fuels, e.g., for the case of propane added to ethylene fuel. This synergistic effect has been explained based on the interaction between acetylene and propargyl species.
Recently, based on the experiment and numerical simulation for the mixing of methane, ethane, and propane to ethylene fuel [12] , the synergistic effect has been attributed to the role of methyl radicals on the formation of incipient rings and PAHs. Methyl radicals, generated from the thermal decomposition of ethane and propane in the low temperature region, could react with C2-species producing propargyl radicals. This contributes to the increased production of incipient rings as compared to the ethylene-base flame. In this work, however, only the soot volume fraction has been measured in explaining the synergistic effect and detailed measurements on soot number density and soot size have not been conducted.
In this regard, the present work performed experiments to obtain quantitative data on the volume fraction, number density, and diameter of soot particles in a counterflow for various mixture flames, including the fuel mixing of methane, ethane, and propane to ethylene-base flame. Light
extinction/scattering techniques were adopted.
2. Experimental setup
A series of experiments on laminar diffusion flames has been performed to identify the effect of fuel mixing on soot formation in a counterflow burner.
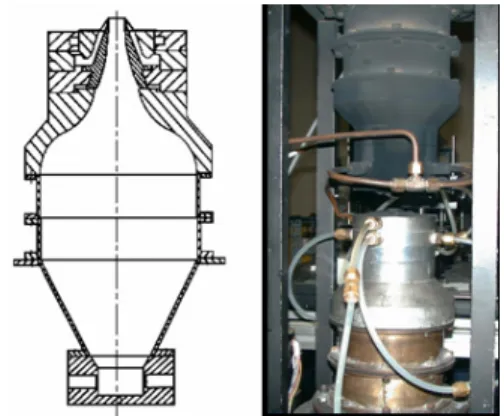
Fig. 1 shows schematic a burner and a direct photo.
The counterflow burner had a pair of divergent-convergent nozzles with the area contraction ratio of 80:1. Both the nozzle exit diameter and the separation distance between the two nozzles were 14.2 mm. The fuels were commercially-pure grade methane (> 99.9 %), ethane (> 99.9
%), and propane (> 99.9 %) mixed to ethylene (> 99.9 %). The oxidizer was 76%N 2 /24%O 2 . The nozzle exit velocities were kept at 19.5 cm/s for both the fuel and oxidizer streams to maintain the flame stretch constant.
Fig. 1 Schematic of a burner and a direct photo
The experimental apparatus consisted of
a counterflow burner, flow controllers, and
a laser light extinction/scattering setup,
as schematically shown in Fig. 2. Each nozzle had a concentric slit through which nitrogen was supplied to shield the ambient air. Mass flow controllers, calibrated with a wet-test gas meter, were used for flow control. The laser light scattering and extinction techniques adopted a 0.5 W, 514.5 nm Ar-ion laser to obtain the volume fraction, particle size, and number density of soot particles. A photodiode (Hamamatsu,S1227) monitored the extinction in tensity and the scattering signal was measured by a photomultiplier tube (Hamamatsu,R928) at the right angle through a narrow band-pass filter of 514.5 nm with 1 nm full-width-half-maximum (FWHM). In the measurement of scattering signal, a half-wave plate and a polarization filter were used to control the direction of polarization axis for incident laser and scattered light, respectively. To enhance the signal-to-noise ratio, a mechanical chopper (1100 Hz) and a lock-in amplifier (Standard Research, SR 530) were employed.
Fig. 2 Schematic of experimental setup for light extinction/scattering measurement (M, mirror;
C, chopper; PH, pinhole; HWP, half-wave plate; L, lens; NDF, neutral density filter; PD, photodiode; P, polalizer; PMT, photo-multiplier tube)
3. Results
Soot formation characteristics for the mixing of methane, ethane, and propane in ethylene diffusion flame are investigated to further illustrate the effect of fuel structure on soot formation by obtaining the volume fraction, number density, and diameter of soot particles.
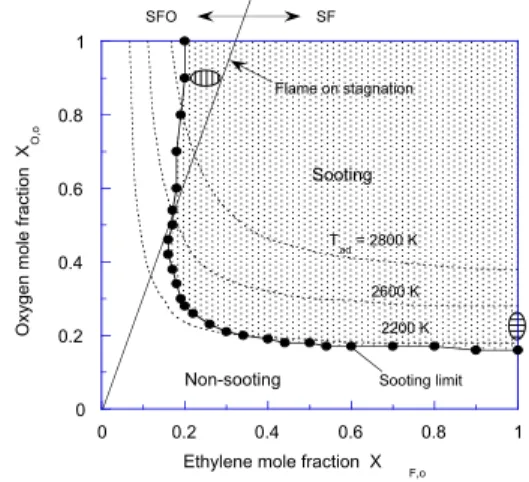
Fig. 3 shows sooting limits in the ethylene counterflow diffusion flames. In the figure, the shading shows the region of soot formation flame. T ad is the calculated adiabatic temperature. Soot formation characteristics in counterflow diffusion flames can be categorized into the soot formation (SF) flame and soot formation/oxidation (SFO) flame, based on the relative position between the flame and the particle stagnation plane [8] . In the present, we consider the soot formation flame, which is the case when the flame is located on the oxidizer side from the particle stagnation plane.
0 0.2 0.4 0.6 0.8 1
0 0.2 0.4 0.6 0.8 1
Oxygen mole fraction X O,o
Ethylene mole fraction X
F,o Flame on stagnation
Tad = 2800 K
2600 K 2200 K
SFO SF
Sooting limit
Non-sooting
Sooting
Fig. 3 Sooting limits in ethylene counterflow
diffusion flames for different mole fractions
of fuel and oxygen [8]
Fig. 4 shows the direct photograph for the ethylene-base case and the schematic of flow fields. The flame is located on the oxidizer side of the counter flow for the present condition of pure fuel and oxidizer due to the stoichiometric fuel to oxidizer mass ratio. In this case, the soot particles formed on the fuel side of the flame is transported away from the flame and toward the stagnation plane following reasonably the streamlines. Since the soot particles move away from the flame, soot oxidation cannot occur. Thus, the flame is categorized as the soot formation flame.
Fig. 4 Schematic of soot zone structure for soot formation flame in counterflow and direct photo
The direct photograph shows a blue flame and the yellow luminous zone of the soot located on the fuel side of the flame.
Detailed flow visualization characterizing this type of flame has been reported previously [12] .
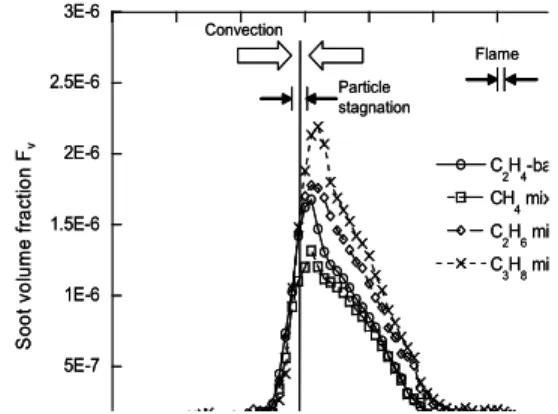
Fig. 5 shows the axial profiles of the soot volume fraction f v measured along the centerline of the counterflow for the ethylene-base flame and the mixture flames of 5 % methane/ethane/propane in
volume to ethylene. Note that the soot volume fraction is determined from the laser extinction data to represent local information. The result shows that as compared to the ethylene-base case, the addition of ethane and propane enhances the soot volume fraction, thereby the synergistic effect is exhibited. The maximum value of the soot volume fraction is 1.67 × 10 -6 for the ethylene-base flame and 1.32 × 10 -6 ,and 1.78×10 -6 ,and 2.19×10 -6 for the mixing of methane, ethane, and propane, respectively. The soot volume fraction for the propane mixing case is 1.31 times to that of the ethylene-base case.
5E-7 1E-6 1.5E-6 2E-6 2.5E-6 3E-6
C
2H
4
-ba CH
4mix C
2H
6
mi C
3H
8
mi
So ot v o lu me fr ac tio n F
vParticle stagnation Convection
Flame
5E-7 1E-6 1.5E-6 2E-6 2.5E-6 3E-6
C
2H
4
-ba CH
4mix C
2H
6
mi C
3H
8
mi
So ot v o lu me fr ac tio n F
vParticle stagnation Convection
Flame
Fig. 5 Profiles of soot volume fractions as a function of distance from fuel nozzle
For these flames, the maxima of soot volume fractions appear near Z ≈ 5.1 mm and the flames are located at Z ≈ 8.1 mm, where Z is the distance from the fuel nozzle. The sooting zones (5 < Z < 7 mm) are on the oxidizer side of the stagnation plane. The flow field in the sooting zone is directed towards the fuel side in the region between the flame and the particle stagnation plane.
Therefore, the soot volume fractions for
all the flames have the maximum values near the particle stagnation plane because of the soot particles are transported and grown toward the direction of fuel.
In the figure, the soot volume fraction for the mixture flames, except the methane-ethylene flame, is higher than that for the ethylene-base flame. The synergistic effect on soot formation for mixture fuels of ethylene and propane has been explained based on the enhanced formation of propargyl. The formation of incipient rings from the propargyl recombination can be most effective for the propane-ethylene flame. The soot volume fractions of ethylene-ethane flame are also higher than that of the ethylene-base flame. The synergistic effects in ethylene-propene flame [13] and ethylene-ethane flame [14] can also be explained based on the role of propargyls for the incipient ring formation of benzene.
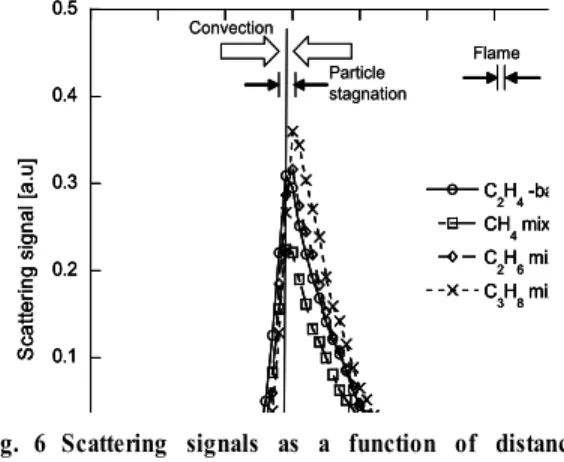
Fig. 6 shows the profiles of the soot scattering signal along the centerline of the counterflow for the ethylene-base flame and the mixture flames of methane/ethane/propane to ethylene flame with 5 % in volume. Based on the Mie scattering theory, the scattering signal is proportional to the particle size to the sixth power and soot number density. The measured scattering signals exhibited a skewed shape due to the nature of the soot formation flame in that the inception of soot particles occurs on the fuel side of the flame and the soot particles grow as they migrate toward the particle stagnation plane. Note that the particle stagnation plane is located near Z
≈ 4.9 mm, which is determined from the numerical simulation considering the thermophoretic effect, which will be elaborated later. As compared to the ethylene-base case, the case with 5 % mixing of methane to ethylene shows decreased scattering signal. The case for the ethane mixing is comparable to the ethylene-base case. The case with propane mixing shows increased signal intensity as compared to the ethylene-base case.
S cat te ring si gn al [ a. u]
0.1 0.2 0.3 0.4 0.5
C
2H
4-ba CH
4mix C
2H
6mix C
3H
8mix Particle
stagnation Convection
Flame
S cat te ring si gn al [ a. u]
0.1 0.2 0.3 0.4 0.5
C
2H
4-ba CH
4mix C
2H
6mix C
3H
8mix
S cat te ring si gn al [ a. u]
0.1 0.2 0.3 0.4 0.5
C
2H
4-ba CH
4mix C
2H
6mix C
3H
8mix Particle
stagnation Convection
Flame
Fig. 6 Scattering signals as a function of distance from fuel nozzle
In order to examine soot formation processes for the mixture flames, the soot size D 63 , and the number density N have been obtained based on the Mie scattering theory [15],[16] . From the quasi-one dimensional characteristics of the counterflow flames, the extinction coefficient K ext can be calculated experimentally by [17] ;
1 log / 1 log /
e iext e i
K = −∆ X − W W = −∆ X − I I % % (1)
where W i is the initial laser intensity,
W e is the intensity after extinction, I%
iand I%
eare the corresponding electric
signals from the photodiode, and Δ X is the width of the test section. The volumetric differential cross section Q vv [cm 2 /cm 3 ]of gases can be
vv vv
Q = NC (2)
where C vv [cm 2 ]is the angular scattering cross section [18], [19]
.
For spherical soot particles which is small compared to the wavelength of light, the volume fraction f v , the average size D 63 ,and the number density N, are determined from K ext and Q vv as [15] ;
3
6
306 ( )
v ext
f ND K
E m λ π
= = π
(3)
1/ 3 63
4 ( ) ( / 2) ( )
vv ext
E m Q
D F m K
π π
λ π
⎡ ⎤
= ⎢ ⎥
⎣ ⎦ (4)
3 63
6 f f
v NN π D
⎛ ⎞
= ⎜ ⎟
⎝ ⎠ (5)
with,
2 2 2
( ) 1 2 F m m
m
= −
+ (6)
2 2
( ) Im 1 2 E m m
m
= −
+ (7)
6 6 0
3 2
(
3 0)
N
f D
= D
(8)
Here, λis the laser wavelength, m is the refractive index of soot particles, and f N is 2.1 assuming the self-preserving
distribution. The refractive index of soot particles is assumed as m = 1.57 - 0.56i for the present experiment using Ar-ion laser of λ= 514.5 nm [15] .
The profiles of the soot number density
and soot size obtained from Eqs. (1) - (8) are shown in Fig. 7 and 8, respectively.
Fig. 7 shows the distributions of soot number density for the mixture flames.
The number densities for all flames have maximum values near Z ≈ 6.8 mm, close to flame zone and decrease away from this zone toward the fuel side. This means that the soot inception is likely to occur in the high temperature region near the flame zone. The soot number density decreases rapidly as Z decreases in the direction of soot particle transport toward the fuel side for all the cases. This can be attributed to the coalescence of soot particles. While the soot particle size, shown in Fig. 8, increases as the particles are transported toward the stagnation plane. These trends of the number density and the soot particle size suggest the soot inception occurs close to Z ≈ 6.8 mm and the number density decreases as Z decreases in the direction of soot particles transport due to coalescence. Simultaneously, the particle size increases by coalescence and the surface growth of soot.
Distance from fuel nozzle Z [mm]
Soot number density N [cm-3]
0 5E+11 1E+12 1.5E+12 2E+12 2.5E+12
2 3 4 5 6 7 8 9 10
C
2H
4-base CH
4mixing C
2H
6
mixing C
3H
8
mixing
C2H4
0 1E+11 2E+11 3E+11 4E+11 5E+11
5 5.5 6 6.5
C2H4
ND
(Fuel) (Oxidizer)
Convection
Flame Particle
stagnation
Distance from fuel nozzle Z [mm]
Soot number density N [cm-3]
0 5E+11 1E+12 1.5E+12 2E+12 2.5E+12
2 3 4 5 6 7 8 9 10
C
2H
4-base CH
4mixing C
2H
6
mixing C
3H
8
mixing
C2H4
0 1E+11 2E+11 3E+11 4E+11 5E+11
5 5.5 6 6.5
C2H4
ND
(Fuel) (Oxidizer)
Convection
Flame Particle
stagnation
Fig. 7 Profiles of number densities as a function of
distance from fuel nozzle
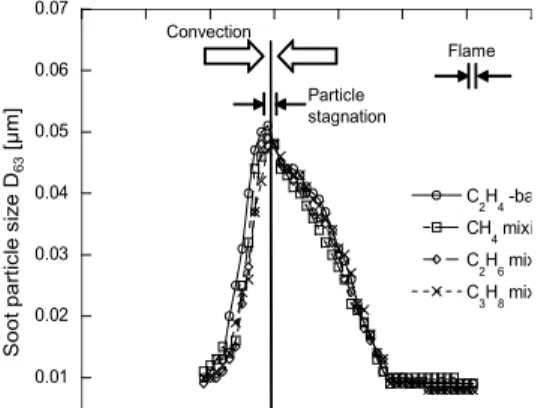
Fig. 8 shows the distributions of soot particle size for the mixture flames. The soot particles grow toward the low temperature side and show the maximum values near the stagnation plane at Z ≈ 4.9 mm. The maximum size of soot particles is 5.1×10 -2 μm for the ethylene-base flame. The result clearly shows that the soot particle size for the mixture flames of ethylene and methane/ethane/propane is nearly the same, although there exists small decrease in the sizes as compared to the ethylene-base case. This can be understood based on the HACA mechanism, which plays a dominant role for the surface growth of soot. Both temperature and acetylene species play crucial roles for the HACA mechanism.
Note that the adiabatic flame temperature is lower and the concentration of C 2 H 2 is expected to be lower for the mixture fuels than those for the ethylene-base case.
Soot par ticl e si ze D
63[µ m]
0.01 0.02 0.03 0.04 0.05 0.06 0.07
C
2H
4
-ba CH
4mixi C
2H
6
mix C
3H
8