Polycystic ovary syndrome (PCOS) is one of the most common endocrine disorders in women of reproductive age, and the most frequent cause of hyperandrogenism and oligo-anovulation.1 Because PCOS patients show higher risk for cardiovascular diseases, as linked by metabolic dysfunction marked by dyslipidemia, hyperandrogenism, inflammatory state and insulin resistance,2 it is imperative that these cardiovascular risk factors are detected earlier.
Insulin resistance, found in 50% to 70% of the women with PCOS,3 one of the complex etiology of PCOS, is the major risk factor in the development of metabolic syndrome in these women. Therefore, early detection of insulin resistance
is paramount in preventing cardiovascular involvement in PCOS patients. While hyperinsulinemic-euglycemic clamp technique is the accepted global standard in measuring insulin sensitivity, this method is not cost-effective and therefore not suitable for clinical settings.4 Instead, the homeostasis model assessment of insulin resistance (HOMA-IR) is an efficient and noninvasive method to estimate insulin sensitivity from the steady glucose and insulin concentrations measured under fasting conditions. In epidemiologic studies, HOMA-IR is accepted as the standard method to detect insulin resistance.5
In this study, we investigate clinical and biochemical
Original Article
pISSN: 2288-6478, eISSN: 2288-6761 http://dx.doi.org/10.6118/jmm.2014.20.3.104 Journal of Menopausal Medicine 2014;20:104-110
J MM
Clinical and Biochemical Profiles according to
Home ostasis Model Assessment-insulin Resistance
(HOMA-IR) in Korean Women with Polycystic Ovary Syndrome
Da Eun Lee, Soo Yeon Park, So Yun Park, Sa Ra Lee, Hye Won Chung, Kyungah Jeong
Department of Obstetrics and Gynecology, School of Medicine, Ewha Womans University, Seoul, Korea
Objectives: The aim of this study was to investigate the clinical and biochemical profiles according to homeostasis model assessment of insulin resistance (HOMA-IR) in Korean polycystic ovary syndrome (PCOS) patients.
Methods: In 458 PCOS patients diagnosed by the Rotterdam European Society for Human Reproduction and Embryology (ESHRE) criteria, measurements of somatometry, blood test of hormones, glucose metabolic and lipid profiles, and transvaginal or transrectal ultrasonogram were carried out. HOMA-IR was then calculated and compared with the clinical and biochemical profiles related to PCOS. The patients were divided into 4 groups by quartiles of HOMA-IR.
Results: The mean level of HOMA-IR was 2.18 ± 1.73. Among the four groups separated according to HOMA-IR, body weight, body mass index (BMI), waist-to-hip ratio (WHR), triglyceride (TG), total cholesterol, high-density lipoprotein (HDL) cholesterol, low-density lipoprotein (LDL) cholesterol, lipid accumulation product (LAP) index, high-sensitivity C-reactive protein (hs-CRP), Apoprotein B, free testosterone, and sex hormone binding globulin (SHBG) were found to be significantly different. TG, LAP index, glucose metabolic profiles, and hs-CRP were positively correlated with HOMA-IR after adjustment for BMI.
Conclusion: Our results suggest that the clinical and biochemical profiles which are applicable as cardiovascular risk factors are highly correlated with HOMA-IR in Korean women with PCOS.(J Menopausal Med 2014;20:104-110)
Key Words: Cardiovascular diseases, Homeostasis, Insulin resistance, Polycystic ovary syndrome, Risk factors
Received: October 20, 2014 Revised: November 26, 2014 Accepted: November 28, 2014
Address for Correspondence: Kyungah Jeong, Department of Obstetrics and Gynecology, School of Medicine, Ewha Womans University, MokDong Hospital, 1071, Anyangcheon-ro, Yangcheon-gu, Seoul 158-710, Korea
Tel: +82-2-2650-2858, Fax: +82-2-2647-9860, E-mail: [email protected]
Da Eun Lee, et al. HOMA-IR in Korean PCOS
profiles which are applicable cardiovascular risk factors according to HOMA-IR in Korean PCOS patients of reproductive age.
Materials and Methods
1. Subjects
Four hundred fifty-eight patients diagnosed with PCOS were recruited from women who visited the Department of Obstetrics and Gynecology at Ewha Womans University Mokdong Hospital between July 2010 and December 2013.
PCOS was diagnosed according to the 2003 Rotterdam European Society for Human Reproduction and Embryology (ESHRE) criteria,6 when two or more of the following criteria were met: (1) oligo and/or anovulation, (2) clinical and/or biochemical signs of hyperandrogenism, and (3) polycystic ovaries, with an exclusion of other etiologies (congenital adrenal hyperplasia, androgen-secreting tumors, and Cushing’s syndrome).
The institutional review board of the Ewha Womans University Mokdong Hospital approved the study protocol, and written informed consent was obtained from all of the participants.
2. Methods
1) Anthropometric measurements
A through physical examination was performed. Weight, height, waist circumference and hip circumference were measured. Body mass index (BMI) and waist-to-hip ratio (WHR) were calculated.
2) Laboratory measurement
Total testosterone (TT) were measured by the chemi- luminescent immunoassay method by using a commercially available kit (Siemens, Tarrytown, NY, USA), and sex hormone binding globulin (SHBG) levels were measured by immunoradiometric assay by using a commercial kit (Diagnostic Products Corporation, Los Angeles, CA, USA).
17α-Hydroxyprogesterone (17-OHP) levels were measured for exclusion of congenital adrenal hyperplasia. Free testosterone (fT) were calculated by using the formula
available on the web site of the International Society for Study of the Aging Male, (http://www.issam.ch/freetestos.
htm) for TT, SHBG, and albumin levels in the same sample from each subject.
Glucose and insulin were measured at fasting and 2 hr after the 75 g glucose load. Plasma glucose levels were measured by the glucose oxidase method (Beckman Model Glucose Analyzer 2, Beckman Instruments, Fullerton, CA, USA) and insulin levels were measured by radioimmunoassay by using commercially available kit (Biosource, Nivelles, Belgium). HOMA-IR was calculated using a formula of fasting insulin (μU/mL) × fasting glucose (FG; mg/dL)/405.
Hemoglobin A1C (HbA1C), total cholesterol (TC), triglyceride (TG), high-density lipoprotein cholesterol (HDL-C), low-density lipoprotein cholesterol (LDL-C), high-sensitivity C-reactive protein (hs-CRP), and apoprotein B were measured during fasting. Lipid accumulation product (LAP) index was calculated by (waist circumference [cm] - 58) × TGs (mmol/L).
3) Pelvic ultrasound
Pelvic ultrasound examinations were performed with 7 MHz transvaginal or transrectal transducer (LOGIQ 500, General electric medical systems, Miwaukee, WI, USA) to evaluate ovarian volume and follicle number. The virgin women underwent transrectal approach because conventional transvaginal sonography cannot acceptable due to fear for hymenal injury.
The total number of follicles was determined by counting two to nine millimeter sized follicles observed during a scan of the ovary’s longitudinal cross-section. The ovarian volume was calculated using length (cm) × width (cm) × thickness (cm) × 0.523. Patients with ovarian cysts or a history of ovarian surgery were excluded from this study.
4) Classification of subgroups
According to HOMA-IR levels, PCOS patients were classified into four groups (Table 1).
3. Statistics
Statistical analysis was performed using SPSS version 17.0 (SPSS Inc., Chicago, IL, USA). The Kruskal-Wallis test was used for analyzing the differences between the
Journal of Menopausal Medicine 2014;20:104-110
J MM
four groups classified according to HOMA-IR and the three groups classified according to PCOS subgroups. The Pearson product-moment correlation coefficient was used to analyze correlation between the HOMA-IR and clinical, hormonal and metabolic profiles of PCOS. A value of P-value < 0.05 was considered statistically significant.
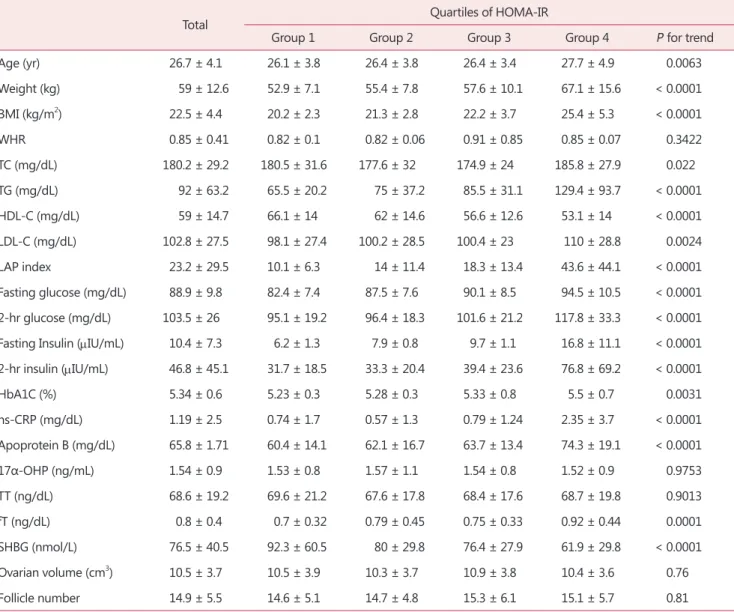
Table 2. Clinical and biochemical profiles of Korean polycystic ovary syndrome patients according to quartiles of homeostasis model assessment of insulin resistance
Total Quartiles of HOMA-IR
Group 1 Group 2 Group 3 Group 4 P for trend
Age (yr) 26.7 ± 4.1 26.1 ± 3.8 26.4 ± 3.8 26.4 ± 3.4 27.7 ± 4.9 0.0063
Weight (kg) 59 ± 12.6 52.9 ± 7.1 55.4 ± 7.8 57.6 ± 10.1 67.1 ± 15.6 < 0.0001
BMI (kg/m2) 22.5 ± 4.4 20.2 ± 2.3 21.3 ± 2.8 22.2 ± 3.7 25.4 ± 5.3 < 0.0001
WHR 0.85 ± 0.41 0.82 ± 0.1 0.82 ± 0.06 0.91 ± 0.85 0.85 ± 0.07 0.3422
TC (mg/dL) 180.2 ± 29.2 180.5 ± 31.6 177.6 ± 32 174.9 ± 24 185.8 ± 27.9 0.022
TG (mg/dL) 92 ± 63.2 65.5 ± 20.2 75 ± 37.2 85.5 ± 31.1 129.4 ± 93.7 < 0.0001
HDL-C (mg/dL) 59 ± 14.7 66.1 ± 14 62 ± 14.6 56.6 ± 12.6 53.1 ± 14 < 0.0001
LDL-C (mg/dL) 102.8 ± 27.5 98.1 ± 27.4 100.2 ± 28.5 100.4 ± 23 110 ± 28.8 0.0024
LAP index 23.2 ± 29.5 10.1 ± 6.3 14 ± 11.4 18.3 ± 13.4 43.6 ± 44.1 < 0.0001
Fasting glucose (mg/dL) 88.9 ± 9.8 82.4 ± 7.4 87.5 ± 7.6 90.1 ± 8.5 94.5 ± 10.5 < 0.0001 2-hr glucose (mg/dL) 103.5 ± 26 95.1 ± 19.2 96.4 ± 18.3 101.6 ± 21.2 117.8 ± 33.3 < 0.0001 Fasting Insulin (mIU/mL) 10.4 ± 7.3 6.2 ± 1.3 7.9 ± 0.8 9.7 ± 1.1 16.8 ± 11.1 < 0.0001 2-hr insulin (mIU/mL) 46.8 ± 45.1 31.7 ± 18.5 33.3 ± 20.4 39.4 ± 23.6 76.8 ± 69.2 < 0.0001
HbA1C (%) 5.34 ± 0.6 5.23 ± 0.3 5.28 ± 0.3 5.33 ± 0.8 5.5 ± 0.7 0.0031
hs-CRP (mg/dL) 1.19 ± 2.5 0.74 ± 1.7 0.57 ± 1.3 0.79 ± 1.24 2.35 ± 3.7 < 0.0001
Apoprotein B (mg/dL) 65.8 ± 1.71 60.4 ± 14.1 62.1 ± 16.7 63.7 ± 13.4 74.3 ± 19.1 < 0.0001
17α-OHP (ng/mL) 1.54 ± 0.9 1.53 ± 0.8 1.57 ± 1.1 1.54 ± 0.8 1.52 ± 0.9 0.9753
TT (ng/dL) 68.6 ± 19.2 69.6 ± 21.2 67.6 ± 17.8 68.4 ± 17.6 68.7 ± 19.8 0.9013
fT (ng/dL) 0.8 ± 0.4 0.7 ± 0.32 0.79 ± 0.45 0.75 ± 0.33 0.92 ± 0.44 0.0001
SHBG (nmol/L) 76.5 ± 40.5 92.3 ± 60.5 80 ± 29.8 76.4 ± 27.9 61.9 ± 29.8 < 0.0001
Ovarian volume (cm3) 10.5 ± 3.7 10.5 ± 3.9 10.3 ± 3.7 10.9 ± 3.8 10.4 ± 3.6 0.76
Follicle number 14.9 ± 5.5 14.6 ± 5.1 14.7 ± 4.8 15.3 ± 6.1 15.1 ± 5.7 0.81
HOMA-IR: homeostasis model assessment of insulin resistance, BMI: body mass index, WHR: waist-to-hip ratio, TC: triglyceride, TG:
triglyceride, HDL-C: high-density lipoprotein cholesterol, LDL-C: low-density lipoprotein cholesterol, LAP: lipid accumulation product, HbA1C: hemoglobin A1C, hs-CRP: high-sensitivity C-reactive protein, 17α-OHP: 17α-hydroxyprogesterone, TT: total testosterone, fT: free testosterone, SHBG: sex hormone binding globulin
Table 1. The quartiles of homeostasis model assessment of insulin resistance
HOMA-IR N
Group 1 ≤ 1.52 109
Group 2 1.52 <, ≤ 1.88 101
Group 3 1.88 <, ≤ 2.47 105
Group 4 > 2.47 143
HOMA-IR: homeostasis model assessment of insulin resistance
Journal of Menopausal Medicine 2014;20:104-110 Da Eun Lee, et al. HOMA-IR in Korean PCOS
Results
1. Clinical and biochemical characteristics of PCOS patients according to the quartile of HOMA-IR
The subjects were young reproductive aged women with a mean age of 26.7 ± 4.1 years. Their BMI was 22.5 ± 4.4 kg/m2 and WHR 0.85 ± 0.41, close to the definition of abdominal obesity by the World Health Organization (WHO).7 Mean TT level was 68.6 ± 19.2 ng/dL, fT was measured at 0.8 ± 0.4 ng/dL, mean ovarian volume at 10.5 ± 3.7 cm3,
and the number of follicles at 14.9 ± 5.5, in accord with the ESHRE criteria for PCOS diagnosis. As the metabolic biomarker of cardiovascular diseases, the mean value of hs-CRP measured 1.19 ± 2.5 mg/dL and apoprotein B was measured with a mean value of 65.8 ± 1.71 mg/dL.
The mean HOMA-IR showed 2.18 ± 1.73. When clinical and biochemical characteristics were compared with the quartile of HOMA-IR, significant differences were shown in age, body weight, BMI, lipid profiles, glucose metabolic profiles, hs-CRP, apoprotein B, fT and SHBG. However,
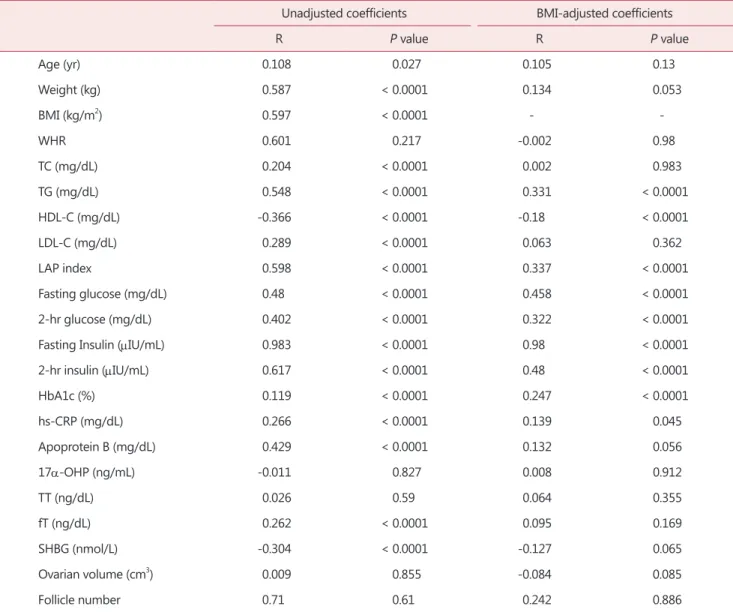
Table 3. Correlation of homeostasis model assessment of insulin resistance and studied variables
Unadjusted coefficients BMI-adjusted coefficients
R P value R P value
Age (yr) 0.108 0.027 0.105 0.13
Weight (kg) 0.587 < 0.0001 0.134 0.053
BMI (kg/m2) 0.597 < 0.0001 - -
WHR 0.601 0.217 -0.002 0.98
TC (mg/dL) 0.204 < 0.0001 0.002 0.983
TG (mg/dL) 0.548 < 0.0001 0.331 < 0.0001
HDL-C (mg/dL) -0.366 < 0.0001 -0.18 < 0.0001
LDL-C (mg/dL) 0.289 < 0.0001 0.063 0.362
LAP index 0.598 < 0.0001 0.337 < 0.0001
Fasting glucose (mg/dL) 0.48 < 0.0001 0.458 < 0.0001
2-hr glucose (mg/dL) 0.402 < 0.0001 0.322 < 0.0001
Fasting Insulin (mIU/mL) 0.983 < 0.0001 0.98 < 0.0001
2-hr insulin (mIU/mL) 0.617 < 0.0001 0.48 < 0.0001
HbA1c (%) 0.119 < 0.0001 0.247 < 0.0001
hs-CRP (mg/dL) 0.266 < 0.0001 0.139 0.045
Apoprotein B (mg/dL) 0.429 < 0.0001 0.132 0.056
17α-OHP (ng/mL) -0.011 0.827 0.008 0.912
TT (ng/dL) 0.026 0.59 0.064 0.355
fT (ng/dL) 0.262 < 0.0001 0.095 0.169
SHBG (nmol/L) -0.304 < 0.0001 -0.127 0.065
Ovarian volume (cm3) 0.009 0.855 -0.084 0.085
Follicle number 0.71 0.61 0.242 0.886
BMI: body mass index, WHR: waist-to-hip ratio, TC: triglyceride, TG: triglyceride, HDL-C: high-density lipoprotein cholesterol, LDL-C: low- density lipoprotein cholesterol, LAP: lipid accumulation product, HbA1C: hemoglobin A1C, hs-CRP: high-sensitivity C-reactive protein, 17α-OHP: 17α-hydroxyprogesterone, TT: total testosterone, fT: free testosterone, SHBG: sex hormone binding globulin
Journal of Menopausal Medicine 2014;20:104-110
J MM
ovarian volume and follicle number did not show a statistical difference (Table 2).
2. Characteristics of PCOS patients and corre la - tion to HOMA-IR
In PCOS patients, HOMA-IR showed a statistically significant correlation with weight and BMI. In regards to glucose metabolism, fasting and 2-hr glucose and insulin also showed significant positive correlation. TC, TG, LDL-C, LAP index showed a positive correlation while HDL-C showed a negative correlation. A positive correlations were detected with hs-CRP and apoprotein B. While no significant correlation was observed with TT, positive correlation was observed with fT (R = 0.262, P < 0.0001) and a negative correlation with SHBG (R = -0.304, P < 0.0001). There was no correlation with ovarian volume and follicle number.
Taking into account the interrelationship between insulin resistance and obesity, the correlation between clinical and biochemical profiles of PCOS and HOMA-IR were observed again after adjusted with BMI. The revised results showed a significant positive correlation between TG, LAP index, glucose metabolic profiles, and hs-CRP, in addition to a significant negative correlation with HDL (Table 3).
Discussion
As insulin resistance is the reduction in the biological effect of insulin’s metabolic action,8 it is a major mechanism of metabolic feature in PCOS, that is closely linked with a rise in cardiovascular risk among PCOS patients.
Nevertheless, the consensus in measuring insulin resistance in PCOS patients is lacking. Therefore, in this study, insulin resistance was measured through HOMA-IR and its relationship to clinical and biochemical characteristics of PCOS was observed. These results showed a significant correlation between HOMA-IR and the major areas of metabolic cardiovascular risk factors.
The results of this study showed a significant correlation between HOMA-IR and TG, LDL and HDL. El-Mazny et al.9 investigated the association of insulin resistance with dyslipidemia and metabolic syndrome in 50 infertile women with PCOS. They defined insulin resistance when
FG to insulin ratio was less than 4.5. Their study presented a noticeable difference in TC, LDL, and TG, and a notably low HDL in insulin resistant group. This can be explained as a mechanism which, as a result of increase in catecholamine- induced lipolysis due to PCOS patients’ insulin resistance and hyperandrogenemia in adipocyte, free fatty acids are released in circulation and results in an increase of very low density lipoprotein and LDL in the liver and a decrease in HDL.10
LAP index is a simple tool, which uses waist circumference and TG level, known to observe lipid accumulation to accurately identify cardiovascular risk more so than BMI.11 Results of this study show that LAP showed a positive correlation in both HOMA-IR with pre- and post-BMI revisions. This was also shown a same positive correlation (R = 0.70, P < 0.001) between LAP index and HOMA- IR. Wiltgen et al.12 demonstrated the LAP index, an easily obtainable measure, is associated with HOMA index and an LAP index ≥ 34.5 is an additional risk factor for cardiovascular disease in PCOS patients. In our study, group 4, the highest quartile of HOMA-IR showed 43.6 ± 44.1 of LAP index, which may be regarded as a risk factor for cardiovascular disease in PCOS.
Pesant and Baillargeon13 determined that using glucose excursion during the previously normal oral glucose tole- rance test (OGTT) in combination with increased FG or glycosylated hemoglobin could reduce the number of OGTTs performed in PCOS women during their regular follow- ups without missing any conversion to abnormal glucose tolerance.
A recent research investigated whether insulin resistance in PCOS is exclusively associated with BMI and suggested specific HOMA-IR cutoff value for insulin resistance in lean and overweight/obese PCOS.14
Most women may have a few chances of developing meta- bolic syndrome during their life, such as pregnancy-re- lated weight gain, hormonal contraceptive use and PCOS.
Additionally, menopause may be related with the prevalence of metabolic syndrome and increased cardiovascular disease and diabetes.15 In postmenopausal Korean women who had received combined estrogen and progesterone therapy, or tibolone, the levels of TC decreased although a prospective study including a larger group will be required.16 Recent
Journal of Menopausal Medicine 2014;20:104-110 Da Eun Lee, et al. HOMA-IR in Korean PCOS
menopausal data suggest that the majority of women who had PCOS during their reproductive years continue to manifest cardiovascular risk factors.17 Moving from the young fertile age to the 40s and the menopause the prevalence of type II diabetes continues to increase compared to the general female population and may reach 10-16% of PCOS women.18 After 20 years of follow-up in women with PCOS, androgens and ovarian volume decreased and there were more ovulatory cycles suggesting a milder disorder, whereas metabolic abnormalities persisted and waist circumference increased.19 However, the well- described cardiovascular/metabolic risk profile in pre- and perimenopausal PCOS women does not entail an evident increase in cardiovascular events during the postmenopausal period.20 Because whether PCOS itself causes an increased cardiovascular disease risk later in life is still uncertain, additional longitudinal study for following women with PCOS into menopause will help to determine continuous careful investigations and screening for cardiovascular disease.21
The purpose of this study is to provide Korean domestic data on HOMA-IR of 458 reproductive aged women diag- nosed with PCOS and to look into the relationship between clinical and biochemical profiles of PCOS. HOMA-IR shows a positive correlation in considerable areas to risk factors of metabolic cardiovascular diseases. Especially, TG, HDL, LAP index and hs-CRP showed a significant relation with HOMA-IR after adjusted with BMI. In PCOS patients with metabolic syndromes, the risk assessment for cardiovascular disease is important and utilization of HOMA-IR instead of hyperinsulinemic-euglycemic clamp technique is probable clinically to assess cardiovascular risk as a simple and convenient tool.
In conclusion, our results suggest that clinical and biochemical profiles which are applicable cardiovascular risk factors are highly correlated with HOMA-IR in Korean women with PCOS.
Acknowledgement
This study was supported by a grant from the Korea Centers for Disease Control and Prevention.
Conflict of Interest
No potential conflict of interest relevant to this article was reported.
References
1. Norman RJ, Dewailly D, Legro RS, Hickey TE. Polycystic ovary syndrome. Lancet 2007; 370: 685-97.
2. Scicchitano P, Dentamaro I, Carbonara R, Bulzis G, Da- chille A, Caputo P, et al. Cardiovascular Risk in Women With PCOS. Int J Endocrinol Metab 2012; 10: 611-8.
3. Legro RS, Castracane VD, Kauffman RP. Detecting insulin resistance in polycystic ovary syndrome: purposes and pitfalls. Obstet Gynecol Surv 2004; 59: 141-54.
4. Nawrocka-Rutkowska J, Ciećwież S, Marciniak A, Brodowska A, Wiśüniewska B, Kotlega D, et al. Insulin re sistance assessment in patients with polycystic ovary syndrome using different diagnostic criteria-impact of metformin treatment. Ann Agric Environ Med 2013; 20:
528-32.
5. Wallace TM, Matthews DR. The assessment of insulin resistance in man. Diabet Med 2002; 19: 527-34.
6. Rotterdam ESHRE/ASRM-Sponsored PCOS Consensus Workshop Group. Revised 2003 consensus on diagnostic criteria and long-term health risks related to polycystic ovary syndrome. Fertil Steril 2004; 81: 19-25.
7. World Health Organization. Waist circumference and waist-hip ratio: report of a WHO expert consultation, Geneva, 8-11 December 2008. Geneva, CH: World Health Organization, 2012. [Cited by 2012 April 20]. Available from:
http://whqlibdoc.who.int/publications/2011/9789241501491_
eng.pdf.
8. Galluzzo A, Amato MC, Giordano C. Insulin resistance and polycystic ovary syndrome. Nutr Metab Cardiovasc Dis 2008; 18: 511-8.
9. El-Mazny A, Abou-Salem N, El-Sherbiny W, El-Mazny A.
Insulin resistance, dyslipidemia, and metabolic syndrome in women with polycystic ovary syndrome. Int J Gynaecol Ob- stet 2010; 109: 239-41.
10. Diamanti-Kandarakis E, Papavassiliou AG, Kandarakis SA, Chrousos GP. Pathophysiology and types of dyslipidemia in PCOS. Trends Endocrinol Metab 2007; 18: 280-5.
11. Kahn HS. The“lipid accumulation product”performs better than the body mass index for recognizing cardio- vascular risk: a population-based comparison. BMC Car-
Journal of Menopausal Medicine 2014;20:104-110
J MM
diovasc Disord 2005; 5: 26.
12. Wiltgen D, Benedetto IG, Mastella LS, Spritzer PM. Lipid accumulation product index: a reliable marker of car- diovascular risk in polycystic ovary syndrome. Hum Reprod 2009; 24: 1726-31.
13. Pesant MH, Baillargeon JP. Clinically useful predictors of conversion to abnormal glucose tolerance in women with polycystic ovary syndrome. Fertil Steril 2011; 95: 210-5.
14. Alebić MS, Bulum T, Stojanović N, Duvnjak L. Definition of insulin resistance using the homeostasis model assessment (HOMA-IR) in IVF patients diagnosed with polycystic ovary syndrome (PCOS) according to the Rotterdam criteria.
Endocrine 2014; 47: 625-30.
15. Han M. Metabolic syndrome emerging from menopause. J Korean Soc Menopause 2011; 17: 127-35.
16. Namkung J, Kim JH, Jo HH, Oh EK, Cheon K, Kwon DJ, et al. Comparison of the effects of hormone replacement therapy on bone mineral density, lipid profiles, and bio-
chemical markers of bone metabolism. J Korean Soc Menopause 2010; 16: 107-15.
17. Welt CK, Carmina E. Clinical review: Lifecycle of polycystic ovary syndrome (PCOS): from in utero to menopause. J Clin Endocrinol Metab 2013; 98: 4629-38.
18. Carmina E. Polycystic ovary syndrome: metabolic conse- quences and long-term management. Scand J Clin Lab Invest Suppl 2014; 244: 23-6.
19. Carmina E, Campagna AM, Lobo RA. A 20-year follow- up of young women with polycystic ovary syndrome. Obstet Gynecol 2012; 119: 263-9.
20. Schmidt J, Landin-Wilhelmsen K, Brännström M, Dahlgren E. Cardiovascular disease and risk factors in PCOS women of postmenopausal age: a 21-year controlled follow-up study. J Clin Endocrinol Metab 2011; 96: 3794-803.
21. Shah D, Bansal S. Polycystic ovaries - beyond menopause.
Climacteric 2014; 17: 109-15.