D I A B E T E S & M E T A B O L I S M J O U R N A L D I A B E T E S & M E T A B O L I S M J O U R N A L
This is an Open Access article distributed under the terms of the Creative Commons Attribution Non-Commercial License (http://creativecommons.org/licenses/by-nc/4.0/) which permits unrestricted non-commercial use, distribution, and reproduction in any medium, provided the original work is properly cited.
Association of Soybean Food Intake and
Cardiometabolic Syndrome in Korean Women: Korea National Health and Nutrition Examination Survey (2007 to 2011)
Sook-Hyun Jun1, Woo-Kyoung Shin2, Yookyung Kim1
1Department of Human Ecology, Graduate School of Korea University, Seoul,
2Department of Preventive Medicine, Seoul National University College of Medicine, Seoul, Korea
Background: Soybean food consumption has been considered as a possible way to lower incidence of cardiometabolic syndrome (CMS) among Asians. However, results from studies investigating its efficacy on CMS in Asians have been inconsistent.
Methods: We analyzed the association between soybean intake frequency and prevalence of CMS based on data from the Korea National Health and Nutrition Examination Survey 2007 to 2011. Data of 9,287 women aged 20 to 64 years were analyzed. Food frequency questionnaire was used to assess soybean food consumption frequency. General linear model and multivariable logistic regression model were used to examine the association of soybean intake quintile with CMS and its risk factors. Least square means of metabolic factors mostly showed no significant relevance except liver indexes.
Results: Compared to participants in the 1st quintile (<2 times/week of soybean food), odds ratios (OR) for CMS and abdominal obesity (AO) in the 4th quintile (8.5 times/week<soybean food≤17 times/week) were 0.73 (95% confidence interval [CI], 0.57 to 0.95) and 0.72 (95% CI, 0.58 to 0.90), respectively. After excluding Tofu products, ORs of CMS, AO, high blood pressure, and hy- pertriglyceridemia were lower than those without excluding Tofu products. However, results still did not show significant inverse linear trend across frequency quintiles.
Conclusion: Our findings suggest that soybean intake of 8.5 to 17 times/week was inversely associated with CMS in Korean women. The relation between soybean intake >17 times/week and CMS varied depending on soybean food items.
Keywords: Diabetes mellitus; Korea; Obesity, abdominal; Soy foods
Corresponding authors: Yookyung Kim https://orcid.org/0000-0002-8438-0121 Department of Human Ecology, Graduate School of Korea University, 145 Anam-ro, Seongbuk-gu, Seoul 02841, Korea
E-mail: [email protected]
Woo-Kyoung Shin https://orcid.org/0000-0003-2725-4652
Department of Preventive Medicine, Seoul National University College of Medicine, 101 Daehak-ro, Jongno-gu, Seoul 03080, Korea
INTRODUCTION
Increasing prevalence of cardiometabolic syndrome (CMS) is a health concern worldwide. According to the World Health Organization, some developing countries with population ad- hering to their traditional eating habits such as those in South East Asia do not show increase in incidence of CMS. However,
countries that adapted to western diet such as Iran had inci- dence of CMS that was even higher than certain developed countries [1]. Similarly, the prevalence of type 2 diabetes melli- tus (T2DM), one of conditions of CMS, has been lower in Asian populations than that in Western countries [2]. CMS preva- lence in South Korea increased between the mid-1990s and mid-2000s. However, in 2013, it was 28.9% without a signifi- https://doi.org/10.4093/dmj.2019.0078
pISSN 2233-6079 · eISSN 2233-6087
cant increasing or decreasing trend for the past 5 years [3]. On the contrary, in the United States, nearly 35% of all adults and 50% of those aged 60 years or older were estimated to have CMS in 2012. The rate had been increasing for the past 10 years [4].
Soybeans and other processed soybean food have been con- sumed for a long time in Asia to compensate incomplete pro- tein content in rice. Asians typically consume 9 to 30 g of soy- beans per day, with individual and regional variations [5]. Ac- cording to the Korean National Nutrition Survey [6], daily mean intake of total genistein and daidzein in the Korean pop- ulation is estimated to be 21.0 mg per person. This means that a Korean consumes more isoflavones than a person who lives in United States or Europe [7]. Dietary isoflavone is consumed by only 35% of adults in a day with an average intake of 3.1 mg/
day, resulting in a mean intake of 1.0 mg/day for all United States adults [8]. Frequent intake of cultivated soybean food which is unique to traditional Asian cuisines is not common in western diet. This seems to have relation with the lower inci- dence of CMS among Asians [9,10].
Although there are several epidemiologic and experimental data reporting an inverse relationship of the consumption of soybean with several metabolic disorders [11-13], several stud- ies have found no clear association between soy intake and in- cidence of cardio metabolic disorders [10,14,15]. According to some randomized clinical trials, soybean food consumption does not show any improvement for insulin resistance, serum glucose level, or lipid profiles [16,17]. Furthermore, soybean intake tends to have sex dependent effects on risk of CMS and specific cancer [18,19].
Overall, research results about the effect of soybean con- sumption on CMS, especially among metabolically healthy women, were inconsistent [10,14,20]. Papers suggesting that soybean consumption was not associated with CMS were mostly based on people who did not routinely eat soybean food or eat small amounts of them [17,21]. Thus, it is necessary to examine effects of soybean foods on healthy women who eat soybeans on a daily basis.
For South Korean population, studies on this topic have also shown conflicting results recently. Several findings suggested that soybeans had protective effects against CMS among obese women [22,23]. However, other studies did not find a signifi- cant relation between soybean food intake and CMS [20].
Thus, the objective of this study was to investigate the associa- tion between CMS and soybean food intake among South Ko- rean women.
METHODS
Participants
In this study, we used data from the Korea National Health and Nutrition Examination Survey (KNHANES) IV and V (2007 to 2011). It contains health interview survey, physical examination research, and nutrition questionnaires. Stratified multistage sampling design was used. Sampling was done according to geographical area, residential environmental type, age, and sex.
All participants provided written informed consent before their participation. Initial candidates for the present study were those having completed nutrition questionnaires. We then ex- cluded subjects who were men (n=12,891) and those who were under 19 years of age or over 64 years of age (n=5,194). Addi- tionally, we excluded people who reported to intake implausi- ble amount of total energy (n=85; <450 or >6,300 kcal/day for women) as data from those participants could not be applied to the general population. They could cause distortion of data.
We excluded people whose daily energy intake was less than 25% or over 300% of the estimated energy requirements (EER).
According to the Dietary Reference Intakes for Koreans 2015 (KDRI) [24], the EER for the adult is from 1,800 to 2,100 kcal, with less than 25% being 450 and over 300% being 6,300 kcal [24,25]. Pregnant (n=198) and lactating women (n=282) were also excluded because their physiological conditions were changed during pregnancy and breast feeding. We also exclud- ed those who had already been diagnosed by their doctors with diabetes mellitus (n=429), hypertension (n=1,330), or hyper- lipidemia (n=399). In addition, we excluded subjects who had not completed anthropometric examination or a blood test (n=893). Finally, 9,287 participants were included in the final analysis. Fig. 1 shows the entire flow of participant selection.
Demographic and health behavior
Trained interviewers collected data of demographic factors and health behaviors of participants via personal interviews.
Demographic variables included age, sex, achieved educational level (high school education or less, and college education or more), and monthly household income (tertile of equivalized household income). Equivalized household income was calcu- lated as total monthly household income divided by the square root of the total number of household members. Health behav- ioral variables included smoking, alcohol consumption, and physical activity. Participants were asked to choose whether they were never smokers or were past or present smokers. The
average amount and number of consumed alcoholic beverages was assessed by self-questionnaire. It was then assigned into five groups based on frequency per week. Physical activity was quantified as metabolic equivalent of task minutes per 7 days (MET-minutes per week). It was calculated using the scoring protocol of the Korean version of the International Physical Activity Questionnaire (IPAQ) form [26]. MET means energy expenditure per kg/minute (kcal/min/kg). MET-minutes was calculated as ‘MET level of each behavior×minute×frequency/
week.’ Met level of light intensity activities (walking 4.8 km/hr) was 3.3 METs. Moderate intensity activities had 4.0 METs and vigorous intensity activities had 8.0 METs. Participants were asked to choose whether they performed low, moderate, or high physical activity. Physical activity levels were then classi- fied as low (<600 MET-minutes per week), moderate (more than 600 but less than 3,000 MET-minutes per week), or high
(>3,000 MET-minutes per week).
Dietary assessment
Dietary assessments were conducted by using food frequency questionnaire (FFQ). FFQ consisted of 63 mainly consumed food items in South Korea with 10 categories of frequency value (almost never, 6 to 11 times/year, 1 time/month, 2 to 3 times/
month, 1 time/week, 2 to 3 times/week, 4 to 6 times/week, 1 time/day, 2 times/day, 3 times/day). Soybean food consisted of three items: soybean group (which contained rice with soy- bean, beans cooked in soy sauce, etc.), tofu group (which con- tained tofu put in soup, stew, flat cake, boiled down in soy sauce or other seasonings, soft tofu), and soybean milk group.
All analyses accounted for the complex sampling design effect and appropriate sampling weights of the national survey. We converted the soybean FFQ into daily intake frequency and Fig. 1. Flow chart of participants. KNHANES, Korea National Health and Nutrition Examination Survey; DM, diabetes mellitus;
HTN, hypertension.
42,347 KNHANES 2007–2011
30,560 Complete nutrition survey
n=17,669
n=12,475
n=12,390
n=11,910
n=10,180
9,287 Total participants in final analysis
11,787 No information of dietary assessment
12,891 Men
<19 or >64 years of age (n=5,194)
85 Implausible energy intake
198 Women with pregnancy 282 Women with lactating
Already diagnosed as 429 DM, 1,330 HTN, 399 hyperlipidemia 893 No information of anthropometry and
biomarker
then grouped it into quintile according to the number of par- ticipants proportionally. Energy intake variables used in this study were extracted from 24-hour recall data. They included total energy (kcal/day), carbohydrate (g/day), protein (g/day), total fat (g/day), and sodium (mg/day) intakes presented as to- tal energy adjusted values using the residual method.
Anthropometric examination and blood test
Physical examination was performed by well-trained medical staff following standard procedures. Body weight and height were measured to 0.1 kg and 0.1 cm, respectively, with partici- pant wearing indoor clothing without shoes. Waist circumfer- ence (WC) was measured at the narrowest point between the lower border of the rib cage and the iliac crest. Body mass in- dex (BMI) was calculated as the ratio of weight (kg)/height squared (m2). Blood pressure (BP) was measured for the right arm using a mercury sphygmomanometer (Baumanometer 0850 wall unit 33; W.A. Baum Co. Inc., Copiague, NY, USA) three times per subject by trained nurses. Before 2011, the height of the arm on which BP was measured was different by year. Thus, we used corrected BP variables to prevent the issue of combining BP data from different years. Levels for total cho- lesterol (TC), high density lipoprotein cholesterol (HDL-C), triglyceride (TG), and glucose, and so on were measured using blood samples obtained from the antecubital vein after a 12- hour overnight fast. Fasting plasma glucose (FPG), TC, TG, and HDL-C levels were evaluated using a Hitachi 700-110 Chemistry Analyzer (Hitachi, Tokyo, Japan). Fasting insulin levels were estimated by immunoradiometric assay (Biosource, Louvain-la-Neuve, Belgium) using a γ-counter (1470 Wizard;
PerikinElmer, Turku, Finland). glycosylated hemoglobin (HbA1c) was measured by high performance liquid chroma- tography (HLC-723G7; Tosch, Tokyo, Japan).
Definition of cardiometabolic syndrome and cardiometabolic syndrome score
CMS is a combination of metabolic disorders or risk factors, in- cluding a combination of diabetes mellitus, systemic arterial high BP, central obesity, and hyperlipidemia. Definitions for CMS and its components were obtained from the National Cho- lesterol Education Program Adult Treatment Panel III guideline.
We used the ethnicity-specific values for WC based on data from the World Health Organization and the Korean Society for the Study of Obesity [27]. CMS was defined by the presence of three or more of the following risk factors: central obesity
(WC ≥90 cm for men, and ≥85 cm for women); high BP (sys- tolic BP ≥130 mm Hg and diastolic BP ≥85 mm Hg, or using antihypertension drug); fasting glucose levels ≥100 mg/dL;
TG levels ≥150 mg/dL; and low HDL-C levels (<40 mg/dL for men, and <50 mg/dL for women). If each criterion is met, a score of one point is imposed. We named this as CMS score, ranging from 0 to 5 points. Those with CMS score of more than 3 points were classified as having metabolic syndrome (MetS).
Definitions of other cardio metabolic variables
Homeostasis model assessment (HOMA) is the most broadly used in epidemiologic research [28]. Homeostasis model as- sessment of insulin resistance (HOMA-IR) is a test for insulin resistance while HOMA-β indicates insulin formation poten- tial regarding pancreatic β-cell function [28]. These two HOMA parameters are calculated as follows:
H OMA-IR=fasting insulin (µIU/mL)×FPG (mg/dL)/
22.5×18
H OMA-β=20×fasting insulin (µIU/mL)/FPG (mg/dL)/
18–3.5
Nonalcoholic fatty liver disease (NAFLD) is defined as the presence of cytoplasmic lipid droplets in more than 5% of he- patocytes in individuals without significant alcohol consump- tion and negative viral and autoimmune liver diseases [29].
Presence of NAFLD has recently been considered as the hepat- ic component of CMS as it is a result of obesity for which there is ectopic accumulation of TG in the liver parenchyma [30].
Based on significant evidence, NAFLD appears to play an im- portant role in the disease mechanism of metabolic disorders [30].
As a standard diagnosis for NAFLD, “NAFLD liver fat score”
is mainly based on magnetic resonance spectroscopy [31]. It has 95% sensitivity and specificity.
N AFLD liver fat score=–2.89+1.18×(CMS: yes=1/no=0)+
0.45×(T2DM: yes=1/no=0)+0.15×(fasting serum insulin, µIU/mL)+0.04×(AST, IU/L)–0.94×(AST/ALT)
Statistical analysis
All statistical analyses were performed using SAS software ver- sion 9.4 (SAS Institute Inc., Cary, NC, USA). All analyses ac- counted for the complex sampling design effect and appropri- ate sampling weights of the national survey using SAS Proc survey. We applied a sample weighting in the analysis using weight code in Proc survey procedure. A two-tailed P value
<0.05 was considered to be statistically significant. Values for demographic, health-related behavior, and biochemical vari- ables were expressed as mean±standard deviation (SD) for continuous variables or number of participants (percentage) for categorical variables. Calculated probability derived from either analysis of variance (ANOVA) comparing mean values (for continuous variables) or chi-square tests comparing distri- bution of categorical variables was used to test differences by soybean food intake.
Cardio metabolic factors derived from several blood test re- sults are expressed as mean±SD across quintiles of soybean food intake. Significance determined by general linear model (GLM) with Tukey multiple comparisons test (P<0.05) after adjusting for education (high school or less, college or more), income (tertile of equivalized household income), physical ac- tivity (low, moderate, high), smoking status (nonsmoker, ex- smoker, current smoker), alcohol consumption (times/week), total energy (kcal/day), carbohydrate (g/day), total fat (g/day), protein (g/day), and sodium (mg/1,000 kcal) intakes as contin- uous variables. We used the residual method to account for ef- fects of total energy intake on each nutrient as a confounding factor to CMS. PROC GLM procedure was used to examine a linear trend (P for trend) across soybean consumption catego- ries by using median value within each exposure category.
Multivariable logistic regression (MLR) analysis was per- formed to estimate the odds ratio (OR) and 95% confidence interval (CI) of individual component of CMS according to soybean food intake quintiles using the lowest quintile as refer- ence. We developed three different models which adjusted confounders. When we chose covariates for multivariable model, we referred to results of analysis for baseline character- istics of study subjects by soybean food consumption. ORs were initially calculated following adjustment for age in model 1. In model 2, categorical variables were further adjusted for education, monthly household income, physical activity, smoking status, and alcohol consumption activity. Dietary fac- tors such as total energy, carbohydrate, protein, total fat, and sodium intakes were additionally adjusted for as continuous variables in model 3. We applied three types of model to know the influence of each model of confounders on ORs. The prev- alence of high BP, hyperlipidemia, T2DM, myocardial infarc- tion/ angina pectoris, stroke was compared across soybean food intake groups. MLR analyses were performed to estimate ORs and 95% CI with the lowest quintile group as the refer- ence group after adjusting for confounding variables by the
three models as described above.
RESULTS
General characteristics of participants according to soybean food intake
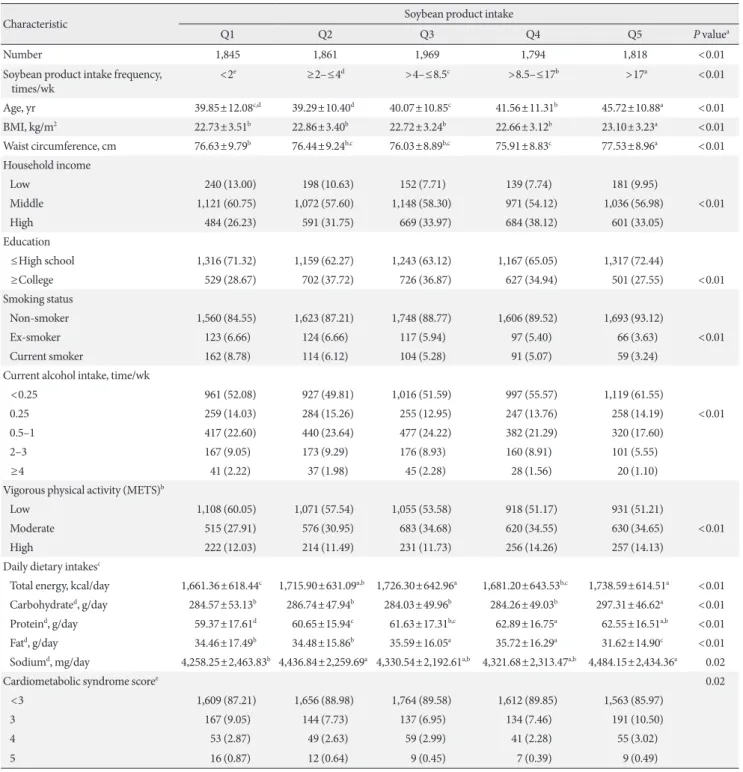
According to soybean food consumption, CMS score, socio demographic, anthropometric, and biochemical characteris- tics of participants are presented in Table 1. CMS score means the score corresponding to CMS component. With higher quintiles of soybean intake, age and high intensity exercise of participants also increased. The percentage of current smoker decreased with higher quintile of soybean intake. Statistical analysis results from either ANOVA comparing mean values or chi-square test comparing distribution of categorical vari- ables showed significant difference by soybean food intake fre- quency. Variables such as age, CMS score, household income, education, smoking status, current alcohol intake, vigorous physical activity, and daily dietary intake were designated as confounders.
Cardiometabolic factors according to soybean food intake Table 2 shows relationships between several variables related to cardio metabolic diseases and soybean product intake. When comparing average values, all variables were significantly (P<
0.05) different across soybean intake quintiles except fasting serum insulin and HOMA-IR. Especially, the 5th quintile had significant difference in all variables except fasting serum insu- lin and HOMA-IR. However, the least square means of those variables after adjusting for various covariates (age, education, income, physical activity, smoking status, alcohol consump- tion, total energy intake, energy adjusted carbohydrate daily intake, energy adjusted protein daily intake, energy adjusted fat daily intake, energy adjusted sodium daily intake) signifi- cance disappeared except for aspartate aminotransferase/ala- nine aminotransferase (AST/ALT) and HOMA-β. P values for trend in AST/ALT using median value of soybean product in- take quintile after adjusting for the same confounders listed above showed marginally significant linearity across soybean food intake groups.
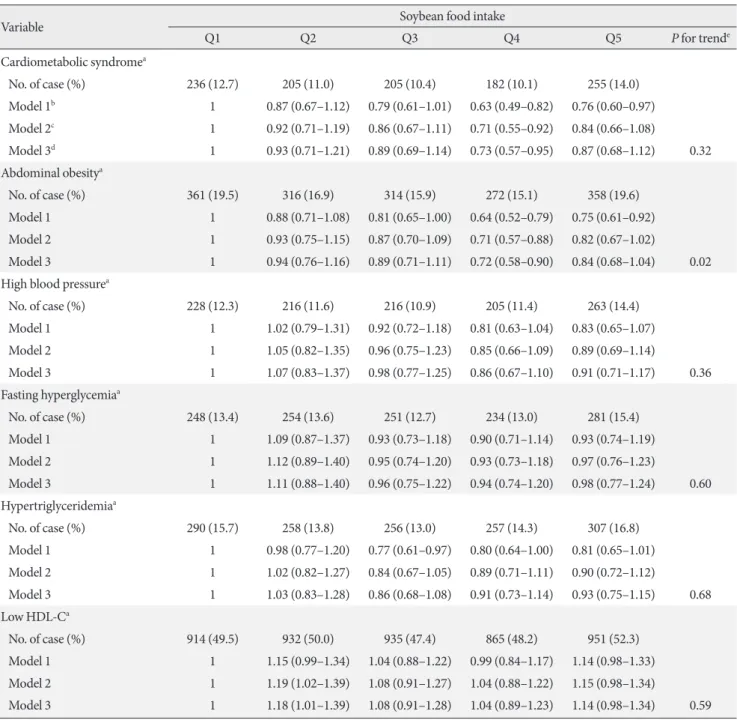
Soybean food intake and cardiometabolic syndrome Soybean food intake was related to CMS and abdominal obesi- ty (AO) after adjusting for various confounders as shown in Ta- ble 3. Participants in the 4th (more than 8.5 to 17 or 17 times/
Table 1. General characteristics of participants according to soybean product intake
Characteristic Soybean product intake
Q1 Q2 Q3 Q4 Q5 P valuea
Number 1,845 1,861 1,969 1,794 1,818 <0.01
Soybean product intake frequency,
times/wk <2e ≥2–≤4d >4–≤8.5c >8.5–≤17b >17a <0.01
Age, yr 39.85±12.08c,d 39.29±10.40d 40.07±10.85c 41.56±11.31b 45.72±10.88a <0.01
BMI, kg/m2 22.73±3.51b 22.86±3.40b 22.72±3.24b 22.66±3.12b 23.10±3.23a <0.01
Waist circumference, cm 76.63±9.79b 76.44±9.24b,c 76.03±8.89b,c 75.91±8.83c 77.53±8.96a <0.01 Household income
Low 240 (13.00) 198 (10.63) 152 (7.71) 139 (7.74) 181 (9.95)
Middle 1,121 (60.75) 1,072 (57.60) 1,148 (58.30) 971 (54.12) 1,036 (56.98) <0.01
High 484 (26.23) 591 (31.75) 669 (33.97) 684 (38.12) 601 (33.05)
Education
≤High school 1,316 (71.32) 1,159 (62.27) 1,243 (63.12) 1,167 (65.05) 1,317 (72.44)
≥College 529 (28.67) 702 (37.72) 726 (36.87) 627 (34.94) 501 (27.55) <0.01
Smoking status
Non-smoker 1,560 (84.55) 1,623 (87.21) 1,748 (88.77) 1,606 (89.52) 1,693 (93.12)
Ex-smoker 123 (6.66) 124 (6.66) 117 (5.94) 97 (5.40) 66 (3.63) <0.01
Current smoker 162 (8.78) 114 (6.12) 104 (5.28) 91 (5.07) 59 (3.24)
Current alcohol intake, time/wk
<0.25 961 (52.08) 927 (49.81) 1,016 (51.59) 997 (55.57) 1,119 (61.55)
0.25 259 (14.03) 284 (15.26) 255 (12.95) 247 (13.76) 258 (14.19) <0.01
0.5–1 417 (22.60) 440 (23.64) 477 (24.22) 382 (21.29) 320 (17.60)
2–3 167 (9.05) 173 (9.29) 176 (8.93) 160 (8.91) 101 (5.55)
≥4 41 (2.22) 37 (1.98) 45 (2.28) 28 (1.56) 20 (1.10)
Vigorous physical activity (METS)b
Low 1,108 (60.05) 1,071 (57.54) 1,055 (53.58) 918 (51.17) 931 (51.21)
Moderate 515 (27.91) 576 (30.95) 683 (34.68) 620 (34.55) 630 (34.65) <0.01
High 222 (12.03) 214 (11.49) 231 (11.73) 256 (14.26) 257 (14.13)
Daily dietary intakesc
Total energy, kcal/day 1,661.36±618.44c 1,715.90±631.09a,b 1,726.30±642.96a 1,681.20±643.53b,c 1,738.59±614.51a <0.01 Carbohydrated, g/day 284.57±53.13b 286.74±47.94b 284.03±49.96b 284.26±49.03b 297.31±46.62a <0.01 Proteind, g/day 59.37±17.61d 60.65±15.94c 61.63±17.31b,c 62.89±16.75a 62.55±16.51a,b <0.01
Fatd, g/day 34.46±17.49b 34.48±15.86b 35.59±16.05a 35.72±16.29a 31.62±14.90c <0.01
Sodiumd, mg/day 4,258.25±2,463.83b 4,436.84±2,259.69a 4,330.54±2,192.61a,b 4,321.68±2,313.47a,b 4,484.15±2,434.36a 0.02
Cardiometabolic syndrome scoree 0.02
<3 1,609 (87.21) 1,656 (88.98) 1,764 (89.58) 1,612 (89.85) 1,563 (85.97)
3 167 (9.05) 144 (7.73) 137 (6.95) 134 (7.46) 191 (10.50)
4 53 (2.87) 49 (2.63) 59 (2.99) 41 (2.28) 55 (3.02)
5 16 (0.87) 12 (0.64) 9 (0.45) 7 (0.39) 9 (0.49)
Values are presented as mean±standard deviation or number (%).
METS, metabolic equivalent of task minutes.
aP value derived from either analysis of variance (ANOVA), comparing mean values, or chi-square test comparing distribution of categorical variables, bVigorous physical activity (METS): low (<600 MET-minutes per week), moderate (≥600 to <3,000 MET-minutes per week), high (≥3,000 MET-minutes per week), cDi- etary intake variables were obtained from 24-hour recall data of Korea National Health and Nutrition Examination Survey, dDietary intake variables, except for total energy, were energy adjusted using the residual method, eCardiometabolic syndrome score: cardiometabolic syndrome was defined using the National Cho- lesterol Education Program Adult Treatment Panel III criteria with a modified waist circumference cutoff for Korean adults if any three or more of the five compo- nents were present. Five components: (1) abdominal obesity (waist circumference ≥90 cm in male, ≥85 cm in female); (2) high blood pressure (≥130/85 mm Hg); (3) fasting hyperglycemia (≥100 mg/dL); (4) hypertriglyceridemia (≥150 mg/dL); and (5) low HDL-C (<40 mg/dL in male, <50 mg/dL in female). The number corresponding to the component was scored.
week) and the 5th (more than 17 times/week) quintiles of soy- bean food intake had significantly lower ORs for having CMS than those in the 1st quintile (less than 2 times/week) after ad- justing for age ([OR, 0.63; 95% CI, 0.49 to 0.82] and [OR, 0.76;
95% CI, 0.60 to 0.97], respectively). However, only ORs of the 4th quintile had significance after additionally adjusting for ed- ucation, income, physical activity, smoking status, and alcohol consumption (in model 2), total energy intake, the three nutri- ent, and sodium intake (in model 3) ([OR, 0.71; 95% CI, 0.55 to 0.92] and [OR, 0.73; 95% CI, 0.57 to 0.95], respectively).
The 4th quintile of soybean food intake had significantly
lower ORs of having AO than that the 1st quintile in models 1, 2, and 3. The 5th quintile of soybean food intake had 25% low- er OR of having AO than the 1st quintile. However, after ad- justing for various confounders in models 2 and 3, significance attenuated. ORs for AO significantly decreased by the quintile of soybean food intake in model 3 (P for trend <0.05).
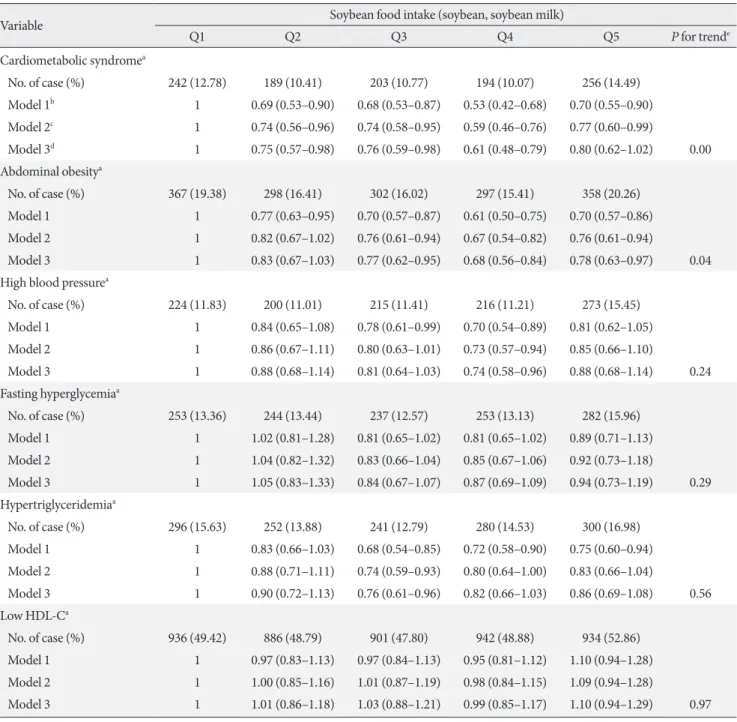
Sensitivity analysis (soybean food intake and cardiometabolic syndrome)
After excluding soybean or soybean milk items from FFQ data, there were no significant relevance of CMS or CMS compo- Table 2. Cardiometabolic factors according to soybean product intake
Variable Soybean product intake
Q1 Q2 Q3 Q4 Q5 P valuea P for trendb
Lipid metabolism
TC, mg/dL 182.82±34.38 182.52±33.68 182.65±33.60 184.62±33.31 189.01±36.08 0.77 0.38
HDL-C, mg/dL 50.80±10.81 50.98±10.69 51.53±10.89 51.64±11.20 50.36±11.23 0.23 0.25
LDL-C, mg/dL 107.85±14.23 107.98±13.97 107.48±12.96 107.66±14.17 109.01±14.01 0.32 0.32
TG, mg/dL 101.92±72.47 98.21±63.75 97.09±67.42 98.57±63.82 106.14±68.36 0.69 0.97
Blood pressure
SBP, mm Hg 109.52±14.60 108.48±13.72 108.69±13.82 108.89±13.53 111.39±15.39 0.26 0.10
DBP, mm Hg 71.47±9.65 71.27±9.40 71.50±9.59 71.68±9.12 72.84±9.77 0.96 0.85
Liver somatic value
AST, IU/L 19.16±8.93 19.02±8.16 19.07±7.05 19.54±12.20 20.44±7.78 0.72 0.18
ALT, IU/L 16.56±14.57 16.79±14.85 16.44±11.61 16.59±14.41 18.20±11.04 0.42 0.54
AST/ALT 1.32±0.42 1.31±0.41 1.31±0.41 1.32±0.88 1.25±0.39 0.03 0.07
NAFLD liver fat score –1.75 ±1.10 –1.75±1.14 –1.77±1.32 –1.78±1.29 –1.66±1.08 0.63 0.52 Serum glucose/insulin level
FPG, mg/dL 91.13±11.87 91.13±11.57 90.64±11.48 90.99±12.42 92.19±15.45 0.58 0.64
Fasting serum insulin, μIU/mL 9.73±3.48 9.80±4.19 9.78±5.80 9.72±4.32 9.51±4.00 0.53 0.36
HOMA-IR 2.20±0.92 2.23±1.13 2.21±1.59 2.20±1.18 2.19±1.13 0.61 0.44
HOMA-β 136.04±57.93 138.08±99.56 139.92±80.91 138.12±101.42 129.67±60.30 0.24 0.53
HbA1c, % 5.57±0.32 5.57±0.28 5.55±0.26 5.57±0.31 5.60±0.36 0.62 0.18
Values are presented as mean±standard deviation.
TC, total cholesterol; HDL-C, high density lipoprotein cholesterol; LDL-C, low density lipoprotein cholesterol; TG, triglyceride; SBP, systolic blood pressure; DBP, diastolic blood pressure; AST, aspartate aminostransferase; ALT, alanine aminotransferase; NAFLD, nonalcoholic fatty liv- er disease; FPG, fasting plasma glucose; HOMA-IR, homeostatic model assessment of insulin resistance; HOMA-β, homeostatic model assess- ment of beta cell function; HbA1c, glycosylated hemoglobin.
aSignificance determined by general linear model with Tukey multiple comparisons test (P<0.05) after adjustments for age (continuous), educa- tion (high school or less, college or more), income (quartile of equivalized household income), physical activity (low, moderate, high), smoking status (never smoker, past smoker, current smoker), alcohol consumption (g/day quartile), total energy (kcal/day), carbohydrate (g/day), total fat (g/day), protein (g/day), sodium (mg/1,000 kcal) intakes as continuous variables. Sharing the same alphabet indicates no significant differ- ence between two groups, bP values for trend using median value of soybean product intake quintile after adjustments for confounders as same as above.
Table 3. Multivariable adjusted odds ratio for the cardiometabolic syndrome and its individual components
Variable Soybean food intake
Q1 Q2 Q3 Q4 Q5 P for trende
Cardiometabolic syndromea
No. of case (%) 236 (12.7) 205 (11.0) 205 (10.4) 182 (10.1) 255 (14.0)
Model 1b 1 0.87 (0.67–1.12) 0.79 (0.61–1.01) 0.63 (0.49–0.82) 0.76 (0.60–0.97) Model 2c 1 0.92 (0.71–1.19) 0.86 (0.67–1.11) 0.71 (0.55–0.92) 0.84 (0.66–1.08)
Model 3d 1 0.93 (0.71–1.21) 0.89 (0.69–1.14) 0.73 (0.57–0.95) 0.87 (0.68–1.12) 0.32 Abdominal obesitya
No. of case (%) 361 (19.5) 316 (16.9) 314 (15.9) 272 (15.1) 358 (19.6)
Model 1 1 0.88 (0.71–1.08) 0.81 (0.65–1.00) 0.64 (0.52–0.79) 0.75 (0.61–0.92) Model 2 1 0.93 (0.75–1.15) 0.87 (0.70–1.09) 0.71 (0.57–0.88) 0.82 (0.67–1.02)
Model 3 1 0.94 (0.76–1.16) 0.89 (0.71–1.11) 0.72 (0.58–0.90) 0.84 (0.68–1.04) 0.02
High blood pressurea
No. of case (%) 228 (12.3) 216 (11.6) 216 (10.9) 205 (11.4) 263 (14.4)
Model 1 1 1.02 (0.79–1.31) 0.92 (0.72–1.18) 0.81 (0.63–1.04) 0.83 (0.65–1.07) Model 2 1 1.05 (0.82–1.35) 0.96 (0.75–1.23) 0.85 (0.66–1.09) 0.89 (0.69–1.14)
Model 3 1 1.07 (0.83–1.37) 0.98 (0.77–1.25) 0.86 (0.67–1.10) 0.91 (0.71–1.17) 0.36
Fasting hyperglycemiaa
No. of case (%) 248 (13.4) 254 (13.6) 251 (12.7) 234 (13.0) 281 (15.4)
Model 1 1 1.09 (0.87–1.37) 0.93 (0.73–1.18) 0.90 (0.71–1.14) 0.93 (0.74–1.19) Model 2 1 1.12 (0.89–1.40) 0.95 (0.74–1.20) 0.93 (0.73–1.18) 0.97 (0.76–1.23)
Model 3 1 1.11 (0.88–1.40) 0.96 (0.75–1.22) 0.94 (0.74–1.20) 0.98 (0.77–1.24) 0.60
Hypertriglyceridemiaa
No. of case (%) 290 (15.7) 258 (13.8) 256 (13.0) 257 (14.3) 307 (16.8)
Model 1 1 0.98 (0.77–1.20) 0.77 (0.61–0.97) 0.80 (0.64–1.00) 0.81 (0.65–1.01) Model 2 1 1.02 (0.82–1.27) 0.84 (0.67–1.05) 0.89 (0.71–1.11) 0.90 (0.72–1.12)
Model 3 1 1.03 (0.83–1.28) 0.86 (0.68–1.08) 0.91 (0.73–1.14) 0.93 (0.75–1.15) 0.68
Low HDL-Ca
No. of case (%) 914 (49.5) 932 (50.0) 935 (47.4) 865 (48.2) 951 (52.3)
Model 1 1 1.15 (0.99–1.34) 1.04 (0.88–1.22) 0.99 (0.84–1.17) 1.14 (0.98–1.33) Model 2 1 1.19 (1.02–1.39) 1.08 (0.91–1.27) 1.04 (0.88–1.22) 1.15 (0.98–1.34)
Model 3 1 1.18 (1.01–1.39) 1.08 (0.91–1.28) 1.04 (0.89–1.23) 1.14 (0.98–1.34) 0.59
All analyses accounted for the complex sampling design effect and the appropriate sampling weights of the national survey. Multivariate adjust- ed logistic regression was used to estimate the odds ratio (95% confidence interval).
HDL-C, high density lipoprotein cholesterol.
aCardiometabolic syndrome was defined using the National Cholesterol Education Program Adult Treatment Panel III criteria with a modified waist circumference cutoff for Korean adults if any three or more of the five components were present. Five components: (1) abdominal obesity (waist circumference ≥90 cm in male, ≥85 cm in female); (2) high blood pressure (≥130/85 mm Hg); (3) fasting hyperglycemia (≥100 mg/dL);
(4) hypertriglyceridemia (≥150 mg/dL); and (5) low HDL-C (<40 mg/dL in male, <50 mg/dL in female), bModel 1: adjusted for age (continu- ous), cModel 2: same as model 1 and additionally adjusted for education (high school or less, college or more), income (quartile of equivalized household income), physical activity (low, moderate, high), smoking status (never smoker, past smoker, current smoker), and alcohol consump- tion (times/week), dModel 3: same as model 2 and additionally adjusted for total energy (kcal/day), carbohydrate (g/day), total fat (g/day), pro- tein (g/day), sodium (mg/day) intakes as continuous variable, eP for trend using median value of soybean product intake quintile after adjust- ments for confounders as same as model 3.
Table 4. Multivariable adjusted odds ratio for the cardiometabolic syndrome and its individual components, sensitivity analysis
Variable Soybean food intake (soybean, soybean milk)
Q1 Q2 Q3 Q4 Q5 P for trende
Cardiometabolic syndromea
No. of case (%) 242 (12.78) 189 (10.41) 203 (10.77) 194 (10.07) 256 (14.49) Model 1b 1 0.69 (0.53–0.90) 0.68 (0.53–0.87) 0.53 (0.42–0.68) 0.70 (0.55–0.90) Model 2c 1 0.74 (0.56–0.96) 0.74 (0.58–0.95) 0.59 (0.46–0.76) 0.77 (0.60–0.99)
Model 3d 1 0.75 (0.57–0.98) 0.76 (0.59–0.98) 0.61 (0.48–0.79) 0.80 (0.62–1.02) 0.00 Abdominal obesitya
No. of case (%) 367 (19.38) 298 (16.41) 302 (16.02) 297 (15.41) 358 (20.26) Model 1 1 0.77 (0.63–0.95) 0.70 (0.57–0.87) 0.61 (0.50–0.75) 0.70 (0.57–0.86) Model 2 1 0.82 (0.67–1.02) 0.76 (0.61–0.94) 0.67 (0.54–0.82) 0.76 (0.61–0.94)
Model 3 1 0.83 (0.67–1.03) 0.77 (0.62–0.95) 0.68 (0.56–0.84) 0.78 (0.63–0.97) 0.04
High blood pressurea
No. of case (%) 224 (11.83) 200 (11.01) 215 (11.41) 216 (11.21) 273 (15.45) Model 1 1 0.84 (0.65–1.08) 0.78 (0.61–0.99) 0.70 (0.54–0.89) 0.81 (0.62–1.05) Model 2 1 0.86 (0.67–1.11) 0.80 (0.63–1.01) 0.73 (0.57–0.94) 0.85 (0.66–1.10)
Model 3 1 0.88 (0.68–1.14) 0.81 (0.64–1.03) 0.74 (0.58–0.96) 0.88 (0.68–1.14) 0.24
Fasting hyperglycemiaa
No. of case (%) 253 (13.36) 244 (13.44) 237 (12.57) 253 (13.13) 282 (15.96) Model 1 1 1.02 (0.81–1.28) 0.81 (0.65–1.02) 0.81 (0.65–1.02) 0.89 (0.71–1.13) Model 2 1 1.04 (0.82–1.32) 0.83 (0.66–1.04) 0.85 (0.67–1.06) 0.92 (0.73–1.18)
Model 3 1 1.05 (0.83–1.33) 0.84 (0.67–1.07) 0.87 (0.69–1.09) 0.94 (0.73–1.19) 0.29
Hypertriglyceridemiaa
No. of case (%) 296 (15.63) 252 (13.88) 241 (12.79) 280 (14.53) 300 (16.98) Model 1 1 0.83 (0.66–1.03) 0.68 (0.54–0.85) 0.72 (0.58–0.90) 0.75 (0.60–0.94) Model 2 1 0.88 (0.71–1.11) 0.74 (0.59–0.93) 0.80 (0.64–1.00) 0.83 (0.66–1.04)
Model 3 1 0.90 (0.72–1.13) 0.76 (0.61–0.96) 0.82 (0.66–1.03) 0.86 (0.69–1.08) 0.56
Low HDL-Ca
No. of case (%) 936 (49.42) 886 (48.79) 901 (47.80) 942 (48.88) 934 (52.86) Model 1 1 0.97 (0.83–1.13) 0.97 (0.84–1.13) 0.95 (0.81–1.12) 1.10 (0.94–1.28) Model 2 1 1.00 (0.85–1.16) 1.01 (0.87–1.19) 0.98 (0.84–1.15) 1.09 (0.94–1.28)
Model 3 1 1.01 (0.86–1.18) 1.03 (0.88–1.21) 0.99 (0.85–1.17) 1.10 (0.94–1.29) 0.97
All analyses accounted for the complex sampling design effect and the appropriate sampling weights of the national survey. Multivariate adjust- ed logistic regression was used to estimate the odds ratio (95% confidence interval).
HDL-C, high density lipoprotein cholesterol.
aCardiometabolic syndrome was defined using the National Cholesterol Education Program Adult Treatment Panel III criteria with a modified waist circumference cutoff for Korean adults if any three or more of the five components were present. Five components: (1) abdominal obesity (waist circumference ≥90 cm in male, ≥85 cm in female); (2) high blood pressure (≥130/85 mm Hg); (3) fasting hyperglycemia (≥100 mg/dL);
(4) hypertriglyceridemia (≥150 mg/dL); and (5) low HDL-C (<40 mg/dL in male, <50 mg/dL in female), bModel 1: adjusted for age (continu- ous), cModel 2: same as model 1 and additionally adjusted for education (high school or less, college or more), income (quartile of equivalized household income), physical activity (low, moderate, high), smoking status (never smoker, past smoker, current smoker), and alcohol consump- tion (times/week), dModel 3: same as model 2 and additionally adjusted for total energy (kcal/day), carbohydrate (g/day), total fat (g/day), pro- tein (g/day), sodium intakes (mg/day) as continuous variables, eP for trend using median value of soybean product intake quintile after adjust- ments for confounders as same as model 3.
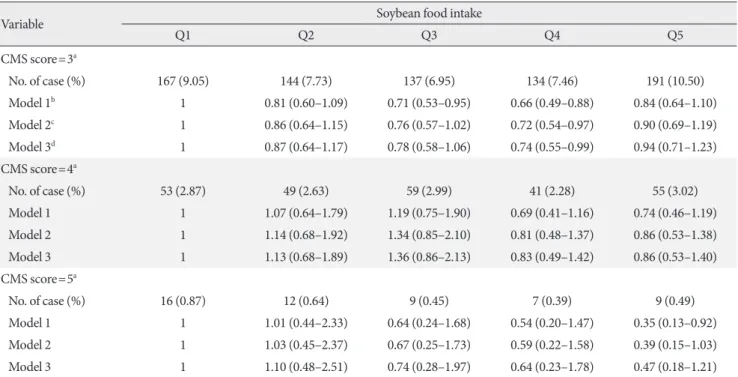
Table 5. Multivariable adjusted odds ratio for the cardiometabolic syndrome score
Variable Soybean food intake
Q1 Q2 Q3 Q4 Q5
CMS score=3a
No. of case (%) 167 (9.05) 144 (7.73) 137 (6.95) 134 (7.46) 191 (10.50)
Model 1b 1 0.81 (0.60–1.09) 0.71 (0.53–0.95) 0.66 (0.49–0.88) 0.84 (0.64–1.10)
Model 2c 1 0.86 (0.64–1.15) 0.76 (0.57–1.02) 0.72 (0.54–0.97) 0.90 (0.69–1.19)
Model 3d 1 0.87 (0.64–1.17) 0.78 (0.58–1.06) 0.74 (0.55–0.99) 0.94 (0.71–1.23)
CMS score=4a
No. of case (%) 53 (2.87) 49 (2.63) 59 (2.99) 41 (2.28) 55 (3.02)
Model 1 1 1.07 (0.64–1.79) 1.19 (0.75–1.90) 0.69 (0.41–1.16) 0.74 (0.46–1.19)
Model 2 1 1.14 (0.68–1.92) 1.34 (0.85–2.10) 0.81 (0.48–1.37) 0.86 (0.53–1.38)
Model 3 1 1.13 (0.68–1.89) 1.36 (0.86–2.13) 0.83 (0.49–1.42) 0.86 (0.53–1.40)
CMS score=5a
No. of case (%) 16 (0.87) 12 (0.64) 9 (0.45) 7 (0.39) 9 (0.49)
Model 1 1 1.01 (0.44–2.33) 0.64 (0.24–1.68) 0.54 (0.20–1.47) 0.35 (0.13–0.92)
Model 2 1 1.03 (0.45–2.37) 0.67 (0.25–1.73) 0.59 (0.22–1.58) 0.39 (0.15–1.03)
Model 3 1 1.10 (0.48–2.51) 0.74 (0.28–1.97) 0.64 (0.23–1.78) 0.47 (0.18–1.21)
All analyses accounted for the complex sampling design effect and the appropriate sampling weights of the national survey. Multivariate adjust- ed logistic regression was used to estimate the odds ratio (95% confidence interval).
CMS, cardiometabolic syndrome.
aCMS score: CMS was defined using the National Cholesterol Education Program Adult Treatment Panel III criteria with a modified waist cir- cumference cutoff for Korean adults if any three or more of the five components were present. Five components: (1) abdominal obesity (waist circumference ≥90 cm in male, ≥85 cm in female); (2) high blood pressure (≥130/85 mm Hg); (3) fasting hyperglycemia (≥100 mg/dL); (4) hypertriglyceridemia (≥150 mg/dL); and (5) low HDL-C (<40 mg/dL in male, <50 mg/dL in female). The number corresponding to the com- ponent was scored, bModel 1: adjusted for age (continuous), cModel 2: same as model 1 and additionally adjusted for education (high school or less, college or more), income (quartile of equivalized household income), physical activity (low, moderate, high), smoking status (never smoker, past smoker, current smoker), and alcohol consumption (times/week), dModel 3: same as model 2 and additionally adjusted for total energy (kcal/day), carbohydrate (g/day), total fat (g/day), protein (g/day), sodium intakes (mg/day) as continuous variables.
nents across soybean consumption. Meanwhile, after exclud- ing tofu items from FFQ data, lower ORs and significant asso- ciations were found for several CMS components across soy- bean food consumption groups than those when considering all soybean food items.
For CMS prevalence (Table 4), after adjusting for age, all quintiles had significantly lower ORs than the 1st quintile in model 1. After adjusting for age, education, income, smoking status, and alcohol consumption in model 2, the significance was maintained across quintiles. After additionally adjusting for total energy intake, carbohydrate intake, fat intake, protein intake, and sodium intake in model 3, the 2nd (2 or more than 2 to 4 or less than 4 times/week), 3rd (more than 4 to 8.5 or more than 8.5 times/week), and 4th quintile of soybean intake also had significantly lower ORs than the lowest quintile ([OR, 0.75; 95% CI, 0.57 to 0.98], [OR, 0.76; 95% CI, 0.59 to 0.98],
and [OR, 0.61; 95% CI, 0.48 to 0.79], respectively). However, the 5th quintile of soybean intake had 20% lower OR than the reference group with 95% CI of 0.62 to 1.02 which was margin- ally significant. ORs for CMS prevalence significantly de- creased by the quintile of soybean food intake in model 3 (P for trend <0.00).
For AO prevalence after adjusting for age (Table 4), all quin- tiles of soybean food intake had significantly lower ORs than the reference group. After additionally adjusting for education, income, smoking status, and alcohol consumption in model 2, the significance was maintained except for OR of the 2nd quin- tile of soybean food intake. After additionally adjusting for to- tal energy and four nutrients’ intake in model 3, the 3rd, 4th, and 5th quintiles of soybean intake showed significantly lower ORs than the 1st quintile ([OR, 0.77; 95% CI, 0.62 to 0.95], [OR, 0.68; 95% CI, 0.56 to 0.84], and [OR, 0.78; 95% CI, 0.63 to
0.97], respectively). In model 3, ORs for AO prevalence signifi- cantly decreased across soybean food intake quintiles (P for trend <0.05).
ORs of high BP were significantly lower in the 3rd and 4th quintiles of soybean food intake than the reference quintile (Table 4). However, after adjusting for confounders in models 2 and 3, only ORs in the 4th quintile of soybean food intake were significantly lower than the 1st quintile ([OR, 0.73; 95%
CI, 0.57 to 0.94] and [OR, 0.74; 95% CI, 0.58 to 0.96], respec- tively).
Participants in the 3rd quintile of soybean intake had the lowest OR for hypertriglyceridemia which was significant even after adjusting for confounders in models 2 and 3 ([OR, 0.74;
95% CI, 0.59 to 0.93] and [OR, 0.76; 95% CI, 0.61 to 0.96], re- spectively). ORs of the 4th group showed significantly lower OR that the reference after adjusting for age in model 1, al- though the significance attenuated after adjusting for various covariates in models 2 and 3.
Soybean food intake and cardiometabolic syndrome score People in the 4th quintile (8.5 to 17 times/week) of soybean food intake had 26% lower ORs of having CMS score of 3 than those in the 1st quintile (less than 2 times/week) of soybean food intake after adjusting for confounders in model 3 (OR, 0.74; 95% CI, 0.55 to 0.99) (Table 5). There was no significant difference in ORs for having CMS scores of 4 and 5 across soy- bean food intake quintiles compared to the reference.
DISCUSSION
We evaluated the association between soybean food consump- tion and cardio metabolic diseases in Korean women based on nationally representative survey data. For overall soybean food, moderate soybean food consumption was associated with lower CMS prevalence and central obesity. Especially for central obesity, ORs had significant decreasing linearity across soybean food intake groups. The observed inverse association for CMS prevalence was attenuated in the highest quintile of soybean consumption (more than 17 times/week of soybean consumption). This reverse J shape relationship was also found for other CMS components as OR of the 5th group was higher than that of the 4th group. Even for AO prevalence which had significant inverse linear trend across soybean intake quintiles, OR of the 5th quintile did not show significance.
After excluding tofu items, CMS prevalence and central obe-
sity had prominent decreasing association across soybean in- take groups, while only moderate consumption was related to lower OR in high BP and hypertriglyceridemia. P values for trend in CMS and AO prevalence using median value of soy- bean product intake quintile after adjusting for confounders in model 3 showed significant linearity across soybean food in- take groups. Others had reverse J shape relation with soybean intake. It tended to decrease until the 4th quintile, but it in- creased from the fifth to the reverse.
When observing general characteristics, women in the 4th quintile of soybean product intake showed some desirable health condition—lowest BMI, highest household income, vigorous physical activity, and high energy adjusted protein in- take. Meanwhile, women in the 5th quintile showed some un- desirable heath condition—eldest, highest BMI, highest total energy intake, and high energy adjusted carbohydrate intake.
We did some additional analysis to see the effect of each vari- able which was higher in the 5th group.
To determine the age modified on CMS, first we examined the interaction of soybean intake quintiles with age. However, there was no significant interaction over all quintiles for CMS components (results not shown). Secondly, as the elder women tended to be postmenopausal, we stratified participants by post- or pre-menopause. All the significance disappeared in premenopausal group. Postmenopausal women showed sig- nificantly lower ORs in the 4th and 5th quintiles of soybean in- take for AO. The influence of age and menopause to the rela- tion between soybean intake and CMS components is pre- sumed to be small.
To determine the interaction of BMI with soybean intake, we stratified participants by BMI as obesity, pre-obesity, and under pre-obesity [32] and then analyzed CMS components.
There were no significant ORs in groups that were not obesity after adjusting for various covariates in model 3. In the obesity group, the 4th and the 5th quintiles had significantly lower ORs than the reference group for AO prevalence in model 3.
This suggested that the lowering significance in the 5th quintile was not due to higher BMI.
Total energy intake and energy adjusted carbohydrate intake might be the reason for the reverse J shape association of CMS components with soybean intake quintiles. Park et al. [33] has reported that MetS group has higher carbohydrate intake and lower protein and fat (monounsaturated, polyunsaturated, and saturated fatty acids) intake than the non-MetS group. Carbo- hydrate intake was positively associated with the risk of MetS
in a previous study [33] while protein and fat intake exhibited a prominently reverse association with the prevalence of MetS [33]. According to the study of dietary characteristics of nutri- ent intake with health status among Koreans, the proportion of energy intake from carbohydrates was significantly higher in the group with CMS than that in the group without CMS [34].
Results of the present study suggested that the group that con- sumed soybean the most frequently have eaten the highest en- ergy adjusted carbohydrate to show inverse association with the risk of CMS. Also, effects of carbohydrate intake were dif- ferent by BMI in previous research. In a cohort study, results showed a positive relation between high intake of added sugars from liquid and components of the CMS among overweight participants, but not among normal-weight participants [35].
As participants of the top quintile group of soybean food in- take had the highest BMI, they might be more vulnerable to metabolic disorder than any other groups when they con- sumed carbohydrates.
Soy protein have been found to have implications for insu- lin/glucagon ratio. Isoflavones appear to influence lipid metab- olism by altering gene expression for lipid-related genes [36].
By combining mRNA and macroarray analysis, genes involved in lipid metabolism, regulation of transcription and transla- tion, protease inhibition, apoptosis, and cell proliferation regu- lation have been found to be expressed at higher levels in rat livers fed with low or high isoflavone soy protein diets com- pared to those in livers fed casein diet [37]. For human, ac- cording to a meta-analysis of 14 studies conducted on 11 co- horts, the group with the highest legume consumption was as- sociated with a decreased risk of 10% in both cardiovascular disease and coronary heart disease compared to the group with the lowest legume consumption [38]. Recent studies in Korean adult women have shown that they mainly have intake of iso- flavones from soybean foods known to have beneficial effects on several metabolic disorders [22,39,40]. Consistent with our study, previous researches have indicated that frequent con- sumption of soybean diet could regulate overall levels of lipid and fat accumulation in the liver which causes insulin resis- tance and dyslipidemia [29,41]. Some experimental studies have reported that soybean have proteins that are more effec- tive than animal proteins in weight reduction and arterial stiff- ness. In addition, soybean contains isoflavonoids and saponins that can improve lipid profiles and risk of CMS [13,42,43]. Po- tential mechanisms by which soy protein and isoflavones might prevent CMS include a beneficial effect on plasma lipid
concentrations, antioxidant effects, antiproliferative and anti- migratory effects on smooth muscle cells, effects on thrombus formation, and maintenance of normal vascular reactivity [36].
AST to ALT ratio showed different phase in the most fre- quent soybean consumption group. Serum AST-to-ALT ratio is a substitute measure for NAFLD. It has been shown to be in- versely associated with metabolic disorder and insulin resis- tance in previous clinical and epidemiological studies [44,45].
A cohort study showed that an increased AST-to-ALT ratio was correlated with a consistent reduction in the onset of CMS and its components [46]. This implies that, the more we eat soy bean food, the more beneficial it will be for our liver metabo- lism. At last the onset of CMS would be prolonged [29]. Since we could not observe an inverse relation of soybean food in- take with insulin resistance, HbA1c level, or other probes relat- ed to glucose metabolism, it suggests that our participants might be a comparatively healthy population who are not diag- nosed with T2DM, hyperlipidemia, or hypertension before analysis. Thus, we could not see any statistical significance. The beneficial effect of soybean could be shown more prominent among unhealthy people. An epidemiologic study has shown that higher intake of soy food is related to lower incidence of T2DM among overweight women [10]. Some cross-sectional studies have found that the association of soybean intake with AO and cholesterol level appears to be stronger among post- menopausal women than that among premenopausal women [10,20].
ORs of CMS individual components according to overall soybean food intake frequency had different results compared to soybean food intake without tofu items which showed more significant decrease in AO, BP, and TG. Similarly, some obser- vational studies have found that eating soybean food has sig- nificant negative relation with CVD, although eating tofu and miso has borderline significant association [38]. Epidemiolog- ic and experimental studies have also reported that compo- nents in soybean are different depending on processing meth- od which might play a role in the positive association [47,48].
We acknowledge that the present study has several limita- tions. First, we included only women in this study. It is possible that men differ from women in effects of soybean food con- sumption on CMS. The reason why we did not include men was because soy consumption in Korea was especially high among women. This is because soy isoflavones are associated with female hormones. Thus, soy consumption seems to be more related to women’s health. Second, our study had a cross-
sectional design. Thus, we could not determine a causal rela- tionship of soybean consumption with risk of CMS among Korean women. Lastly, we could not rule out the presence of unknown confounders. Some unmeasured and residual con- founding factors could exist. However, it is doubtful that those confounding would completely erase the association found in the present study. In addition, the assessment of soybean in- take was mainly based on questions related to the intake of food ingredients—soybean milk, tofu, and soybean. We were unable to distinguish the effect of different processing types of soybean food (fermented, fried, unsweetened food, etc.). How- ever, other studies on Korean adult women have shown that ingestion of soy isoflavones is mainly induced by intake of soy- bean paste, soybean milk, and tofu, although there is a differ- ence in the level of soybean food intake [20,39]. So identifying the frequency of eating soybean foods in Korean women may have a similar effect as comparing the nutrient intake of soy- beans. Although this study had limitations, we adjusted for several potential confounders in our analyses.
The present study also has strengths. KNHANES had a large nationally representative sampling design that provided de- tailed information, thus allowing for better control of potential confounders among the Korean population. These results could provide insight into the influence of soy consumption on general population statistically. In addition, we conducted a sensitivity analysis to determine the association varied from each soybean food item. When we analyzed the association with total soybean food item, the result showed that only AO had significant association. In Asia, there are plenty of process- ing method using soy bean. Thus, it was unclear whether each subgroup of soybean food would show the same result with CMS prevalence.
In conclusion, we found that moderate consumption of soy- bean food showed negative association with having CMS and AO among healthy women. Our results warrant further stud- ies such as randomized controlled trials about the effect of var- ious kinds of processed soybean food intake frequency on CMS prevalence. If our results are confirmed by further re- search, it could encourage the consumption of soybean food as a healthy alternative to Western-style meals.
CONFLICTS OF INTEREST
No potential conflict of interest relevant to this article was re- ported.
AUTHOR CONTRIBUTIONS
Conception or design: W.K.S., Y.K.
Acquisition, analysis, or interpretation of data: S.H.J., W.K.S.
Drafting the work or revising: S.H.J., W.K.S., Y.K.
Final approval of the manuscript: Y.K.
ORCID
Sook-Hyun Jun https://orcid.org/0000-0002-3186-4640 Woo-Kyoung Shin https://orcid.org/0000-0003-2725-4652 Yookyung Kim https://orcid.org/0000-0002-8438-0121
ACKNOWLEDGMENTS
This research was supported by the College of Education, Ko- rea University Grant in 2019 and conducted using raw data from the KNHANES (2007 to 2011) performed by the Korean Centers for Disease Control and Prevention.
REFERENCES
1. World Health Organization: Noncommunicable diseases country profiles 2011. Available from: http://www.who.int/
nmh/publications/ncd_profiles2011/en/ (cited 2019 Oct 22).
2. Sapbamrer R, Visavarungroj N, Suttajit M. Effects of dietary traditional fermented soybean on reproductive hormones, lip- ids, and glucose among postmenopausal women in northern Thailand. Asia Pac J Clin Nutr 2013;22:222-8.
3. Tran BT, Jeong BY, Oh JK. The prevalence trend of metabolic syndrome and its components and risk factors in Korean adults: results from the Korean National Health and Nutrition Examination Survey 2008-2013. BMC Public Health 2017;17:
71.
4. Aguilar M, Bhuket T, Torres S, Liu B, Wong RJ. Prevalence of the metabolic syndrome in the United States, 2003-2012. JAMA 2015;313:1973-4.
5. Tovar J, Johansson M, Bjorck I. A multifunctional diet im- proves cardiometabolic-related biomarkers independently of weight changes: an 8-week randomized controlled interven- tion in healthy overweight and obese subjects. Eur J Nutr 2016;55:2295-306.
6. Ministry of Health and Welfare (South Korea). ‘95 National Nutrition Survey Report, No 40000‐65312‐56‐04. Seoul: Min- istry of Health and Welfare; 1997. p.115-70.