Semi-Quantitative Analysis for Determining the Optimal Threshold Value on CT
to Measure the Solid Portion of Pulmonary Subsolid
Nodules
폐의 아고형결절에서 침습적 병소를 검출하기 위한 반-정량 분석을 통한 최적의 CT 임계 값 결정
Sunyong Lee, MD1 , Da Hyun Lee, MD1 , Jae Ho Lee, MD1 , Sungsoo Lee, MD2 , Kyunghwa Han, PhD3 ,
Chul Hwan Park, MD1 , Tae Hoon Kim, MD1*
1Department of Radiology and the Research Institute of Radiological Science, Gangnam Severance Hospital, Yonsei University College of Medicine, Seoul, Korea
2Department of Thoracic and Cardiovascular Surgery, Gangnam Severance Hospital, Yonsei University College of Medicine, Seoul, Korea
3Department of Radiology, Research Institute of Radiological Science, Severance Hospital, Yonsei University College of Medicine, Seoul, Korea
Purpose This study aimed to investigate the optimal threshold value in Hounsfield units (HU) on CT to detect the solid components of pulmonary subsolid nodules using pathologic invasive foci as reference.
Materials and Methods Thin-section non-enhanced chest CT scans of 25 patients with patho- logically confirmed minimally invasive adenocarcinoma were retrospectively reviewed. On CT images, the solid portion was defined as the area with higher attenuation than various HU thresholds ranging from -600 to -100 HU in 50-HU intervals. The solid portion was measured as the largest diameter on axial images and as the maximum diameter on multiplanar reconstruc- tion images. A linear mixed model was used to evaluate bias in each threshold by using the pathological size of invasive foci as reference.
Results At a threshold of -400 HU, the biases were lowest between the largest/maximum diam- eter of the solid portion of subsolid nodule and the size of invasive foci of the pathological specimen, with 0.388 and -0.0176, respectively. They showed insignificant difference (p = 0.2682, p = 0.963, respectively) at a threshold of -400 HU.
Conclusion For quantitative analysis, -400 HU may be the optimal threshold to define the solid
Received April 6, 2020 Revised June 30, 2020 Accepted August 9, 2020
*Corresponding author Tae Hoon Kim, MD
Department of Radiology and the Research Institute of Radiological Science, Gangnam Severance Hospital, Yonsei University
College of Medicine, 211 Eonju-ro, Gangnam-gu, Seoul 06273, Korea.
Tel 82-2-2019-3510 Fax 82-2-3462-5472 E-mail [email protected] This is an Open Access article distributed under the terms of the Creative Commons Attribu- tion Non-Commercial License (https://creativecommons.org/
licenses/by-nc/4.0) which permits unrestricted non-commercial use, distribution, and reproduc- tion in any medium, provided the original work is properly cited.
ORCID iDs Sunyong Lee https://
orcid.org/0000-0001-7751-5465 Da Hyun Lee
https://
orcid.org/0000-0001-7593-0403 Jae Ho Lee
https://
orcid.org/0000-0002-8592-1209 Sungsoo Lee
https://
orcid.org/0000-0001-8998-9510 Kyunghwa Han
https://
orcid.org/0000-0002-5687-7237 Chul Hwan Park
https://
orcid.org/0000-0002-0004-9475 Tae Hoon Kim
https://
orcid.org/0000-0002-4032-1285
portion of subsolid nodules as a surrogate marker of invasive foci.
Index terms Lung Neoplasms; Solitary Pulmonary Nodule; Adenocarcinoma of Lung;
Multidetector Computed Tomography
INTRODUCTION
Subsolid nodules (SSNs), also known as ground-glass nodules, include nodules with hazy increased attenuation that do not obscure underlying bronchial structures or pulmonary ves- sels (1). The presence of a solid component in SSNs suggests its invasiveness and malignancy.
Therefore, the presence and size of the solid portion are important for risk stratification and treatment planning (2, 3).
In the 2017 Fleischner guidelines, when the size of persistent SSNs with a solid component is more than 6 mm, malignancy is highly suspected compared to when the size is larger than 6 mm without a solid portion (2). According to the Lung CT Screening Reporting and Data System, SSNs with a solid component > 6 mm or a growing solid component are classified into category 4, whereas pure SSNs are categorized into category 2 or 3 (4). In lung cancer staging by the American Joint Committee on Cancer (8th edition), the largest diameter of a solid component of ground-glass nodules is measured on the multiplanar reconstruction (MPR) image, and diameters of up to 1, 2, and 3 cm are cT1a, cT1b, and cT1c, respectively (5).
Defining and measuring the solid portion of SSNs are important. However, defining SSNs is a challenging task (6, 7). Conventionally, it is based on the visual finding of individual as- sessment. Furthermore, the assessment of SSNs depends on the qualitative description from the individual radiologists with different CT scan protocols. Therefore, intra-observer and in- ter-observer variability among experienced chest radiologists cannot be avoided (8-10).
Quantitative measurement of SSNs and its solid component may improve the accuracy and reduce inter-observer variability for differential diagnosis of SSNs. Few studies have evaluat- ed the threshold attenuation for the solid portion indicating invasion foci on CT (11-13).
Despite these approaches, a quantitative threshold to determine the solid component of ground-glass nodules has not been established. Therefore, our study aimed to establish the optimal CT threshold value in Hounsfield units (HU) for detecting the solid components of SSNs.
MATERIALS AND METHODS
The study was approved by the Institutional Review Board of Gangnam Severance Hospi- tal. Clinical data were reviewed from medical records (IRB No. 3-2016-0306). Given the retro- spective nature of the study and the use of anonymized data, requirements for informed con- sent were waived.
PATIENTS
Twenty-five patients who underwent surgical resection of persistent SSNs and had patho-
logically confirmed minimally invasive adenocarcinoma (MIA) in Gangnam Severance Hos- pital were consecutively and retrospectively included. MIA was defined as lepidic-predomi- nant adenocarcinoma measuring up to 3 cm with an invasive component measuring up to 0.5 cm and lacking lymphatic, vascular, alveolar space, or pleural invasion (5).
CT PROTOCOL
Standard CT images were acquired using two CT scanners: a 16-slice multidetector CT (MDCT) scanner (Somatom Sensation 16; Siemens Medical Solutions, Erlangen, Germany) and a 64-slice MDCT scanner (Somatom Sensation 64; Siemens Medical Solutions). Non-en- hanced CT scan was performed at a tube potential of 120 kVp with automatic exposure con- trol (100–200 mA). Axial images were reconstructed at a section width of 1 mm with 1-mm in- terval by filtered back projection technique and sharp convolution kernel.
CT IMAGE ANALYSIS
The solid components of SSN more than the cut off value were assumed to be direct surro- gate markers to the invasive foci of pathologic specimen. The solid component of SSNs was defined as the area with high attenuation than a certain threshold in HU.
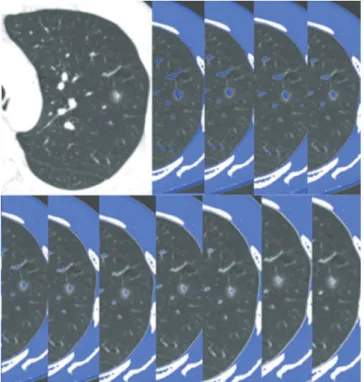
All pre-operative CT images of enrolled patients were analyzed with a commercial pro- gram (Aquarius iNtuition Ver. 4.4.12; TeraRecon, Inc., Foster City, CA, USA). The largest di- ameter of the solid portion is estimated on the axial image, and the maximum diameter of the solid portion is estimated on the MPR image in this program by setting a specific value and masking it in the lung window setting (W: 1400; L: -500) (Fig. 1). The diameter of lesions more than the threshold attenuation on each image was measured independently by two ra- diologists (C.P. and T.K), with 10 years and 25 years of experience in chest CT, respectively.
Fig. 1. Measurement of the largest diameter of the solid portion on axial images.
Lesions with higher than threshold attenuation are regarded as solid portions and marked with blue. The largest diameter is then measured by an individual. Threshold attenuation is arranged from the top left (-600 HU) to the bottom right (-100 HU). The largest diameter of the sol- id portion decreases as threshold attenuation increases.
HU = Hounsfield units
Various thresholds ranging from -600 to -100 HU were applied in 50-HU intervals.
CATEGORICAL ASSESSMENT
Twenty-five pathologically proven MIA SSNs were categorized into radiologic adenocarci- noma in situ (AIS), MIA, and invasive adenocarcinoma (IA) based on criteria of the measured solid portion on CT at each HU threshold from -600 HU to -100 HU: 0 mm, 0 mm to 5 mm, and larger than 5 mm. Classification was performed in both axial and MPR images, respectively.
STATISTICAL ANALYSIS
All continuous variables were expressed as mean ± standard deviation. Categorical vari- ables were summarized as frequencies or percentages. Data normality was evaluated using Shapiro-Wilk test. Bias between CT measurement of the solid portion and invasive foci on pathologic specimen was defined as the mean difference between the largest diameter of the solid component on the CT image and pathological invasive focus. It was evaluated with lin- ear mixed model using Bonferroni’s method for considering repeated measurements from various thresholds. Inter-observer reproducibility in measuring the solid portions on axial and MPR images was evaluated with the intraclass correlation coefficient. A p value < 0.05 was considered statistically significant. For analysis, R (version 3.3.1.; R Foundation for Sta- tistical Computing, Vienna, Austria) was used.
RESULTS
PATIENT AND LESION CHARACTERISTICS
The mean age of the 25 patients was 55.9 ± 12.7 years. Seven male patients (28%) were in- cluded in this study. The mean size of SSN was 9.2 ± 1.33 mm, and the mean attenuation was -539.1 ± 96 HU. The mean size of invasive foci, confirmed by pathology, was 3.56 ± 1.33 mm.
SEMI-QUANTITATIVE CT ANALYSIS ON AXIAL AND MULTIPLANAR RECONSTRUCTED IMAGES
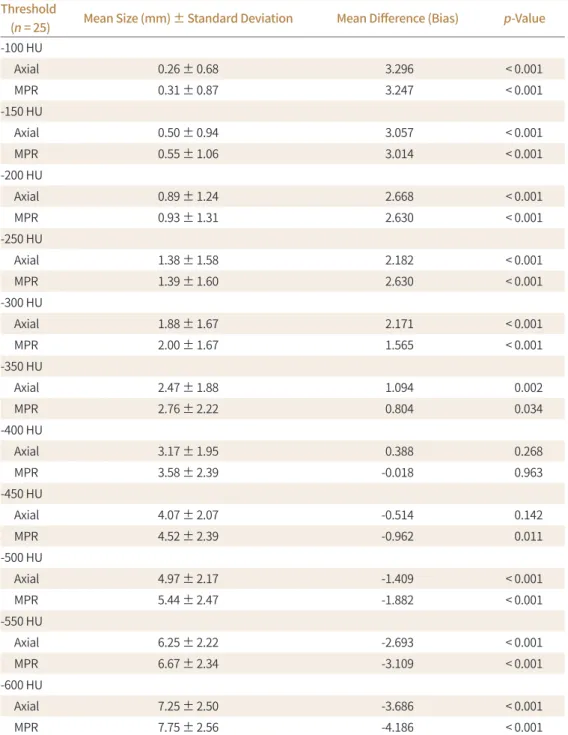
The largest size of the solid portion on the axial image at each HU threshold from -600 HU to -100 HU in 50 HU intervals is shown in Table 1. At a threshold of -400 HU on the axial im- age, the bias was lowest between the measured solid components of SSNs and pathologically confirmed invasive foci (0.388), showing insignificant difference (p = 0.2682) (Fig. 2).
The maximum size of the solid portion on the MPR image at each HU threshold from -600 HU to -100 HU in 50 HU intervals is shown in Table 1. Compared with the analysis on the axi- al image, the solid lesion component was larger on the MPR image. The measurements of solid components were not significantly different from the invasive component size on pa- thology at -400 HU threshold (p = 0.963). Similarly, at a threshold of -400 HU on the multipla- nar reconstructed image, the bias was lowest (-0.0176) between the measured solid compo- nents of SSNs and pathologically confirmed invasive foci (Fig. 3). Inter-observer agreement in measuring the solid portion on axial and MPR images was excellent, with 0.985 and 0.961, re- spectively.
CATEGORICAL ASSESSMENT
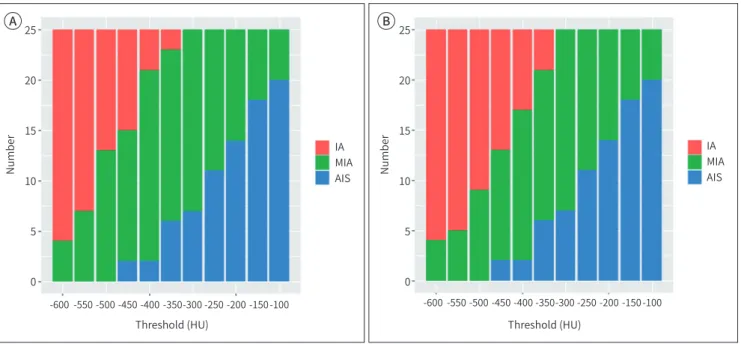
Radiologic classification of the 25 SSNs is summarized in Table 2 and Fig. 4. On both axial and MPR images, 25 pathologically proven MIA SSNs were categorized into 20 AIS and 5 MIA at -100 HU threshold and 4 MIA and 21 IA at -600 HU threshold. At a threshold of -400 HU on the axial image, 19 (76%) SSNs were classified into MIA, which showed the highest accuracy.
Table 1. Maximum Sizes of the Solid Portion of Subsolid Nodules on Axial and MPR Images Threshold
(n = 25) Mean Size (mm) ± Standard Deviation Mean Difference (Bias) p-Value -100 HU
Axial 0.26 ± 0.68 3.296 < 0.001
MPR 0.31 ± 0.87 3.247 < 0.001
-150 HU
Axial 0.50 ± 0.94 3.057 < 0.001
MPR 0.55 ± 1.06 3.014 < 0.001
-200 HU
Axial 0.89 ± 1.24 2.668 < 0.001
MPR 0.93 ± 1.31 2.630 < 0.001
-250 HU
Axial 1.38 ± 1.58 2.182 < 0.001
MPR 1.39 ± 1.60 2.630 < 0.001
-300 HU
Axial 1.88 ± 1.67 2.171 < 0.001
MPR 2.00 ± 1.67 1.565 < 0.001
-350 HU
Axial 2.47 ± 1.88 1.094 0.002
MPR 2.76 ± 2.22 0.804 0.034
-400 HU
Axial 3.17 ± 1.95 0.388 0.268
MPR 3.58 ± 2.39 -0.018 0.963
-450 HU
Axial 4.07 ± 2.07 -0.514 0.142
MPR 4.52 ± 2.39 -0.962 0.011
-500 HU
Axial 4.97 ± 2.17 -1.409 < 0.001
MPR 5.44 ± 2.47 -1.882 < 0.001
-550 HU
Axial 6.25 ± 2.22 -2.693 < 0.001
MPR 6.67 ± 2.34 -3.109 < 0.001
-600 HU
Axial 7.25 ± 2.50 -3.686 < 0.001
MPR 7.75 ± 2.56 -4.186 < 0.001
The mean size of pathologically confirmed invasive foci is 3.56 ± 1.33 mm.
HU = Hounsfield units, MPR = multiplanar reconstruction
DISCUSSION
This study demonstrated that a threshold value which defines the solid component of MIA on the CT image of -400 HU showed the best performance. Both the largest diameter and the maximum diameter of the solid portion exhibited the lowest difference with the diameter of the pathologically confirmed solid portion on -400 HU, without significant difference. Bias was lower in the maximum diameter on the MPR image than in the largest diameter on the axial image. This finding may also be because the maximum diameter is measured in 3D di- mension in pathology (14). However, -400 HU threshold on the axial image showed the high- est accuracy for predicting MIA (76%). A threshold of -400 HU to -300 HU on both axial and MPR images showed relatively high accuracy for predicting MIA. As the threshold increased from -600 HU to -100 HU, the solid portion on CT reduced with increasing number of SSNs classified as AIS, indicating underdiagnosis. By contrast, as the threshold decreased from -100 HU to -600 HU, the solid portion on CT enlarged with increasing number of SSNs classified as IA, indicating overdiagnosis. Clinicians can use the lower HU threshold if they do not want to underdiagnosis the MIA as an AIS. Conversely, if clinicians do not want to overdiag- nosis the MIA as an IA, they can use the relatively higher HU threshold.
In CT scan, the HU is proportional to the degree of X-ray attenuation (15), and attenuation of each pixel is related to tissue density (16). Normal alveolar structure and air space repre- sent very low density, which is near -950–-850 HU. However, as a tumor grows, cellularity in-
10
8
6
4
2
0
Mean size of solid portion (mm)
-100 -150 -200 -250 -300 -350 -400 -450 -500 -550 -600 Threshold (HU)
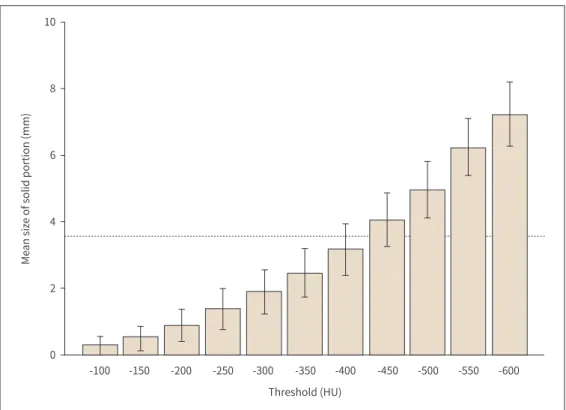
Fig. 2. Bar graph of bias between invasive foci and largest diameter of the solid portion on axial images along CT HU threshold with mean value and 95% confidence interval.
The dotted line represents the mean size of pathologically confirmed invasive foci (3.56 mm).
HU = Hounsfield units
10
8
6
4
2
0
Mean size of solid portion (mm)
-100 -150 -200 -250 -300 -350 -400 -450 -500 -550 -600 Threshold (HU)
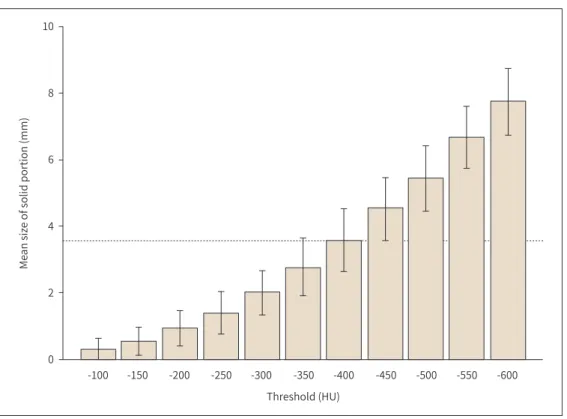
Fig. 3. Bar graph of bias between invasive foci and maximum diameter of the solid portion on multiplanar reconstruction images along CT HU threshold with mean value and 95% confidence interval.
The dotted line represents the mean size of pathologically confirmed invasive foci (3.56 mm).
HU = Hounsfield units
creases with high density and appears as high HU on CT, which is higher than the threshold, although it is difficult to differentiate with fibrosis, vasculatures, or the collapse of alveolar spaces (17, 18). According to the 2015 WHO classification, invasive foci of MIA are defined as either any histologic subtype other than a lepidic pattern (such as acinar, papillary, micropap- illary, or solid) or tumor cells infiltrating myofibroblastic stroma (14). Thus, we can assume that the density or cellularity of invasive foci in SSNs may be higher than tissue density or cel- lularity of approximately -400 HU empirically as a result of this study, even though not exactly -400 HU, suggesting higher cellularity or density than non-invasive tumor lesion with lepidic cellular growth or normal structures.
Some studies expended effort to set HU threshold for the solid lesions of SSNs (11-13) and tend to suggest a relatively high HU value as threshold (11, 12). Matsuguma et al. (11) used -160 HU for the cut off value on the lung window to define the solid portion of SSNs. Similar- ly, Ko et al. (12) used -188 HU for the threshold and regarded the part of the nodule that showed higher attenuation as a solid part. The Fleischner guidelines recommended mea- surement of the solid component with narrow and/or mediastinal setting, which may indi- cate HU threshold near -150 HU considering the width and level of mediastinal setting (2, 19). Meanwhile, Cohen et al. (13) suggested that segmentation of the solid component shows the best performance at a threshold of -350 HU, and measurements on mediastinal windows (window width, 400 HU; level, 30 HU) were significantly smaller than the actual sizes of the invasive components. In the same context, Lee et al. (20) compared two different thresholds,
namely, -160 HU and -400 HU. They concluded high diagnostic accuracy in -400 HU for deter- mining the presence of solid components of SSNs, whereas low sensitivity and negative pre- dictive value in -160 HU. Similarly, we showed -400 HU as a threshold value for defining the solid component of SSNs. The high HU threshold is a conservative suggestion, which may overlook the actual solid portion; however, as in our suggestion with a lower threshold, it can be observed that it fits well.
Several recent technological approaches are available to analyze SSN characteristics by us- Table 2. Classification of SSNs by Size of the Solid Portion on CT
Threshold (n = 25) AIS MIA IA
-100 HU
Axial 20 5 0
MPR 20 5 0
-150 HU
Axial 18 7 0
MPR 18 7 0
-200 HU
Axial 14 11 0
MPR 14 11 0
-250 HU
Axial 11 14 0
MPR 11 14 0
-300 HU
Axial 7 18 0
MPR 7 18 0
-350 HU
Axial 6 17 2
MPR 6 15 4
-400 HU
Axial 2 19 4
MPR 2 15 8
-450 HU
Axial 2 13 10
MPR 2 11 12
-500 HU
Axial 0 13 12
MPR 0 9 16
-550 HU
Axial 0 7 18
MPR 0 5 20
-600 HU
Axial 0 4 21
MPR 0 4 21
AIS = adenocarcinoma in situ, HU = Hounsfield units, IA = invasive adenocarcinoma, MIA = minimally inva- sive adenocarcinoma, MPR = multiplanar reconstruction, SSNs = subsolid nodules
ing CT textures, radiomics, or even artificial intelligence and deep learning (21-24). Chae et al. (21) reported that higher kurtosis is a significant differentiator of pre-invasive lesions from IA in SSNs. Son et al. (22) argued that the 75th percentile CT attenuation value and entropy can help distinguish them. Moreover, radiomics and deep learning have recently shown high performance in distinguishing IA along SSNs with an area under the curve more than 0.9 (23, 24). However, these complex methods are difficult to apply in daily practice, and further vali- dation is needed. Our -400 HU threshold proposal is easy to apply as the default setting in PACS like the mediastinum setting, with excellent inter-observer agreement and high specific- ity for invasiveness, and even higher accuracy for real pathologically confirmed size of inva- sive foci.
This study has a number of limitations. First, it was a single-center retrospective study, and bias could not be avoided. Second, the study design only included pathologically confirmed MIA. No data were available for pre-invasive lesions, such as atypical adenomatous hyperpla- sia or AIS, and IA, and this can be considered as selection bias. Third, the sample size was small. A future multi-center study with large sample size involving other pre-invasive lesions is warranted. Finally, direct pathologic comparison was not conducted between CT showing solid portion and that exhibiting invasive foci of tissue. Solid portions of SSNs have a tendency to represent invasive foci, but they do not directly correspond with invasive foci (25). However, by setting a threshold attenuation of -400 HU for the solid portion of SSNs like in our study, the maximum diameter of the solid portion of SSNs can be easily and rapidly acquired without statistical difference with pathologically confirmed solid portion and with great inter-observer agreement.
-600 -550 -500 -450 -400 -350 -300 -250 -200 -150 -100 Threshold (HU)
25
20
15
10
5
0
Number
IA MIA AIS
-600 -550 -500 -450 -400 -350 -300 -250 -200 -150 -100 Threshold (HU)
25
20
15
10
5
0
Number
IA MIA AIS
A B
Fig. 4. Stacked bar graph of 25 MIA SSNs for classification into radiologic AIS, MIA, and IA based on criteria for the measured solid portion on CT at each HU threshold.
A, B. Radiologic classification of the 25 SSNs, based on axial images (A) and multiplanar reconstruction images (B).
AIS = adenocarcinoma in situ, HU = Hounsfield units, IA = invasive adenocarcinoma, MIA = minimally invasive adenocarcinoma, SSNs = sub- solid nodules
In conclusion, -400 HU might be the optimal threshold to define the solid component of SSNs with the lowest bias and excellent inter-observer agreement. This threshold value is po- tentially helpful as a surrogate marker of invasive foci and to differentiate part-solid nodules from pure ground-glass nodules for guidelines.
Author Contributions
Conceptualization, L.S., L.D.H., K.T.H., P.C.H.; data curation, L.S., L.D.H., L.J.H.; formal analysis, H.K.; investigation, L.S., L.D.H., P.C.H., L.S.; methodology, L.S., L.D.H., K.T.H., P.C.H.; supervision, K.T.H., L.S.; visualization, L.S., K.T.H.; writing—original draft, L.S.
Conflicts of Interest
The authors have no potential conflicts of interest to disclose.
Funding
This study was supported by a faculty research grant of Yonsei University College of Medicine (6-2018-0060).
Acknowledgments
The scientific guarantor of this publication is Tae Hoon Kim (Department of Radiology and the Re- search Institute of Radiological Science, Gangnam Severance Hospital, Yonsei University College of Medicine).
Kyunghwa Han, an expert in statistics, provided statistical analysis and advice.
REFERENCES
1. Hansell DM, Bankier AA, MacMahon H, McLoud TC, Müller NL, Remy J. Fleischner Society: glossary of terms for thoracic imaging. Radiology 2008;246:697-722
2. MacMahon H, Naidich DP, Goo JM, Lee KS, Leung ANC, Mayo JR, et al. Guidelines for management of inci- dental pulmonary nodules detected on CT images: from the Fleischner Society 2017. Radiology 2017;284:
228-243
3. Heuvelmans MA, Oudkerk M. Management of subsolid pulmonary nodules in CT lung cancer screening. J Thorac Dis 2015;7:1103-1106
4. American College of Radiology. Lung CT Screening Reporting & Data System (Lung-RADS), version 1.1.
Available at. https://www.acr.org/Clinical-Resources/Reporting-and-Data-Systems/Lung-Rads. Published 2019. Accessed Mar 5, 2020
5. Detterbeck FC, Boffa DJ, Kim AW, Tanoue LT. The eighth edition lung cancer stage classification. Chest 2017;151:193-203
6. Travis WD, Brambilla E, Noguchi M, Nicholson AG, Geisinger KR, Yatabe Y, et al. International Association for the Study of Lung Cancer/American Thoracic Society/European Respiratory Society international multidis- ciplinary classification of lung adenocarcinoma. J Thorac Oncol 2011;6:244-285
7. Lee HY, Lee KS. Ground-glass opacity nodules: histopathology, imaging evaluation, and clinical implica- tions. J Thorac Imaging 2011;26:106-118
8. Ridge CA, Yildirim A, Boiselle PM, Franquet T, Schaefer-Prokop CM, Tack D, et al. Differentiating between subsolid and solid pulmonary nodules at CT: inter- and intraobserver agreement between experienced thoracic radiologists. Radiology 2016;278:888-896
9. Penn A, Ma M, Chou BB, Tseng JR, Phan P. Inter-reader variability when applying the 2013 Fleischner guide- lines for potential solitary subsolid lung nodules. Acta Radiol 2015;56:1180-1186
10. Kakinuma R, Ashizawa K, Kuriyama K, Fukushima A, Ishikawa H, Kamiya H, et al. Measurement of focal ground-glass opacity diameters on CT images: interobserver agreement in regard to identifying increases in the size of ground-glass opacities. Acad Radiol 2012;19:389-394
11. Matsuguma H, Nakahara R, Anraku M, Kondo T, Tsuura Y, Kamiyama Y, et al. Objective definition and mea- surement method of ground-glass opacity for planning limited resection in patients with clinical stage IA
adenocarcinoma of the lung. Eur J Cardiothorac Surg 2004;25:1102-1106
12. Ko JP, Suh J, Ibidapo O, Escalon JG, Li J, Pass H, et al. Lung adenocarcinoma: correlation of quantitative CT findings with pathologic findings. Radiology 2016;280:931-939
13. Cohen JG, Goo JM, Yoo RE, Park CM, Lee CH, Van Ginneken B, et al. Software performance in segmenting ground-glass and solid components of subsolid nodules in pulmonary adenocarcinomas. Eur Radiol 2016;
26:4465-4474
14. Travis WD, Brambilla E, Nicholson AG, Yatabe Y, Austin JHM, Beasley MB, et al. The 2015 World Health Orga- nization classification of lung tumors: impact of genetic, clinical and radiologic advances since the 2004 classification. J Thorac Oncol 2015;10:1243-1260
15. White S, Pharoah M. Oral radiology: principles and interpretation. 4th ed. St. Louis, MO: Mosby 2009:270- 274
16. Gücük A, Uyetürk U. Usefulness of hounsfield unit and density in the assessment and treatment of urinary stones. World J Nephrol 2014;3:282-286
17. Aoki T, Hanamiya M, Uramoto H, Hisaoka M, Yamashita Y, Korogi Y. Adenocarcinomas with predominant ground-glass opacity: correlation of morphology and molecular biomarkers. Radiology 2012;264:590-596 18. Gandara DR, Aberle D, Lau D, Jett J, Akhurst T, Heelan R, et al. Radiographic imaging of bronchioloalveolar
carcinoma: screening, patterns of presentation and response assessment. J Thorac Oncol 2006;1:S20-26 19. Naidich DP, Bankier AA, MacMahon H, Schaefer-Prokop CM, Pistolesi M, Goo JM, et al. Recommendations
for the management of subsolid pulmonary nodules detected at CT: a statement from the Fleischner Soci- ety. Radiology 2013;266:304-317
20. Lee JH, Kim TH, Lee S, Han K, Byun MK, Chang YS, et al. High versus low attenuation thresholds to deter- mine the solid component of ground-glass opacity nodules. PLoS One 2018;13:e0205490
21. Chae HD, Park CM, Park SJ, Lee SM, Kim KG, Goo JM. Computerized texture analysis of persistent part-solid ground-glass nodules: differentiation of preinvasive lesions from invasive pulmonary adenocarcinomas.
Radiology 2014;273:285-293
22. Son JY, Lee HY, Lee KS, Kim JH, Han J, Jeong JY, et al. Quantitative CT analysis of pulmonary ground-glass opacity nodules for the distinction of invasive adenocarcinoma from pre-invasive or minimally invasive adenocarcinoma. PLoS One 2014;9:e104066
23. Luo T, Xu K, Zhang Z, Zhang L, Wu S. Radiomic features from computed tomography to differentiate inva- sive pulmonary adenocarcinomas from non-invasive pulmonary adenocarcinomas appearing as part-sol- id ground-glass nodules. Chin J Cancer Res 2019;31:329-338
24. Gong J, Liu J, Hao W, Nie S, Zheng B, Wang S, et al. A deep residual learning network for predicting lung adenocarcinoma manifesting as ground-glass nodule on CT images. Eur Radiol 2020;30:1847-1855 25. Lee KH, Goo JM, Park SJ, Wi JY, Chung DH, Go H, et al. Correlation between the size of the solid component
on thin-section CT and the invasive component on pathology in small lung adenocarcinomas manifesting as ground-glass nodules. J Thorac Oncol 2014;9:74-82
폐의 아고형결절에서 침습적 병소를 검출하기 위한 반-정량 분석을 통한 최적의 CT 임계 값 결정
이선용1 · 이다현1 · 이재호1 · 이성수2 · 한경화3 · 박철환1 · 김태훈1*
목적 병리학적 침습성 병소를 기준으로 폐 아고형결절의 고형 부분을 진단하기 위한 최적의 CT 임계값을 알아보고자 하였다.
대상과 방법 병리적으로 최소 침습성 선암이 확진된 25명의 환자에 대해 비조영증강 흉부 CT 영상을 후향적으로 분석하였다. CT 영상에서 고형 부분은 -600부터 -100 Hounsfield units (이하 HU) 단위 사이에서 50 HU 간격의 다양한 임계치보다 높은 감쇠를 나타내는 영역으로 정의되었다. 각 임계치에서 고형부분의 축상 영상 최대 직경과 다면재구성 영상 최대 직경을 각각 측정한 후, 선형 혼합 모델을 이용하여 병리적 침습성 병소 크기와 비교하였다.
결과 -400 HU 단위의 임계값에서 아고형결절의 고형 부분의 크기와 침습성 병소의 크기는 통계학적으로 유의미한 차이를 보이지 않았으며(축상 영상: p = 0.2682, 다면재구성 영상: p = 0.963) 오차가 가장 적었다(축상 영상: 0.388, 다면재구성 영상: -0.0176).
결론 아고형결절의 침습성 병소를 진단하기 위해, -400 HU 단위가 고형 부분을 정의하는 최 적의 정량 분석 임계값일 수 있다.
1연세대학교 의과대학 강남세브란스병원 영상의학과, 방사선의과학연구소,
2연세대학교 의과대학 강남세브란스병원 흉부외과,
3연세대학교 의과대학 세브란스병원 영상의학과