ABSTRACT
Background: It is extremely important to objectively take a view of population health to provide useful information to decision makers, health-sector leaders, researchers, and informed citizens. This study aims to examine the burden of disease in Korea as of 2015, and to study how the burden of disease changes with the passage of time.
Methods: We used results from the Korean National Burden of Disease and Injuries Study 2015 for all-cause mortality, cause-specific mortality, and non-fatal disease burden to derive disability-adjusted life years (DALYs) by gender and age groups from 2007 to 2015. DALYs were calculated as the sum of the years of life lost (YLLs) and the years lived with disability (YLDs).
Results: In 2015, the burden of disease for Korean people was calculated at 29,476 DALYs per 100,000 population. DALYs caused by low back pain were the highest, followed by diabetes mellitus and chronic obstructive pulmonary disease. The burden of disease showed a consistently increasing trend from 2007 to 2015. Although YLLs have been on the decrease since 2011, the increase in YLDs has contributed to the overall rise in DALYs. The DALYs per 100,000 population in 2015 increased by 28.1% compared to 2007.
Conclusion: As for the diseases for which the burden of disease is substantially increasing, it is needed to establish appropriate policies in a timely manner. The results of this study are expected to be the basis for prioritizing public health and health care policies in Korea.
Keywords: Disability-Adjusted Life Years; Burden of Disease; Years of Life Lost;
Years Lived with Disability; Korean National Burden of Disease Study
INTRODUCTION
It is important to objectively measure the population health to provide useful information to decision makers, health-sector leaders, researchers, and informed citizens. In the early 1990's, international public health and medical care organizations including the World Health Organization (WHO), were trying to figure out how to reasonably allocate limited public health and medical care resources. Against this backdrop, voices were raised to find a new methodology to calculate the health level of population groups.1,2
Original Article
Received: Aug 31, 2018 Accepted: Oct 23, 2018 Address for Correspondence:
Seok-Jun Yoon, MD, PhD
Department of Preventive Medicine, Korea University College of Medicine, 71 Inchon-ro, Seongbuk-gu, Seoul 02841, Korea.
E-mail: [email protected]
© 2019 The Korean Academy of Medical Sciences.
This is an Open Access article distributed under the terms of the Creative Commons Attribution Non-Commercial License (https://
creativecommons.org/licenses/by-nc/4.0/) which permits unrestricted non-commercial use, distribution, and reproduction in any medium, provided the original work is properly cited.
ORCID iDs Young-Eun Kim
https://orcid.org/0000-0003-0694-6844 Hyesook Park
https://orcid.org/0000-0002-9359-6522 Min-Woo Jo
https://orcid.org/0000-0002-4574-1318 In-Hwan Oh
https://orcid.org/0000-0002-5450-9887 Dun-Sol Go
https://orcid.org/0000-0002-9025-7760 Jaehun Jung
https://orcid.org/0000-0002-4856-3668 Seok-Jun Yoon
https://orcid.org/0000-0003-3297-0071 Funding
This study was supported by a grant from the Korean Health Technology R&D Project,
Young-Eun Kim ,1 Hyesook Park ,2 Min-Woo Jo ,3 In-Hwan Oh ,4 Dun-Sol Go ,1 Jaehun Jung ,1 and Seok-Jun Yoon 1
1Department of Preventive Medicine, Korea University College of Medicine, Seoul, Korea
2Department of Preventive Medicine, Ewha Womans University School of Medicine, Seoul, Korea
3Department of Preventive Medicine, University of Ulsan College of Medicine, Seoul, Korea
4Department of Preventive Medicine, School of Medicine, Kyung Hee University, Seoul, Korea
Trends and Patterns of Burden of Disease and Injuries in Korea Using Disability-Adjusted Life Years
Preventive &
Social Medicine
Ministry of Health & Welfare, Republic of Korea (No. of study: HI13C0729).
Disclosure
The authors have no potential conflicts of interest to disclose.
Author Contributions
Conceptualization: Kim YE, Jung J, Yoon SJ. Data curation: Kim YE, Go DS. Formal analysis: Kim YE. Investigation: Yoon SJ.
Methodology: Kim YE, Park H, Jo MW, Oh IH, Jung J. Validation: Park H, Jo MW, Oh IH.
Visualization: Kim YE. Writing - original draft:
Kim YE. Writing - review & editing: Kim YE, Go DS, Jung J, Yoon SJ.
Around that time, Alan Lopez, WHO, epidemiologist, and Christopher Murray, professor at Harvard School of Public Health, developed the disability-adjusted life years (DALYs) as an indicator to comprehensively measure the health level of a population group. DALYs consists of the sum of the years of life lost (YLLs) due to premature death, which refers to the number of years lost as a person dies earlier than life expectancy, and the years lived with disability (YLDs), which refers to the number of healthy years lost due to morbidity or injuries.3 The basic unit for these summary measures is lost years of healthy life. In other words, 1 DALY means that 1 healthy year is lost due to premature death, disease, or disability, and it means that the higher the DALYs, the wider the gap from the ideal health level.4 The WHO and other organizations started using DALYs as the criteria to reasonably allocate resources. In addition, it offered useful information to decision makers, health-sector leaders, researchers, and informed citizens. The most representative burden of disease study calculated with DALYs is the Global Burden of Disease (GBD) study that is conducted by the Institute for Health Metrics and Evaluation led by professor Christopher Murray. In the GBD study, researchers collect epidemiological data from previously published literature or statistics to derive the DALYs for each disease in many different countries around the world.
In doing so, they borrow the epidemiological data of other countries if there are no available data. Therefore, as for the issues have been raised regarding the reliability and validity of the epidemiological data that are put into calculating DALYs in the GBD study, and researchers are making tremendous efforts to enhance the qualitative level of the input parameters required to calculate DALYs.
As Korea has a national health insurance system that covers more than 99% of the total population, it is relatively easier to calculate valid and reliable input parameters (incidence and prevalence etc.) using the claims data. Therefore, efforts have been made since the early 2000s to calculate Korea's burden of disease with our own data sources. In the initial period, most of the Korean burden of disease studies were usually focusing on a single disease such as stroke or mental illness.5,6 A 2002 study on the burden of disease of Korean people was the first of its kind in Korea and the most recent burden of disease study is based on data from 2012.7,8 However, because research methodology improved in the period between these two studies, they did not use the same methodology, and the lists of diseases measured were also different from each other. Therefore, it is impossible to make a direct comparison between those studies in terms of changes of burden of disease.
In this regard, this study aims to examine the burden of disease in Korea in 2015, and to study how the burden of disease changes with the passage of time, by examining data from 2007–2015 using the same classification of diseases and the same methodology.
METHODS
Study design and data sources
This study measured the DALYs of Korean people in 2015 by using a methodology that was revised to fit the circumstances of Korea based on the GBD, and we applied the incidence- based approach when performing calculation.9
To calculate incidence and prevalence per year for the period from 2007 to 2015, we used cancer registration data for cancer, hospital discharge injury data for injuries, and the National Health Insurance Service claims data for all the other diseases. In order to prevent
the overestimation of incidence and prevalence when using the claims data, for each disease we extracted the number of times hospitalization occurred and the number of visits to outpatient clinics (1–5), based on advice from experts and literature reviews. In particular, to calculate the number of incidence cases, we applied a washout period, defined as from at least 1 year to a maximum of 5 years.
Korea operated a separate disease classification code for oriental medicine, but it was integrated to the general system as part of the sixth revision of the Korean Standard Classification of Diseases in 2011. In consideration of this, for the trends and patterns of burden of disease by year during the 2007–2015 period presented in this study, we derived YLDs by excluding the claims filed by oriental clinics to secure comparability by year, and in the 2015 burden of disease results, the claims filed by oriental clinics were included in calculating YLDs. Therefore, there are some differences in ranks and DALYs.
Disability weight (DW) is a value which shows a quantitative level of disability of a certain health condition or disease. It is indicated on a scale from 0 (perfect health) to 1 (equivalent to death). In DALYs, DW serves as a bridge to connect death with disease and morbidity. In the case of DW, one should be cautious to apply DW as calculated in one country to another country because there can be some differences in sociocultural perspectives of disease.
Consequently, this study calculated DALYs by applying a DW that was calculated to be applied in Korea.10
To calculate mortality, we assumed mortality by age, gender, and disease using the 2007–2015 cause of death data from the Statistics Korea, and in doing so, we applied the garbage code- redistribution method for the causes that could not be the cause of death.11
To calculate the number of years lost to premature death, we used the standard expected YLLs. As for the standard life expectancy, the 2007–2015 life table by year, gender, and age offered by the Statistics Korea was used.12
In calculating the YLLs, YLDs, and DALYs per 100,000 population, we used the mid-year population by year, gender, and age data from the Statistics Korea Vital Statistics.13 Computation of YLLs due to premature mortality, YDLs and DALYs
The YLLs for each disease and category of injury was calculated by multiplying the number of deaths by gender and year with the standard life expectancy for each age group.1 YLDs were calculated by multiplying the number of incidence cases, mean duration and DW. Duration of disease and the average age at onset were estimated using the DISMOD-2 program, and particularly for infectious diseases, we directly calculated them using the claims data. In this study, an age-weighting rate of 4% and a time discount of 3% were applied when calculating YLLs and YLDs.8 DALYs for each disease were produced with the sum of YLLs and YLDs.
Disease and injuries cause hierarchies
In this study, causes of mortality and morbidity are structured with use of a four-level classification hierarchy to produce levels that are mutually exclusive and collectively exhaustive.14 At level 1, all diseases were classified into three categories. They were classified as
communicable, maternal, neonatal, and nutrition disease (CMNN), non-communicable diseases (NCDs), and injuries. Diseases are classified into 21 disease groups at level 2, into
165 groups at level 3, and 123 groups at level 4. In this study, we did not make distinction between level 3 and level 4; presenting level 4 as the criteria if there was a level 4 under level 3 in the hierarchy, while level 3 was presented as the criteria if there was no level 4 under level 3. In other words, there was three groups at level 1, 21 groups at level 2, and 260 groups at level 3+4. The cause list is shown in Supplementary Table 1.
Ranking lists
This study ranked diseases based on the DALYs per 100,000 population by gender and age. We ranked a total of 242 diseases by excluding 18 residual categories (e.g., other
musculoskeletal disorders, other chronic respiratory diseases, other infectious diseases, etc.) that were not classified into a certain disease category during analysis.8
Ethics statement
This study was approved by the Institutional Review Board (IRB) of Korea University (IRB No.
KU-IRB-18-EX-51-A-1). Informed consent was waived by the board.
RESULTS
Burden of disease and injuries in 2015
In Korea, the total number of all-age DALYs in 2015 was 15 million and DALYs per 100,000 population was 29,476 (Table 1). To look into the trend by age, the crude DALYs increased until people were in their 50s and then showed a decreasing trend, and the DALYs per 100,000 population increased until people were in their 70s and slightly decreased at the age of 80 and older. The distribution of DALYs by age was similar both in men and women. Women showed a higher burden of disease overall compared to men (DALYs per 100,000 population for men was 28,887, while that of women was 30,064), but when observed by age group, there were some differences in their patterns. Based on the DALYs per 100,000 population, men and women showed a similar level of DALYs in infancy and early childhood (< 10 years old), but men were at a higher level in adolescence, women were at a higher level in middle age (20s to 40s), and men were again at a higher level at the age of 50 and older (Fig. 1).
The DALYs for Korean people in 2015 consists of 14% YLL and 86.0% YLD. In the case of men, 18% of DALYs were attributed to YLL, while for women, it was 11%. In other words, it was analyzed that the proportion of YLL in the gender-specific DALYs was slightly larger for men than for women. To look into each age group, the proportion of YLL showed an increasing trend as the age increased. In the 0–9 age group, it was high at 14%, but it decreased to 6% in the 10–19 age group and then consistently increased, reaching 41% in the 80+ age group. As for women, it was observed that the proportion of YLL was slightly lower compared to men in all age groups (Fig. 1).
From the analysis results of each higher-level (level 1) disease group, CMNN made up 2.8%
of the total DALYs, while NCD and injuries made up 87.1% and 10.1%, respectively. Overall, YLD made up a larger proportion than YLL, and in the case of NCD, 89% of the total DALYs were due to YLD, while for CMNN it was 79% and for injuries was 66%. For women, CMNN and NCD showed higher DALYs per 100,000 population compared to men, whereas injuries showed a higher figure for men than for women (Table 1).
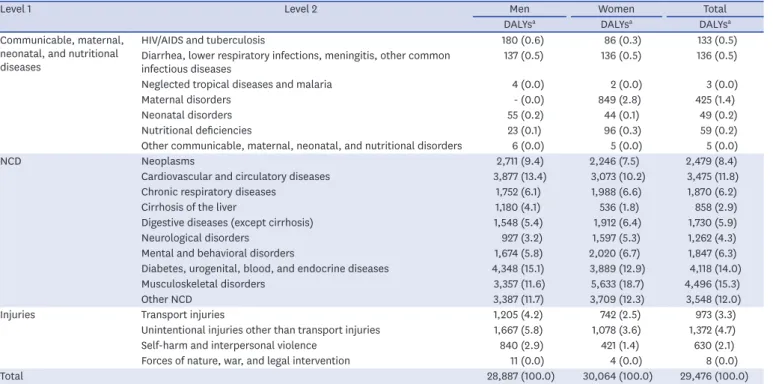
From the analysis results of each middle-level (level 2) disease group, the DALYs per 100,000 population for musculoskeletal disorders was 4,496. This ranked the highest as it made up 15.3% of the total DALYs in Korea. It was followed by the DALYs per 100,000 population for diabetes, urogenital, blood, and endocrine diseases at 4,118 (14.0%), other NCD at 3,548 (12.0%), cardiovascular and circulatory diseases at 3,475 (11.8%), and neoplasms at 2,479 (8.4%). In the case of men, the DALYs per 100,000 population for diabetes, urogenital, blood, and endocrine diseases was 4,348, ranked the highest as it made up 15.1% of the total DALYs of men. For women, the DALYs per 100,000 population due to musculoskeletal disorders was the highest at 5,633 (18.7% of the women's total DALYs) (Table 1).
Table 1. DALYs per 100,000 population by gender and level 2 disease groups in Korea, 2015
Level 1 Level 2 Men Women Total
DALYsa DALYsa DALYsa
Communicable, maternal, neonatal, and nutritional diseases
HIV/AIDS and tuberculosis 180 (0.6) 86 (0.3) 133 (0.5)
Diarrhea, lower respiratory infections, meningitis, other common
infectious diseases 137 (0.5) 136 (0.5) 136 (0.5)
Neglected tropical diseases and malaria 4 (0.0) 2 (0.0) 3 (0.0)
Maternal disorders - (0.0) 849 (2.8) 425 (1.4)
Neonatal disorders 55 (0.2) 44 (0.1) 49 (0.2)
Nutritional deficiencies 23 (0.1) 96 (0.3) 59 (0.2)
Other communicable, maternal, neonatal, and nutritional disorders 6 (0.0) 5 (0.0) 5 (0.0)
NCD Neoplasms 2,711 (9.4) 2,246 (7.5) 2,479 (8.4)
Cardiovascular and circulatory diseases 3,877 (13.4) 3,073 (10.2) 3,475 (11.8)
Chronic respiratory diseases 1,752 (6.1) 1,988 (6.6) 1,870 (6.2)
Cirrhosis of the liver 1,180 (4.1) 536 (1.8) 858 (2.9)
Digestive diseases (except cirrhosis) 1,548 (5.4) 1,912 (6.4) 1,730 (5.9)
Neurological disorders 927 (3.2) 1,597 (5.3) 1,262 (4.3)
Mental and behavioral disorders 1,674 (5.8) 2,020 (6.7) 1,847 (6.3)
Diabetes, urogenital, blood, and endocrine diseases 4,348 (15.1) 3,889 (12.9) 4,118 (14.0)
Musculoskeletal disorders 3,357 (11.6) 5,633 (18.7) 4,496 (15.3)
Other NCD 3,387 (11.7) 3,709 (12.3) 3,548 (12.0)
Injuries Transport injuries 1,205 (4.2) 742 (2.5) 973 (3.3)
Unintentional injuries other than transport injuries 1,667 (5.8) 1,078 (3.6) 1,372 (4.7)
Self-harm and interpersonal violence 840 (2.9) 421 (1.4) 630 (2.1)
Forces of nature, war, and legal intervention 11 (0.0) 4 (0.0) 8 (0.0)
Total 28,887 (100.0) 30,064 (100.0) 29,476 (100.0)
Values are presented as number (%).
DALY = disability-adjusted life year, HIV/AIDS = human immunodeficiency virus/acquired immune deficiency syndrome, NCD = non-communicable disease.
aDALYs per 100,000 population.
YLL YLD
Women 0–9
10–19 20–29 30–39 40–49 50–59 60–69 70–79
≥ 80 Year Men
10,000 20,000 30,000 40,000 50,000 60,000
10,000 0 0
20,000 30,000
40,000 50,000
60,000
12,195 11,078 15,246 21,727 30,658 43,360
53,886 55,246
50,023
12,463 9,593
18,493 27,192
31,932
42,674 47,439 46,981 42,090
*Unit: DALYs, per 100,000
Fig. 1. DALYs per 100,000 population by gender and age group in Korea, 2015.
DALY = disability-adjusted life year, YLLs = years of life lost, YLDs = years lived with disability.
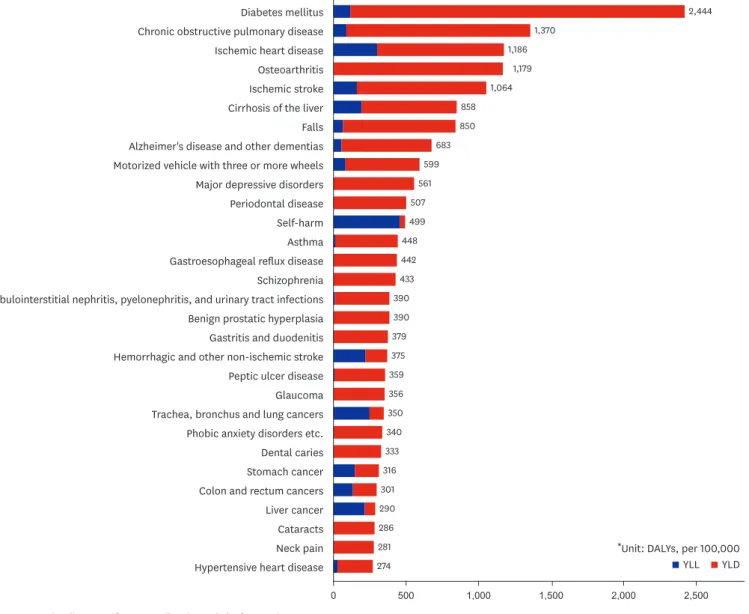
From the analysis results of each lower-level (levels 3 and 4) disease group, the DALYs per 100,000 population for low back pain was the highest at 2,671 (9.1%), followed by diabetes mellitus at 2,444 (8.3%), chronic obstructive pulmonary disease (COPD) at 1,370 (4.6%), ischemic heart disease at 1,186 (4.0%), and osteoarthritis at 1,179 (4.0%). The DALYs of the top three diseases made up 22% of the total Korean burden of disease in 2015, with the top 10 diseases comprising 43.8% (Fig. 2). For men, the DALYs per 100,000 population for diabetes mellitus was the highest at 2,841 (9.8%), followed by low back pain at 2,140 (7.4%), and ischemic heart disease at 1,481 (5.1%). For women, the DALYs per 100,000 population for low back pain was the highest at 3,202 (10.7%), followed by diabetes mellitus at 2,048 (6.8%), and osteoarthritis at 1,763 (5.9%). Among the burden of disease for men, the top three diseases made up 22.4% out of the total burden of disease of men, while among the burden of disease of women, the top three diseases made up 22.3% out of the total burden of disease of women (Table 2).
YLL YLD
*Unit: DALYs, per 100,000 2,671 2,444 1,370
1,186 1,179 1,064 858 850 683 599 561 507 499 448 442 433 390 390 379 375 359 356 350 340 333 316 301 290 286 281 274 Low back pain
Diabetes mellitus Chronic obstructive pulmonary disease Ischemic heart disease Osteoarthritis Ischemic stroke Cirrhosis of the liver Falls Alzheimer's disease and other dementias Motorized vehicle with three or more wheels Major depressive disorders Periodontal disease Self-harm Asthma Gastroesophageal reflux disease Schizophrenia Tubulointerstitial nephritis, pyelonephritis, and urinary tract infections Benign prostatic hyperplasia Gastritis and duodenitis Hemorrhagic and other non-ischemic stroke Peptic ulcer disease Glaucoma Trachea, bronchus and lung cancers Phobic anxiety disorders etc.
Dental caries Stomach cancer Colon and rectum cancers Liver cancer Cataracts Neck pain Hypertensive heart disease
0 500 1,000 1,500 2,000 2,500
Fig. 2. Top 30 leading specific causes (level 3 and 4) of DALYs in Korea, 2015.
DALY = disability-adjusted life year, YLLs = years of life lost, YLDs = years lived with disability.
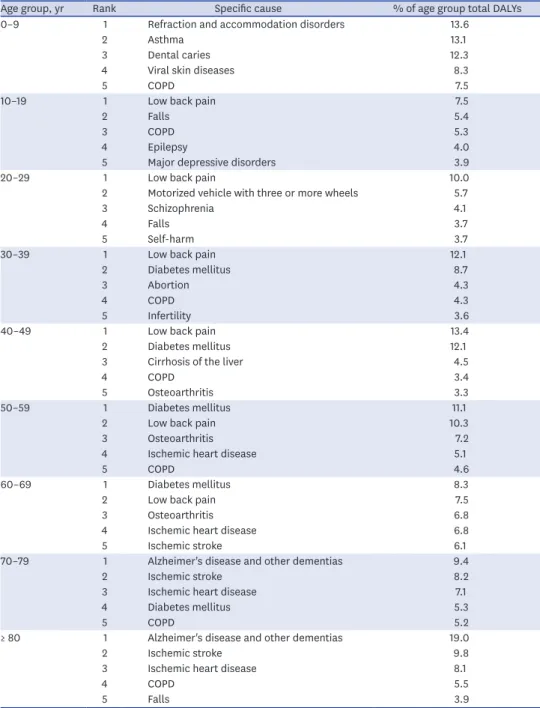
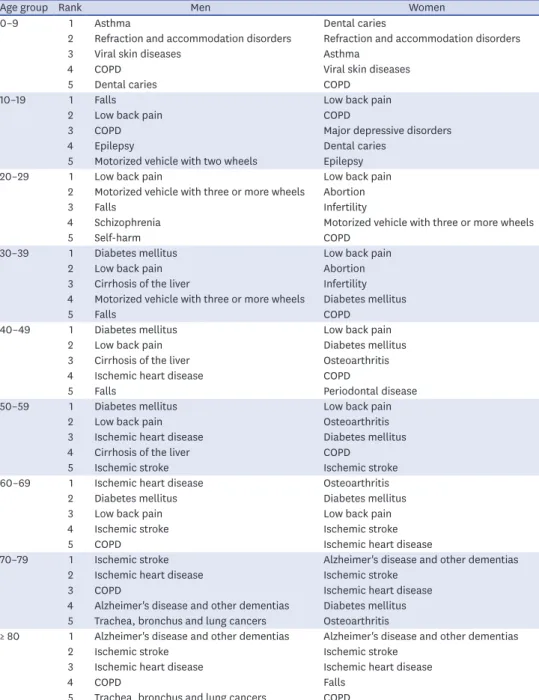
Regarding age group, in the 0–9 age group, the burden from refraction and accommodation disorders was ranked highest at 13.6%, followed by asthma at 13.1%, and dental caries at 12.3%. The DALYs of those top three diseases comprise 38.9% of the total DALYs of the 0–9 age group. In the 10–49 age group, low back pain showed the highest burden of disease, while diabetes mellitus was ranked highest in the 50–69 age group and Alzheimer's disease and other dementias in the age group of 70 and older (Table 3). In particular, in the case of women in the pregnancy and childbirth stage (between the ages of 20 and 39), the burden of specific diseases such as abortion and women infertility was high, and for the men aged 20–39, it was characteristic that the burden of injury-related diseases including falls and injuries from motorized vehicles with three or more wheels was high (Table 4).
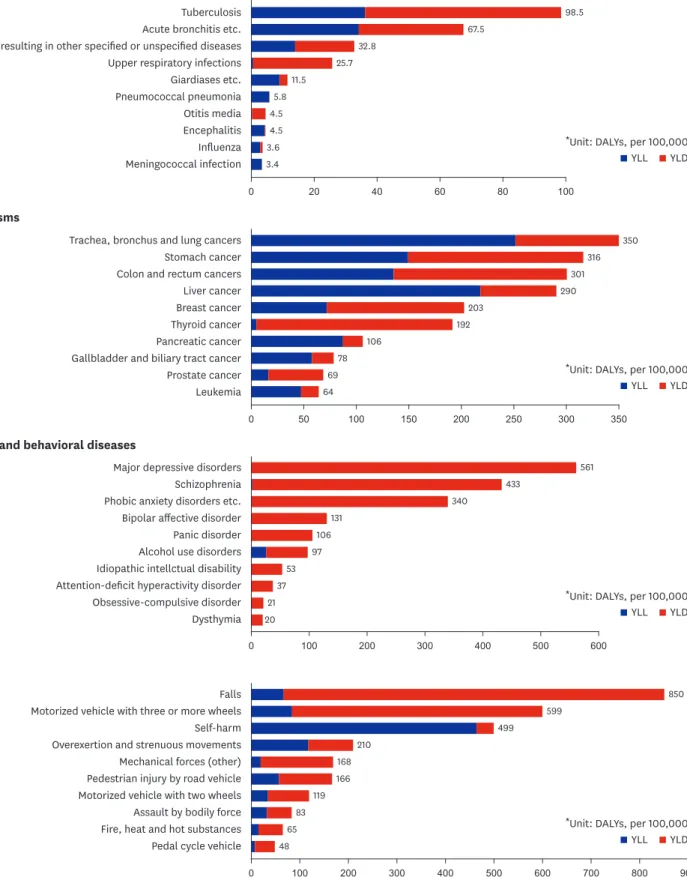
It was analyzed that communicable diseases accounted for 0.9% of the total DALYs in Korea in 2015. The burden of disease for men was approximately 42% higher than that for women, with YLLs making up 45% and YLDs making up 55% (Table 1). Among communicable diseases, the DALYs per 100,000 population for tuberculosis was the highest at 98.5, followed by acute bronchitis etc., and HIV resulting in other specified or unspecified diseases (Fig. 3A).
Neoplasms accounted for 8.4% of total DALYs in Korea in 2015. Men had a 21% higher burden of disease compared to women. In neoplasms, YLLs makes up 53% and YLDs makes up 47%, and it comprises 31.8% of the total YLLs and 4.6% of the total YLDs in Korea. In particular, in terms of the level 2 disease classification, neoplasms showed the highest YLLs (Table 1). Among Table 2. DALYs per 100,000 population by gender and level 3 and 4 disease groups in Korea, 2015
Rank Men DALYsa Women DALYsa
1 Diabetes mellitus 2,841 Low back pain 3,202
2 Low back pain 2,140 Diabetes mellitus 2,048
3 Ischemic heart disease 1,481 Osteoarthritis 1,763
4 COPD 1,281 COPD 1,460
5 Cirrhosis of the liver 1,180 Ischemic stroke 999
6 Ischemic stroke 1,129 Alzheimer's disease and other dementias 955
7 Falls 953 Ischemic heart disease 892
8 Benign prostatic hyperplasia 780 Major depressive disorders 748
9 Motorized vehicle with three or more wheels 680 Falls 747
10 Self-harm 664 Tubulointerstitial nephritis, pyelonephritis, and urinary tract infections 600
11 Osteoarthritis 595 Cirrhosis of the liver 536
12 Periodontal disease 503 Gastroesophageal reflux disease 523
13 Trachea, bronchus and lung cancers 480 Motorized vehicle with three or more wheels 519
14 Liver cancer 450 Periodontal disease 510
15 Schizophrenia 435 Abortion 504
16 Hemorrhagic and other non-ischemic strokes 419 Asthma 490
17 Stomach cancer 415 Gastritis and duodenitis 480
18 Alzheimer's disease and other dementias 411 Schizophrenia 430
19 Asthma 406 Phobic anxiety disorders etc. 415
20 Major depressive disorders 375 Women infertility 406
21 Gastroesophageal reflux disease 360 Dental caries 402
22 Colon and rectum cancers 358 Breast cancer 399
23 Glaucoma 355 Peptic ulcer disease 368
24 Peptic ulcer disease 350 Glaucoma 358
25 Gout 303 Self-harm 334
26 Gastritis and duodenitis 277 Hemorrhagic and other non-ischemic stroke 331
27 Mechanical forces (other) 273 Cataracts 324
28 Overexertion and strenuous movements 268 Neck pain 322
29 Phobic anxiety disorders etc. 264 Thyroid cancer 308
30 Dental caries 263 Hypertensive heart disease 296
DALY = disability-adjusted life year, COPD = chronic obstructive pulmonary disease.
aDALYs per 100,000 population.
neoplasms, the DALYs per 100,000 population for trachea, bronchus, and lung cancers was the highest at 350, followed by stomach cancer, colon and rectum cancers, liver cancer, and breast cancer in rank order (Fig. 3B). For men, trachea, bronchus, and lung cancers showed the highest burden, while the burden of breast cancer was the highest for women.
It was revealed that mental and behavioral disorders occupied 6.3% of the total DALYs in 2015. In mental and behavioral disorders, YLLs makes up 2% and YLDs makes up 98%, and they comprise 0.7% out of the total YLLs and 7.2% out of the total YLDs in Korea (Table 1).
Among mental and behavioral disorders, the DALYs per 100,000 population for major
Table 3. Top 5 leading specific causes (level 3 and 4) of DALYs by age group in Korea, 2015
Age group, yr Rank Specific cause % of age group total DALYs
0–9 1 Refraction and accommodation disorders 13.6
2 Asthma 13.1
3 Dental caries 12.3
4 Viral skin diseases 8.3
5 COPD 7.5
10–19 1 Low back pain 7.5
2 Falls 5.4
3 COPD 5.3
4 Epilepsy 4.0
5 Major depressive disorders 3.9
20–29 1 Low back pain 10.0
2 Motorized vehicle with three or more wheels 5.7
3 Schizophrenia 4.1
4 Falls 3.7
5 Self-harm 3.7
30–39 1 Low back pain 12.1
2 Diabetes mellitus 8.7
3 Abortion 4.3
4 COPD 4.3
5 Infertility 3.6
40–49 1 Low back pain 13.4
2 Diabetes mellitus 12.1
3 Cirrhosis of the liver 4.5
4 COPD 3.4
5 Osteoarthritis 3.3
50–59 1 Diabetes mellitus 11.1
2 Low back pain 10.3
3 Osteoarthritis 7.2
4 Ischemic heart disease 5.1
5 COPD 4.6
60–69 1 Diabetes mellitus 8.3
2 Low back pain 7.5
3 Osteoarthritis 6.8
4 Ischemic heart disease 6.8
5 Ischemic stroke 6.1
70–79 1 Alzheimer's disease and other dementias 9.4
2 Ischemic stroke 8.2
3 Ischemic heart disease 7.1
4 Diabetes mellitus 5.3
5 COPD 5.2
≥ 80 1 Alzheimer's disease and other dementias 19.0
2 Ischemic stroke 9.8
3 Ischemic heart disease 8.1
4 COPD 5.5
5 Falls 3.9
DALY = disability-adjusted life year, COPD = chronic obstructive pulmonary disease.
depressive disorders was ranked highest at 561, followed by schizophrenia, phobic anxiety disorders etc., bipolar affective disorder, and panic disorder (Fig. 3C).
Injuries occupied 10.1% of the total DALYs in 2015. Injuries accounted for 34% of YLLs and 66% of YLDs, and 25% of the total YLLs and 8% of the total YLDs in Korea (Table 1). The DALYs per 100,000 population for falls was the highest at 850, followed by injuries from motorized vehicles with three or more wheels, and self-harm (Fig. 3D).
Table 4. Top 5 leading specific causes (level 3 and 4) of DALYs by gender and age group in Korea, 2015
Age group Rank Men Women
0–9 1 Asthma Dental caries
2 Refraction and accommodation disorders Refraction and accommodation disorders
3 Viral skin diseases Asthma
4 COPD Viral skin diseases
5 Dental caries COPD
10–19 1 Falls Low back pain
2 Low back pain COPD
3 COPD Major depressive disorders
4 Epilepsy Dental caries
5 Motorized vehicle with two wheels Epilepsy
20–29 1 Low back pain Low back pain
2 Motorized vehicle with three or more wheels Abortion
3 Falls Infertility
4 Schizophrenia Motorized vehicle with three or more wheels
5 Self-harm COPD
30–39 1 Diabetes mellitus Low back pain
2 Low back pain Abortion
3 Cirrhosis of the liver Infertility
4 Motorized vehicle with three or more wheels Diabetes mellitus
5 Falls COPD
40–49 1 Diabetes mellitus Low back pain
2 Low back pain Diabetes mellitus
3 Cirrhosis of the liver Osteoarthritis
4 Ischemic heart disease COPD
5 Falls Periodontal disease
50–59 1 Diabetes mellitus Low back pain
2 Low back pain Osteoarthritis
3 Ischemic heart disease Diabetes mellitus
4 Cirrhosis of the liver COPD
5 Ischemic stroke Ischemic stroke
60–69 1 Ischemic heart disease Osteoarthritis
2 Diabetes mellitus Diabetes mellitus
3 Low back pain Low back pain
4 Ischemic stroke Ischemic stroke
5 COPD Ischemic heart disease
70–79 1 Ischemic stroke Alzheimer's disease and other dementias
2 Ischemic heart disease Ischemic stroke
3 COPD Ischemic heart disease
4 Alzheimer's disease and other dementias Diabetes mellitus 5 Trachea, bronchus and lung cancers Osteoarthritis
≥ 80 1 Alzheimer's disease and other dementias Alzheimer's disease and other dementias
2 Ischemic stroke Ischemic stroke
3 Ischemic heart disease Ischemic heart disease
4 COPD Falls
5 Trachea, bronchus and lung cancers COPD DALY = disability-adjusted life year, COPD = chronic obstructive pulmonary disease.
A Communicable diseases
98.5 67.5
32.8 25.7 11.5 5.8 4.5 4.5 3.6 3.4 Tuberculosis Acute bronchitis etc.
HIV disease resulting in other specified or unspecified diseases Upper respiratory infections Giardiases etc.
Pneumococcal pneumonia Otitis media Encephalitis Influenza Meningococcal infection
20 40 60 80 100
0
B Neoplasms
350 316 301 290 203
192 106
78 69 64 Trachea, bronchus and lung cancers
Stomach cancer Colon and rectum cancers Liver cancer Breast cancer Thyroid cancer Pancreatic cancer Gallbladder and biliary tract cancer Prostate cancer Leukemia
100
50 150 200 250 300 350
0
D Injuries
850 599
499 210
168 166 119 83 65 48 Falls Motorized vehicle with three or more wheels Self-harm Overexertion and strenuous movements Mechanical forces (other) Pedestrian injury by road vehicle Motorized vehicle with two wheels Assault by bodily force Fire, heat and hot substances Pedal cycle vehicle
200
100 300 400 500 600 700 800 900
0
C Mental and behavioral diseases
561 433
340 131
106 97 53 37 21 20 Major depressive disorders
Schizophrenia Phobic anxiety disorders etc.
Bipolar affective disorder Panic disorder Alcohol use disorders Idiopathic intellctual disability Attention-deficit hyperactivity disorder Obsessive-compulsive disorder Dysthymia
200
100 300 400 500 600
0
YLL YLD
*Unit: DALYs, per 100,000
YLL YLD
*Unit: DALYs, per 100,000
YLL YLD
*Unit: DALYs, per 100,000
YLL YLD
*Unit: DALYs, per 100,000
Fig. 3. Top 10 leading specific causes (level 3 and 4) of DALYs by disease group in Korea. (A) Communicable diseases, (B) Neoplasms, (C) Mental and behavioral diseases, (D) Injuries.
DALY = disability-adjusted life year, YLLs = years of life lost, YLDs = years lived with disability.
In terms of the YLDs per 100,000 population, the YLDs per 100,000 population for low back pain was the highest at 2,671, followed by diabetes mellitus at 2,326, COPD at 1,280, osteoarthritis at 1,179, and ischemic stroke at 901. As for the YLLs per 100,000 population, the YLLs per 100,000 population due to self-harm was the highest at 464; followed by ischemic heart disease at 304; trachea, bronchus, and lung cancers at 252; hemorrhagic and other non-ischemic strokes at 223; and liver cancer at 218. Among the top 30 diseases with the highest DALYs per 100,000 population, the YLLs due to self-harm made up the largest proportion at 93%; followed by liver cancer at 75%; trachea, bronchus and lung cancers at 72%; and hemorrhagic and other non-ischemic strokes at 60%. Regarding other diseases, the ratio of YLDs was higher than that of YLLs (Fig. 2).
Trends and patterns of burden of disease and injuries, 2007–2015
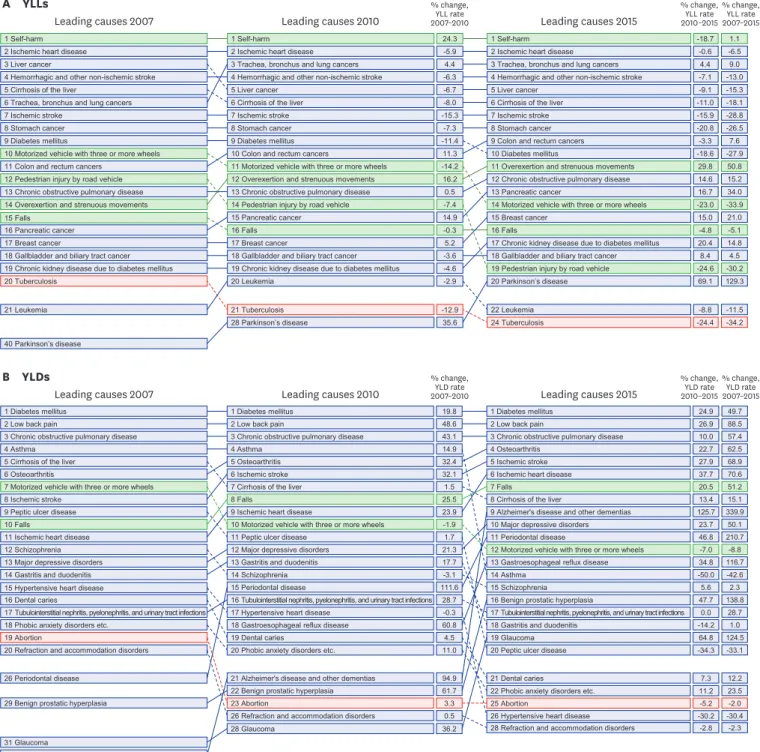
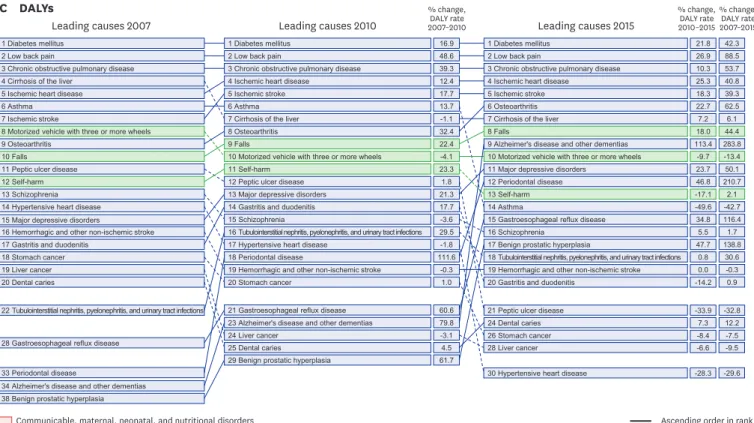
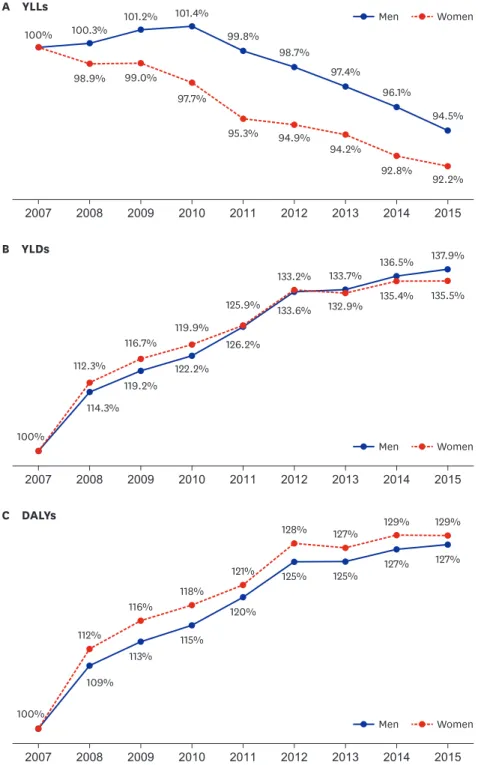
We looked into the trends of the YLLs per 100,000 population in Korea for the period of 2007 to 2015, and it was observed that it stayed at a certain level from 2007 to 2010 and then it showed a consistently decreasing trend from 2011. The YLLs per 100,000 population in 2015 decreased by approximately 6.5% compared to 2007. The YLLs per 100,000 population decreased both for men and women. In the case of men, the YLLs per 100,000 population decreased by 5.5% in 2015 compared to 2007, while it decreased by 7.8% in the case of women. Among the top 30 diseases with the highest YLLs per 100,000 population in 2015, injuries from motorized vehicles with three or more wheels decreased by 33.9%, showing the largest decrease, while pedestrian injuries caused by road vehicles fell by 30.2% and ischemic stroke by 28.8%. In contrast, Parkinson's disease increased by 129.3%, recording the largest increase, over-exertion and strenuous movements rose by 50.8% and pancreatic cancer by 34.0% (Fig. 4A).
We observed the trend of YLDs per 100,000 population in Korea for the period from 2007 to 2015, and it showed a consistently increasing trend from 2007 to 2015. The YLDs per 100,000 population increased by approximately 36.7% in 2015 compared to 2007. By gender, the YLDs per 100,000 population rose both for men and women. In the case of men, the YLDs per 100,000 population in 2015 increased by 37.9% compared to 2007, while it rose by 35.5% in the case of women. Among the top 30 diseases with the highest YLDs per 100,000 population in 2015, asthma fell by 42.6%, showing the largest decrease, peptic ulcer disease decreased by 33.1%, and injuries caused by motorized vehicles with three or more wheels by 8.8%. For all the other diseases, the YLDs per 100,000 population increased in 2015 compared to 2007.
Alzheimer's disease and other dementias showed the largest increase at 339.9%, periodontal disease rose by 210.7%, and benign prostatic hyperplasia by 138.8% (Fig. 4B).
From the analysis results of the changes in the Korean burden of disease for the period from 2007 to 2015, it was observed that both the crude DALYs and the DALYs per 100,000 population showed a consistently increasing trend from 2007 to 2015. Korea's population in 2015 had increased by approximately 3.7% compared to 2007, and for the same period, the crude DALYs increased by 32.8% and the DALYs per 100,000 population by 28.1%. By gender, the DALYs per 100,000 population as of 2015 rose by 27.4% for men and 28.8% for women compared to 2007, and they showed similar yearly trends (Fig. 5). Among the top 20 diseases in 2015, it was Alzheimer's disease and other dementias, which showed the largest increase as its DALYs per 100,000 population, increased by 283.8% compared to 2007. In the case of diabetes mellitus, which ranked high in 2015 in terms of burden of disease, the DALYs per 100,000 population in 2015 rose by 42.3% compared to 2007, while low back pain increased by 88.5%, COPD by 53.7%, and ischemic heart disease by 40.8%.
Among the top 20 diseases in terms of the DALYs per 100,000 population as of 2015, the DALYs per 100,000 population for asthma in 2015 fell by 42.7% compared to 2007, while injuries from motorized vehicles with three or more wheels decreased by 13.4% and hemorrhagic and other non-ischemic strokes by 0.3%. All the other top 17 diseases with the highest DALYs per 100,000 population as of 2015 also showed an increasing trend. The
12/19 https://jkms.org https://doi.org/10.3346/jkms.2019.34.e75
A YLLs % change,
YLL rate 2007–2010
% change, YLL rate 2010–2015
% change, YLL rate 2007–2015 1 Self-harm
2 Ischemic heart disease 3 Liver cancer
4 Hemorrhagic and other non-ischemic stroke 5 Cirrhosis of the liver
6 Trachea, bronchus and lung cancers 7 Ischemic stroke
8 Stomach cancer 9 Diabetes mellitus
10 Motorized vehicle with three or more wheels 11 Colon and rectum cancers
12 Pedestrian injury by road vehicle 13 Chronic obstructive pulmonary disease 14 Overexertion and strenuous movements 15 Falls
16 Pancreatic cancer 17 Breast cancer
18 Gallbladder and biliary tract cancer 19 Chronic kidney disease due to diabetes mellitus 20 Tuberculosis
Leading causes 2007
1 Self-harm 2 Ischemic heart disease 3 Trachea, bronchus and lung cancers 4 Hemorrhagic and other non-ischemic stroke 5 Liver cancer
6 Cirrhosis of the liver 7 Ischemic stroke 8 Stomach cancer 9 Diabetes mellitus
12 Overexertion and strenuous movements 13 Chronic obstructive pulmonary disease 14 Pedestrian injury by road vehicle 15 Pancreatic cancer 16 Falls 17 Breast cancer
18 Gallbladder and biliary tract cancer 19 Chronic kidney disease due to diabetes mellitus 20 Leukemia
24.3 -5.9 4.4 -6.3 -6.7 -8.0 -15.3 -7.3 -11.4
16.2 0.5 -7.4 14.9 -0.3 5.2 -3.6 -4.6 -2.9
Leading causes 2010
11 Motorized vehicle with three or more wheels -14.2
10 Colon and rectum cancers 11.3
1 Self-harm 2 Ischemic heart disease 3 Trachea, bronchus and lung cancers 4 Hemorrhagic and other non-ischemic stroke 5 Liver cancer
6 Cirrhosis of the liver 7 Ischemic stroke 8 Stomach cancer 9 Colon and rectum cancers
12 Chronic obstructive pulmonary disease 13 Pancreatic cancer
14 Motorized vehicle with three or more wheels 15 Breast cancer
16 Falls
17 Chronic kidney disease due to diabetes mellitus 18 Gallbladder and biliary tract cancer 19 Pedestrian injury by road vehicle 20 Parkinson’s disease
-18.7 -0.6 4.4 -7.1 -9.1 -11.0 -15.9 -20.8 -3.3
14.6 16.7 -23.0 15.0 -4.8 20.4 8.4 -24.6 69.1
Leading causes 2015
11 Overexertion and strenuous movements 29.8
10 Diabetes mellitus -18.6
21 Leukemia 21 Tuberculosis
40 Parkinson’s disease
28 Parkinson’s disease
22 Leukemia 24 Tuberculosis -12.9
35.6
-8.8 -24.4
1.1 -6.5 9.0 -13.0 -15.3 -18.1 -28.8 -26.5 7.6
15.2 34.0 -33.9 21.0 -5.1 14.8 4.5 -30.2 129.3 50.8 -27.9
-11.5 -34.2
B YLDs % change,
YLD rate 2007–2010
% change, YLD rate 2010–2015
% change, YLD rate 2007–2015 1 Diabetes mellitus
2 Low back pain
3 Chronic obstructive pulmonary disease 4 Asthma
5 Cirrhosis of the liver 6 Osteoarthritis
7 Motorized vehicle with three or more wheels 8 Ischemic stroke
9 Peptic ulcer disease 10 Falls
11 Ischemic heart disease 12 Schizophrenia 13 Major depressive disorders 14 Gastritis and duodenitis 15 Hypertensive heart disease 16 Dental caries
17 Tubulointerstitial nephritis, pyelonephritis, and urinary tract infections 18 Phobic anxiety disorders etc.
19 Abortion
20 Refraction and accommodation disorders
Leading causes 2007
1 Diabetes mellitus 2 Low back pain
3 Chronic obstructive pulmonary disease 4 Asthma
5 Osteoarthritis 6 Ischemic stroke 7 Cirrhosis of the liver 8 Falls
9 Ischemic heart disease
12 Major depressive disorders 13 Gastritis and duodenitis 14 Schizophrenia 15 Periodontal disease
16 Tubulointerstitial nephritis, pyelonephritis, and urinary tract infections 17 Hypertensive heart disease
18 Gastroesophageal reflux disease 19 Dental caries
20 Phobic anxiety disorders etc.
19.8 48.6 43.1 14.9 32.4 32.1 1.5 25.5 23.9
21.3 17.7 -3.1 111.6 28.7 -0.3 60.8 4.5 11.0
Leading causes 2010
11 Peptic ulcer disease 1.7
10 Motorized vehicle with three or more wheels -1.9
1 Diabetes mellitus 2 Low back pain
3 Chronic obstructive pulmonary disease 4 Osteoarthritis
5 Ischemic stroke 6 Ischemic heart disease 7 Falls
8 Cirrhosis of the liver
9 Alzheimer's disease and other dementias
12 Motorized vehicle with three or more wheels 13 Gastroesophageal reflux disease 14 Asthma
15 Schizophrenia 16 Benign prostatic hyperplasia
17 Tubulointerstitial nephritis, pyelonephritis, and urinary tract infections 18 Gastritis and duodenitis
19 Glaucoma 20 Peptic ulcer disease
24.9 26.9 10.0 22.7 27.9 37.7 20.5 13.4 125.7
-7.0 34.8 -50.0 5.6 47.7 0.0 -14.2 64.8 -34.3
Leading causes 2015
11 Periodontal disease 46.8
10 Major depressive disorders 23.7
26 Periodontal disease
23 Abortion
26 Refraction and accommodation disorders
21 Dental caries
22 Phobic anxiety disorders etc.
3.3 0.5
7.3 11.2
49.7 88.5 57.4 62.5 68.9 70.6 51.2 15.1 339.9
-8.8 116.7 -42.6 2.3 138.8
28.7 1.0 124.5 -33.1 210.7 50.1
12.2 23.5
25 Abortion -5.2 -2.0
26 Hypertensive heart disease -30.2 -30.4
28 Refraction and accommodation disorders -2.8 -2.3 21 Alzheimer's disease and other dementias 94.9
35 Alzheimer's disease and other dementias
22 Benign prostatic hyperplasia 61.7
29 Benign prostatic hyperplasia
28 Glaucoma 36.2
31 Glaucoma
C DALYs % change,
DALY rate 2007–2010
% change, DALY rate 2010–2015
% change, DALY rate 2007–2015 1 Diabetes mellitus
2 Low back pain
3 Chronic obstructive pulmonary disease 4 Cirrhosis of the liver
5 Ischemic heart disease 6 Asthma 7 Ischemic stroke
8 Motorized vehicle with three or more wheels 9 Osteoarthritis
10 Falls 11 Peptic ulcer disease 12 Self-harm 13 Schizophrenia 14 Hypertensive heart disease 15 Major depressive disorders
16 Hemorrhagic and other non-ischemic stroke 17 Gastritis and duodenitis
18 Stomach cancer 19 Liver cancer 20 Dental caries
Leading causes 2007
1 Diabetes mellitus 2 Low back pain
3 Chronic obstructive pulmonary disease 4 Ischemic heart disease
5 Ischemic stroke 6 Asthma 7 Cirrhosis of the liver 8 Osteoarthritis 9 Falls
12 Peptic ulcer disease 13 Major depressive disorders 14 Gastritis and duodenitis 15 Schizophrenia
16 Tubulointerstitial nephritis, pyelonephritis, and urinary tract infections 17 Hypertensive heart disease
18 Periodontal disease
19 Hemorrhagic and other non-ischemic stroke 20 Stomach cancer
16.9 48.6 39.3 12.4 17.7 13.7 -1.1 32.4 22.4
1.8 21.3 17.7 -3.6 29.5 -1.8 111.6 -0.3 1.0
Leading causes 2010
11 Self-harm 23.3
10 Motorized vehicle with three or more wheels -4.1
1 Diabetes mellitus 2 Low back pain
3 Chronic obstructive pulmonary disease 4 Ischemic heart disease
5 Ischemic stroke 6 Osteoarthritis 7 Cirrhosis of the liver 8 Falls
9 Alzheimer's disease and other dementias
12 Periodontal disease 13 Self-harm 14 Asthma
15 Gastroesophageal reflux disease 16 Schizophrenia
17 Benign prostatic hyperplasia
18 Tubulointerstitial nephritis, pyelonephritis, and urinary tract infections 19 Hemorrhagic and other non-ischemic stroke 20 Gastritis and duodenitis
21.8 26.9 10.3 25.3 18.3 22.7 7.2 18.0 113.4
46.8 -17.1 -49.6 34.8 5.5 47.7 0.8 0.0 -14.2
Leading causes 2015
11 Major depressive disorders 23.7
10 Motorized vehicle with three or more wheels -9.7
22 Tubulointerstitial nephritis, pyelonephritis, and urinary tract infections
25 Dental caries
21 Peptic ulcer disease
30 Hypertensive heart disease 4.5
-33.9
-28.3 42.3 88.5 53.7 40.8 39.3 62.5 6.1 44.4 283.8
210.7 2.1 -42.7 116.4 1.7 138.8
30.6 -0.3 0.9 50.1 -13.4
-32.8
-29.6 23 Alzheimer's disease and other dementias 79.8
24 Liver cancer -3.1
33 Periodontal disease
34 Alzheimer's disease and other dementias
24 Dental caries 7.3 12.2
21 Gastroesophageal reflux disease 60.6
28 Gastroesophageal reflux disease
38 Benign prostatic hyperplasia
29 Benign prostatic hyperplasia 61.7
26 Stomach cancer -8.4 -7.5
28 Liver cancer -6.6 -9.5
Ascending order in rank Communicable, maternal, neonatal, and nutritional disorders
Fig. 4. Top 20 leading specific causes (level 3 and 4) of YLLs due to premature mortality, YLDs, and DALYs for 2007, 2010, and 2015, with percentage change in DALYs (per 100,000). (A) YLLs due to premature mortality, (B) YLDs, (C) DALYs.
YLLs = years of life lost, YLDs = years lived with disability, DALY = disability-adjusted life year (continued to the next page)