Association between Objectively Measured Sleep Quality and Obesity in Community-dwelling Adults Aged 80 Years or Older:
A Cross-sectional Study
The purpose of this study was to examine the association between objective measures of sleep quality and obesity in older community-dwelling people. This cross-sectional study included 189 community-dwelling adults aged ≥ 80 yr (83.4 ± 2.5 yr [age range, 80-95 yr]). Participants wore an accelerometer (ActiGraph GT3X+) on their non-dominant wrist 24 hr per day for 7 consecutive nights. Sleep parameters measured included total sleep time, sleep efficiency, and wake after sleep onset (WASO) during the night. Associations between sleep parameters and obesity were investigated by using multivariate logistic regression analysis. In multivariate models, those with sleep efficiency lower than 85% had a 2.85-fold increased odds of obesity, compared with those with sleep efficiency of 85%
or higher. Similarly, those with WASO of ≥ 60 min (compared with < 60 min) had a 3.13-fold increased odds of obesity. However, there were no significant associations between total sleep time or self-reported napping duration and obesity. We found that poor sleep quality was an independent risk factor for obesity in community-dwelling Japanese adults aged ≥ 80 yr, even after controlling for potential confounding factors, including daily physical activity.
Keywords: Sleep Quality; Motor Activity; Obesity; Aged, 80 and over; Accelerometer Miji Kim
Research Team for Promoting Independence of the Elderly, Tokyo Metropolitan Geriatric Hospital and Institute of Gerontology, Tokyo, Japan
Received: 1 July, 2014 Accepted: 17 September 2014 Address for Correspondence:
Miji Kim, PhD
Tokyo Metropolitan Institute of Gerontology, Research Team for Promoting Independence of the Elderly, 35-2 Sakae-cho, Itabashi-ku, Tokyo 173-0015, Japan
Tel: +81.3-3964-3241, Fax: +81.3-3964-2316, E-mail: [email protected]
Funding: This work was supported by a Grant-in-Aid for Young Scientists ([B] No. 23700820 and No. 26750349) awarded to Miji Kim by the Japan Society for the Promotion of Science.
http://dx.doi.org/10.3346/jkms.2015.30.2.199 • J Korean Med Sci 2015; 30: 199-206
INTRODUCTION
The prevalence of obesity is increasing in all age groups, includ- ing older persons (1). Along with an increased risk of cardiovas- cular disease, diabetes, and several cancers, obesity is associat- ed with an increased risk of physical and cognitive disability (2, 3). In older people, obesity contributes to early onset of func- tional impairment. Al Snih et al. (4) found that the relationship between body mass index (BMI) and subsequent activities of daily living was curvilinear. The most favorable hazard ratio for disability-free life expectancy was among participants with a BMI between 25.0 and 29.9 kg/m2. Therefore, identification of potentially modifiable factors associated with obesity develop- ment is important in order to prevent disability in older adults.
A decrease in sleep duration and quality are associated with adverse health outcomes. Sleep issues and disruptions in sleep patterns, relatively common in the older population, frequently manifest themselves in decreased total sleep time and sleep ef- ficiency, and increased wake after sleep onset (WASO) (5). A good night’s sleep is dependent on a sufficient amount of deep sleep and sleep efficiency, i.e. total sleep time divided by time in bed, of ≥ 85% (6). Furthermore, the quality of sleep declines with age, with a major reduction in the duration of slow wave
sleep and increased sleep fragmentation (7). Adequate sleep quality and quantity are important for the normal functioning of daily metabolic and hormonal processes, and appetite regu- lation (8). These factors may contribute to energy dysregulation that leads to weight gain and obesity. Several epidemiological studies have evaluated the association between sleep duration and obesity (9, 10). It has been suggested that sleep duration is a cause of, or a solution to the obesity. However, the importance of other aspects of sleep quality, such as sleep efficiency and wake after sleep onset, remain relatively unexplored in older adults.
In recent years, a few studies have shown an association be- tween specific sleep quality and overweight/obesity, or its proxy measure of high BMI (11-13). It is associated with several po- tentially modifiable lifestyle factors, such as smoking, alcohol consumption, and physical inactivity. However, these studies have primarily utilized self-reported measures of sleep. Van Den Berg et al. (14) reported that objective and subjective measures frequently do not match in a large sample of normal, healthy older adults. In addition, there is a need to objectively assess the measured daily physical activity. Despite currently being the fastest growing segment of Japan’s population, information on sleep and obesity in this age group is limited. Hence, this Rehabilitation & Sports Medicine
study aimed to examine the association between objective mea- sures of sleep quality and obesity in community-dwelling Japa- nese adults aged ≥ 80 yr. In this study, we used wrist actigraphy, which is relatively unobtrusive and enabled the participants to remain in their natural environment and adhere to their nor- mal sleep and physical activity habits. It was hypothesized that sleep quality would be associated with obesity, after adjustment for potentially confounding factors, including objectively mea- sured daily physical activity.
MATERIALS AND METHODS Participants
Subjects were recruited from among the participants of a com- prehensive health survey conducted in 2012 by the Tokyo Met- ropolitan Institute of Gerontology (TMIG) on community-dwell- ing adults aged ≥ 80 yr, in the area of Itabashi ward in metro- politan Tokyo. A total of 1,049 people participated in the follow- up survey in 2 cohorts (15, 16). The recruitment brochure was mailed to 396 individuals who were randomly selected to par- ticipate in this study (183 men and 213 women). The exclusion criteria were as follows: having depressive symptoms (Mini-In- ternational Neuropsychiatric Interview and Self-Rating Depres- sion Scale score of > 50), or having a sleep disorder (self-report- ed potential symptoms of insomnia or apnea, and current use of sleep or psychotropic medications). In all, we received 250 responses to mailed invitation letters from potential participants.
There were complete data on body composition and objectively measured sleep quality (from February to April 2013) for 217 of the 226 respondents who agreed to participate in our study. Of these, 25 individuals had a BMI < 18.5 kg/m2. Three participants with fewer than 5 days of valid data were excluded. Thus, our sample comprised 189 participants (88 men and 101 women).
Measurement of anthropometric and body compositions Height and body weight were measured to the nearest 0.1 cm or 0.1 kg, respectively, with subjects wearing light garments. BMI was computed as weight divided by height squared (kg/m2).
We defined obesity as a BMI of ≥ 25 kg/m2 (17, 18). The body composition was measured by using segmental multi-frequen- cy bioelectrical impedance analysis (SMF-BIA; InBody 720, Bio- space Co. Ltd, Seoul, Korea). In accordance with the manufac- turer’s guidelines, subjects wiped the bottom of their feet with a proprietary electrolyte tissue before standing on the electrodes embedded in the scale platform of the analyzer. The subjects were instructed to stand upright and to grasp the handles of the analyzer, thereby providing contact with a total of 8 electrodes (2 for each foot and hand). In our prior work, the within-day coefficient variances for 6 different frequencies evaluated in 9 subjects were 0%-1.9% (19). Percentage body fat and appendic- ular lean mass (ALM) were also ascertained with the SMF-BIA.
ALM was calculated as the sum of the lean mass of both the right and left arms and legs, with the assumption that all non-fat and non-bone tissue was skeletal muscle. We used ALM divided by height (ALM/Ht2) and ALM divided by BMI (ALM/BMI) in our subsequent analysis.
Assessment of sleep and physical activity
Sleep and physical activity were assessed by using a triaxial ac- celerometer (GT3X+, ActiGraph, LLC, Pensacola, FL, USA), a small (4.6 × 3.3 × 1.5 cm, 19 g) easy-to-wear device that yields valid estimates of physical activity in controlled and free-living environments (20, 21). It also offers the possibility of recording and scoring sleep/wake patterns during the night (22). The abil- ity to collect valid data on all 3 behaviors contemporaneously by using a single accelerometer is important because it may im- prove our understanding of behavioral inter-relationships and reduce the burden on subjects. Participants wore an acceler- ometer on their non-dominant wrist 24 hr per day over 8 con- secutive days (7 nights), except when bathing or involved in water activities. They also recorded the times they went to bed each night, woke up each morning, and removed the device ev- ery day.
Data were processed by using the ActiLife Version 6.9.2 soft- ware (Pensacola, FL, USA), which provides the following 2 dif- ferent algorithms for sleep scoring: the Sadeh algorithm (23) and Cole-Kripke algorithm (24). We used the latter algorithm, previously validated in a sample of older adults. The ActiLife device was initialized to collect data, and it automatically scored sleep in 60-s epochs at 80 Hz. The following variables were ana- lyzed: total sleep time (minutes slept between bedtime and wake time), total counts, sleep efficiency (percentage of time asleep while in bed), WASO (minutes awake between sleep onset and wake time), and number of awakenings. For physical activity, non-wear time was determined by using a modified Choi algo- rithm (25). In this algorithm, 90 consecutive minutes of zero counts with a 2-min spike tolerance constituted non-wear, if zero counts are detected during both the 30 min upstream and downstream from that interval. Since the cut-off for wrist-worn ActiGraphs in older adults has not been established, we used the mean count per minute of vector magnitude (daily total counts divided by valid wear-time) as an index of physical activity.
Other measures
To obtain demographic information, participants were inter- viewed about their age, education, living conditions, smoking and drinking habits, comorbidities, and health-related infor- mation. The sum of 11 self-reported, physically diagnosed chron- ic diseases (hypertension, stroke, diabetes mellitus, hyperlipid- emia, angina, myocardial infarction, arrhythmia, osteoporosis, hip fracture, and anemia) was calculated from individual dis- ease-based questions. Cognitive function was assessed with the
Mini Mental State Examination (MMSE). MMSE scores range from 0 to 30, with higher scores indicating better cognitive per- formance. Instrumental activities of daily living were measured with a 5-item instrumental self-maintenance subscale from the TMIG-Index of Competence (TMIG-IC). Napping was assessed via a standardized interview. Participants were asked, “During the past month, how many hours did you nap during a typical day?” Those who responded that involuntary urine leakage epi- sodes occurred more than once per week were defined as hav- ing urinary incontinence. Two items from the Center for Epide- miologic Studies Depression scale were used to assess exhaus- tion: 1) “I felt that everything I did was an effort” and 2) “I could not get going.” The subjects were asked, “How often in the last week did you feel this way?”, and the response options were as follows: 0 = “rarely or none of the time (< 1 day)”, 1 = “some or little of the time (1-2 days)”, 2 = “a moderate amount of the time (3-4 days)”, or 3 = “most of the time (5-7 days)”. Subjects who answered one or more for either of these questions were classi- fied as positive for exhaustion.
Statistical analysis
The study population characteristics were analyzed by using descriptive statistics, including mean ± standard deviation (SD), and frequency. Differences in clinical characteristics, sleep pa- rameters, and physical activity between normal weight and obese subjects were tested via independent t-tests and chi-square tests.
The associations between BMI and quality of sleep were evalu- ated by using Pearson’s correlation coefficients. Sleep parame- ters were categorized as total sleep time (< 6, 6-8, and ≥ 8 hr),
sleep efficiency (< 85% and ≥ 85%), WASO (≥ 60 min and < 60 min), and napping duration (≥ 60 min and < 60 min) (5, 26, 27). Logistic regression was used to assess the association be- tween sleep parameters and the risk of obesity, and results are presented as odds ratios (OR) with 95% confidence intervals (CI). Model 1 was adjusted for age. Model 2 was adjusted for age, sex. Model 3 was adjusted for age, sex, education, living alone, smoking, drinking, exhaustion, number of diseases, cog- nitive function (MMSE score), disability, and daily physical ac- tivity. In addition, after adjustments for age and sex, the associ- ations between indicators of body composition, physical activi- ty, and quality of sleep were evaluated using Spearman’s rank correlation coefficients. Statistical analyses were performed by using the IBM SPSS Statistics 20 package. All P values were 2-tail- ed, with values < 0.05 considered statistically significant.
Ethics statement
Before tests were conducted, subjects were assured of their an- onymity in the management of study data and reporting of re- sults. They read and signed the informed consent forms, which were approved by the relevant institutional review board. The Clinical Research Ethics Committee of the TMIG approved the study protocol (No. 033).
RESULTS
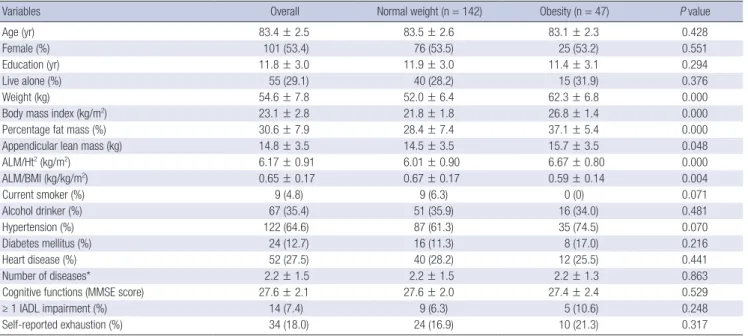
The clinical characteristics of the study population are shown in Table 1. A total of 47 subjects (24.9%) had a BMI of ≥ 25 kg/
m2, and they were thus classified as obese. The average BMI of
Table 1. Clinical characteristics of the study population
Variables Overall Normal weight (n = 142) Obesity (n = 47) P value
Age (yr) 83.4 ± 2.5 83.5 ± 2.6 83.1 ± 2.3 0.428
Female (%) 101 (53.4) 76 (53.5) 25 (53.2) 0.551
Education (yr) 11.8 ± 3.0 11.9 ± 3.0 11.4 ± 3.1 0.294
Live alone (%) 55 (29.1) 40 (28.2) 15 (31.9) 0.376
Weight (kg) 54.6 ± 7.8 52.0 ± 6.4 62.3 ± 6.8 0.000
Body mass index (kg/m2) 23.1 ± 2.8 21.8 ± 1.8 26.8 ± 1.4 0.000
Percentage fat mass (%) 30.6 ± 7.9 28.4 ± 7.4 37.1 ± 5.4 0.000
Appendicular lean mass (kg) 14.8 ± 3.5 14.5 ± 3.5 15.7 ± 3.5 0.048
ALM/Ht2 (kg/m2) 6.17 ± 0.91 6.01 ± 0.90 6.67 ± 0.80 0.000
ALM/BMI (kg/kg/m2) 0.65 ± 0.17 0.67 ± 0.17 0.59 ± 0.14 0.004
Current smoker (%) 9 (4.8) 9 (6.3) 0 (0) 0.071
Alcohol drinker (%) 67 (35.4) 51 (35.9) 16 (34.0) 0.481
Hypertension (%) 122 (64.6) 87 (61.3) 35 (74.5) 0.070
Diabetes mellitus (%) 24 (12.7) 16 (11.3) 8 (17.0) 0.216
Heart disease (%) 52 (27.5) 40 (28.2) 12 (25.5) 0.441
Number of diseases* 2.2 ± 1.5 2.2 ± 1.5 2.2 ± 1.3 0.863
Cognitive functions (MMSE score) 27.6 ± 2.1 27.6 ± 2.0 27.4 ± 2.4 0.529
≥ 1 IADL impairment (%) 14 (7.4) 9 (6.3) 5 (10.6) 0.248
Self-reported exhaustion (%) 34 (18.0) 24 (16.9) 10 (21.3) 0.317
Values are mean ± SD or n (%) of participants. *The sum of 11 self-reported, physically diagnosed chronic diseases (hypertension, stroke, diabetes mellitus, hyperlipidemia, angina, myocardial infarction, arrhythmia, osteoporosis, hip fracture, and anemia) was calculated from individual-disease questions. P values were based on the chi-square and t-tests. SD, standard deviation; ALM, appendicular lean mass; Ht, height; BMI, body mass index; MMSE, Mini Mental State Examination; IADL, Instrumental activities of daily living.
our study population was 23.1 kg/m2. Mean age was 83.4 ± 2.5 yr (range 80-95), and 53.4% were women. There were no signifi- cant differences in age and education between the 2 groups.
Subjects with obesity had significantly higher percentage fat mass, ALM, and ALM/Ht2 than normal weight subjects. How- ever, ALM/BMI was significantly lower in those with obesity than in those with normal weight. The number of diseases re- ported was not significantly different between the 2 groups. Sub- jects with obesity had a higher tendency prevalence of hyper- tension compared with normal weight subjects.
Table 2 shows a comparison of sleep parameters and physi- cal activity between the 2 groups. Accelerometer data were col- lected for an average of 6.4 ± 0.6 nights. With regard to total sleep time, 25.9% of the subjects had < 6 hr a night, and 10.1% had
> 8 hr a night. There was no significant difference in total sleep
time between the 2 groups. Subjects with obesity had higher average total counts in bedtime than the subjects with normal weight. Those with obesity had longer WASO and lower sleep efficiency than those with normal weight. In addition, sleep quality, such as lower sleep efficiency (< 85%) and more noc- turnal awakenings (WASO ≥ 60 min), were significant differ- ence between the 2 groups. Average nap duration for those who napped was 52.5 ± 29.9 min. There was no significant difference in average nap duration between the 2 groups. The overall phys- ical activity was 1,744.2 ± 489.2 counts per minute per day. The correlations between BMI and sleep quality are shown in Fig. 1.
Sleep efficiency showed a significant negative correlation with BMI. In contrast, WASO had a significant positive correlation with BMI. In addition, total counts in bedtime and daily physi- cal activity correlated slightly with BMI (r = 0.127, P = 0.083, and Body mass index (kg/m2)
Sleep efficiency (%)
70 80 90 100 32
30 28 26 24 22 20 18 16
r = -0.178 P = 0.015 Men
Women
Body mass index (kg/m2)
Wake after sleep onset (min)
0 20 40 60 80 100 120 140 160 32
30 28 26 24 22 20 18 16
r = 0.186 P = 0.011 Men
Women
A B
Fig. 1. The association between the body mass index and (A) sleep efficiency and (B) wake time after sleep onset in men and women.
Table 2. Characteristics of sleep parameters and physical activity
Variables Overall Normal weight (n = 142) Obesity (n = 47) P value
Number of nights of actigraphy 6.4 ± 0.6 6.5 ± 0.6 6.3 ± 0.8 0.172
In bed time (hours: min) 22:44 ± 2:33 22:51 ± 2:14 22:24 ± 3:21 0.304
Out bed time (hours: min) 6:28 ± 1:00 6:27 ± 0:59 6:30 ± 1:03 0.788
Total sleep time (min) < 6 hr
6-8 hr > 8 hr
403.5 ± 64.6 49 (25.9) 121 (64.0) 19 (10.1)
403.8 ± 63.1 33 (23.2) 96 (67.6) 13 (6.9)
402.6 ± 69.6 16 (34.0) 25 (53.2) 6 (12.8)
0.910 0.210
Total counts (counts/night) 33,645.9 ± 19,961.6 31,747.7 ± 17,586.0 39,380.9 ± 25,215.1 0.023
Wake after sleep onset (min) 43.3 ± 23.7 40.5 ± 18.7 51.7 ± 33.6 0.005
Wake after sleep onset ≥ 60 min (%) 36 (19.0) 22 (15.5) 14 (29.8) 0.029
Number of awakenings (No./night) 11.4 ± 4.9 11.2 ± 4.3 12.2 ± 6.4 0.219
Sleep efficiency (%) 89.9 ± 5.2 90.5 ± 4.3 88.3 ± 6.9 0.014
Sleep efficiency < 85% (%) 27 (14.3) 16 (11.3) 11 (23.4) 0.038
Self-reported naps (%) 85 (45.0) 62 (43.7) 23 (48.9) 0.322
Self-reported nap duration (min)* 52.5 ± 29.9 49.0 ± 28.1 61.3 ± 33.2 0.100
Napping duration ≥ 60 min (%) 42 (22.2) 28 (19.7) 14 (29.8) 0.110
Valid wear time (min/day) 1,417.2 ± 33.9 1,417.6 ± 30.9 1,415.9 ± 41.8 0.768
Physical activity (counts/min/day) 1,744.2 ± 489.2 1,775.4 ± 503.2 1,650.1 ± 435.7 0.129
Values are mean ± SD of participants. P values were based on the chi-square and t-tests. *Nap duration for nappers (n = 85). SD, standard deviation.
r = -0.129, P = 0.077, respectively). However, there was no asso- ciation between total sleep time and BMI (data not shown).
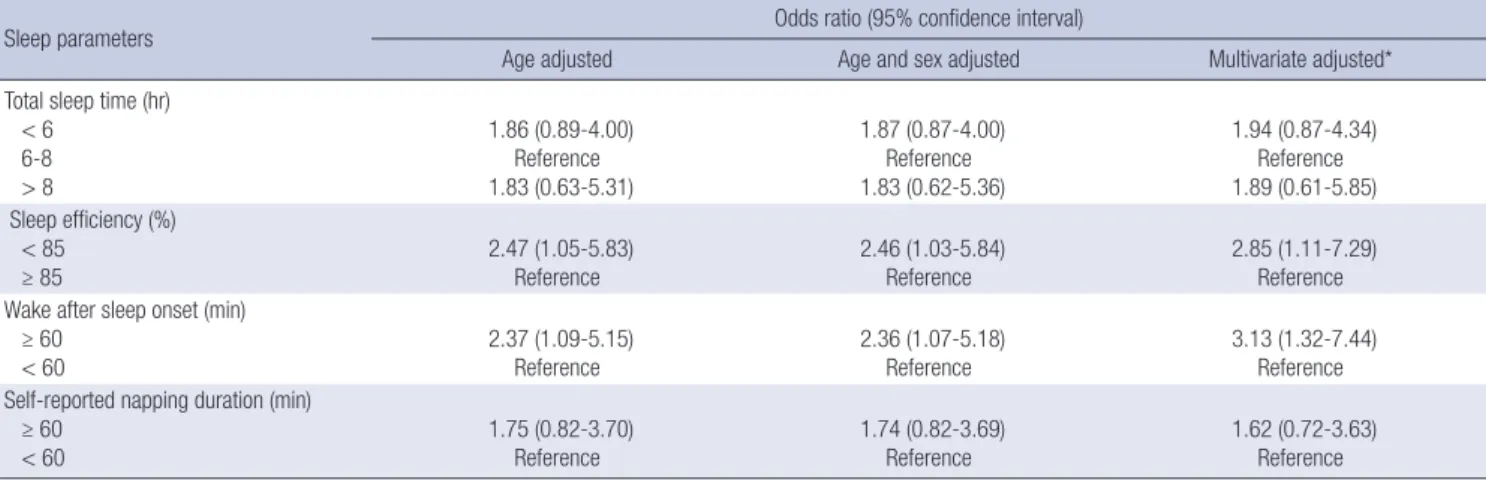
Associations between sleep parameters and obesity are shown in Table 3. Sleep quality, including poor sleep efficiency and greater WASO, were associated with an increased risk of obesity in the models adjusted for age, age and sex, and in multivariate models. In multivariate models, those with a sleep efficiency
< 85% had a 2.85-fold increased odds of obesity, compared with those with a sleep efficiency of ≥ 85%. Similarly, those with a WASO of ≥ 60 min had a 3.13-fold increased odds of obesity, compared with those with a WASO of < 60 min. However, there were no significant associations between total sleep time and self-reported napping duration.
Our subsequent analysis, after adjusting for age and sex, found partial correlation coefficients among indicators of body com- position, sleep, and physical activity, as presented in Table 4.
Sleep quality was significantly associated with percentage fat mass and ALM/BMI, with the exception of ALM/ht2. There were no association between total sleep time and indicators of body composition. Daily physical activity significantly correlated with percentage fat mass. However, daily physical activity was not associated with indicators of ALM.
DISCUSSION
To the best of my knowledge, this is the first study carried out on the association between objective measures of sleep quality
and obesity in community-dwelling Japanese adults aged 80 yr or older. The present study supported the hypothesis that both lower sleep efficiency and greater WASO (i.e. poor sleep quali- ty) were independently associated with a higher risk of obesity in the oldest old. These associations remained after adjustment for potentially confounding factors, including daily physical ac- tivity. In addition, we did not find any associations between sleep duration and obesity in our study population. The find- ings suggest that sleep quality might be a more important mod- ifiable factor than sleep duration in the development of obesity in the oldest old.
Previous meta-analysis studies have showed that short sleep duration is associated with an increased risk of obesity (9, 10).
However, Nielsen et al. concluded that while short sleep dura- tion is consistently associated with development of obesity in children and young adults, the findings were less consistent in older adults (10). Furthermore, data from the National Health and Nutrition Examination Survey suggested that although obe- sity was associated with reduced self-reported sleep durations in younger adults, no relationship existed in those over 50 yr of age (28). In both the Osteoporotic Fractures in Men Study and the Study of Osteoporotic Fractures cohorts, Patel et al. (29) found that older men and women with reduced amounts of sleep as measured by using wrist actigraphy, had an elevated BMI. These results showed that nightly sleep duration of less than 5 hr, com- pared to an average of 7-8 hr, was associated with a BMI that was, on average, 2.5 kg/m2 greater in men, and 1.8 kg/m2 great- Table 3. Association of sleep parameters and obesity
Sleep parameters Odds ratio (95% confidence interval)
Age adjusted Age and sex adjusted Multivariate adjusted*
Total sleep time (hr) < 6
6-8 > 8
1.86 (0.89-4.00) Reference 1.83 (0.63-5.31)
1.87 (0.87-4.00) Reference 1.83 (0.62-5.36)
1.94 (0.87-4.34) Reference 1.89 (0.61-5.85) Sleep efficiency (%)
< 85 ≥ 85
2.47 (1.05-5.83) Reference
2.46 (1.03-5.84) Reference
2.85 (1.11-7.29) Reference Wake after sleep onset (min)
≥ 60 < 60
2.37 (1.09-5.15) Reference
2.36 (1.07-5.18) Reference
3.13 (1.32-7.44) Reference Self-reported napping duration (min)
≥ 60 < 60
1.75 (0.82-3.70) Reference
1.74 (0.82-3.69) Reference
1.62 (0.72-3.63) Reference
*Adjusted for age, sex, education, live alone, smoking, drinking, exhaustion, number of diseases, cognitive function, disability, and physical activity.
Table 4. Age-and sex-adjusted Spearman partial correlation coefficients between indicators of body composition, sleep, and physical activity
Variables Percentage fat mass (%) ALM/Ht2 (kg/m2) ALM/BMI (kg/kg/m2)
rs P value rs P value rs P value
Total sleep time (min) 0.021 0.771 -0.123 0.093 0.017 0.818
Wake after sleep onset (min) 0.198 0.007 -0.012 0.875 -0.184 0.012
Sleep efficiency (%) -0.150 0.041 -0.026 0.722 0.164 0.025
Physical activity (counts/min/day) -0.226 0.002 -0.091 0.216 0.040 0.584
rs, Spearman’s rank correlation coefficient. ALM, appendicular lean mass; Ht, height; BMI, body mass index.
er in women, after adjusting for multiple risk factors and medi- cal conditions. Similarly, Van den Berg et al. reported a marked U-shaped association of actigraphic measures of sleep duration with BMI and obesity in a cross-sectional study of 983 elderly community-dwelling Dutch people, i.e. an increased risk of obe- sity for both long and short sleepers when measured objectively (30). Validation studies of self-reported sleep show evidence of systematic bias as responses often lead to overestimation of the amount of sleep compared to the measurement made by using actigraphy (31). Thus, short as well as long sleep by objectively measuring sleep durations increases the risk of a high BMI in older adults. However, the present study did not find any asso- ciation between sleep duration (< 6 hr and > 8 hr) and being obesity. Also, a subanalysis of our study showed that no associ- ation between categories of sleep duration (< 5 hr and ≥ 8 hr) and obesity. The differences in our findings are most likely at- tributable to the age group studied or other factors. A close as- sociation between sleep duration and BMI in the oldest old may be different from that in the general older population. Further studies are needed to investigate the possible gender and age effects on the relationship between objectively measured sleep durations and BMI in older adults.
Our findings suggest that poor quality of sleep was indepen- dently associated with a higher risk of obesity in the oldest old.
This study is one of the first to analyze the association between sleep quality and BMI by using wrist actigraphy in order to ob- jectively measure sleep parameters of adults aged 80 yr or older in an uncontrolled environment. Our study found that poor sleep efficiency and greater wake time after sleep onset were associated with an increased risk of obesity. These associations remained, even after adjustment for potentially confounding factors, including daily physical activity. Our findings stand in contrast to a previous study on the association between sleep quality and BMI in the oldest old. Yan et al. (32) observed the association between sleep quality and BMI in 870 elderly Chi- nese community dwellers (> 90 yr). They found that the differ- ence in BMI between subjects with good and poor sleep quality was not significant in their cohort. However, their study used subjective sleep parameter reporting, the Pittsburgh Sleep Qual- ity Index (PSQI). A validation study carried out on 956 commu- nity-dwelling elderly persons (aged 59 to 97 yr) reported sex differences in self-reported (PSQI) and actigraphic sleep pa- rameters (33). This study found that women reported shorter total sleep time, lower sleep efficiency, and worse global sleep quality, compared to men. However, when assessed with actig- raphy, women had a longer sleep time and higher sleep effi- ciency than men, revealing a bias by using the PSQI in elderly women. Similarly, Unruh et al. (34) found that older people (≥ 80 yr) were significantly less likely to report feeling unrested, overly sleepy, or to report not having enough sleep, as compar- ed to polysomnography. These findings also showed that trends
in sleep time, sleep efficiency, and sleep stages continue in peo- ple aged 80 yr and older, and changes can be described specifi- cally according to decades of age.
Poor sleep quality has been considered a potential predictor of obesity in older adults in published literature, and our study extends this research into sleep and obesity. Adequate sleep quality and quantity are important for the normal functioning of daily metabolic and hormonal processes, and appetite regu- lation (8). The mechanisms underlying the relationship between sleep quality and obesity are unclear. The central mechanism linking short sleep and risk of obesity proposed by Knutson et al. (35) is based on the theory that sleep deprivation leads to al- tered glucose metabolism, possibly lower energy expenditure, and to lower circulating levels of leptin and higher levels of ghre- lin. We found that those with a WASO of > 60 min had a 3.13- fold increased odds of being obesity. Similarly, Van den Berg et al. (30) observed that a highly fragmented sleep (poor sleep qual- ity) is associated with a higher BMI and a higher risk of obesity.
Sleep fragmentation led to an increase in morning cortisol lev- els and a shift in sympathovagal balance toward an increase in sympathetic nervous system activity without a change in sys- temic inflammation markers or serum adipokines, while main- taining normal sleep duration (36). This represents an interme- diate mechanism linking sleep fragmentation and glucose me- tabolism. Thus, their findings support the hypothesis that in- creases in sympathetic nervous system and adrenocortical ac- tivity are likely to mediate the adverse metabolic effects of poor sleep quality, independent of sleep duration. Taken together, frequent arousals during sleep may possibly diminish the regu- lation of glucose metabolism. Further research to understand the biological mechanisms involved is needed to better assess the potential for interventions targeting sleep quality as a means of combating obesity in older adults.
The findings of the present study should be considered in re- lation to several limitations. First, study participants were gen- erally healthy older adults who had no depressive symptoms or sleep disorders, and had to be mobile enough to commute to the study center. Therefore, the generalizability of the findings to other populations of older adults may be limited to a rela- tively small number of subjects. In addition, wrist actigraphy does not perfectly measure sleep parameters, when compared with the gold standard of polysomnography. However, a single- night polysomnography may not provide representative data on general sleep quality. ActiGraph, which estimates sleep based on arm movement by using multidirectional accelerometers that measure activity counts per epoch, is considered non-in- vasive and easy to use. It can also be worn for many days, and is not thought to alter sleep as no “first-night effects” are seen (37).
Finally, the cross-sectional study design precludes the estab- lishment of causal relationship between different weight sta- tuses and sleep quality.
In conclusion, poor sleep quality was independently associ- ated with a higher risk of obesity in community-dwelling Japa- nese adults aged 80 yr or older, even after controlling for poten- tially confounding factors, including daily physical activity. The findings suggest that in the oldest sleep quality might be a more important modifiable factor associated with the development of obesity than sleep duration. In addition, improvements in sleep habits should be included as a part of interventions to pre- vent obesity in older individuals. Further studies are needed to identify a cause-and-effect relationship between poor sleep qual- ity and obesity, as well as to determine interventions for target- ing sleep quality as a means to combat obesity in older adults.
DISCLOSURE
The author have no conflicts of interest to disclose.
AUTHOR CONTRIBUTION
Study concept and design: MK. Acquisition of data: MK. Analy- ses and interpretation of the data: MK. Drafting of the manu- script: MK. Critical revision of the manuscript for important in- tellectual content: MK.
ORCID
Miji Kim http://orcid.org/0000-0002-0852-8825 REFERENCES
1. Villareal DT, Apovian CM, Kushner RF, Klein S. Obesity in older adults:
technical review and position statement of the American Society for Nu- trition and NAASO, The Obesity Society. Obes Res 2005; 13: 1849-63.
2. Houston DK, Nicklas BJ, Zizza CA. Weighty concerns: the growing prev- alence of obesity among older adults. J Am Diet Assoc 2009; 109: 1886-95.
3. Kim JH, Choi SH, Lim S, Yoon JW, Kang SM, Kim KW, Lim JY, Cho NH, Jang HC. Sarcopenia and obesity: gender-different relationship with func- tional limitation in older persons. J Korean Med Sci 2013; 28: 1041-7.
4. Al Snih S, Ottenbacher KJ, Markides KS, Kuo YF, Eschbach K, Goodwin JS. The effect of obesity on disability vs mortality in older Americans. Arch Intern Med 2007; 167: 774-80.
5. Ohayon MM, Carskadon MA, Guilleminault C, Vitiello MV. Meta-anal- ysis of quantitative sleep parameters from childhood to old age in healthy individuals: developing normative sleep values across the human lifes- pan. Sleep 2004; 27: 1255-73.
6. Akerstedt T, Hume K, Minors D, Waterhouse J. The subjective meaning of good sleep, an intraindividual approach using the Karolinska Sleep Diary. Percept Mot Skills 1994; 79: 287-96.
7. Van Cauter E, Leproult R, Plat L. Age-related changes in slow wave sleep and REM sleep and relationship with growth hormone and cortisol lev- els in healthy men. JAMA 2000; 284: 861-8.
8. Van Cauter E, Spiegel K, Tasali E, Leproult R. Metabolic consequences of
sleep and sleep loss. Sleep Med 2008; 9: S23-8.
9. Marshall NS, Glozier N, Grunstein RR. Is sleep duration related to obesi- ty? A critical review of the epidemiological evidence. Sleep Med Rev 2008;
12: 289-98.
10. Nielsen LS, Danielsen KV, Sørensen TI. Short sleep duration as a possi- ble cause of obesity: critical analysis of the epidemiological evidence. Obes Rev 2011; 12: 78-92.
11. Jennings JR, Muldoon MF, Hall M, Buysse DJ, Manuck SB. Self-reported sleep quality is associated with the metabolic syndrome. Sleep 2007; 30:
219-23.
12. Hung HC, Yang YC, Ou HY, Wu JS, Lu FH, Chang CJ. The association be- tween self-reported sleep quality and overweight in a Chinese popula- tion. Obesity (Silver Spring) 2013; 21: 486-92.
13. Fogelholm M, Kronholm E, Kukkonen-Harjula K, Partonen T, Partinen M, Härmä M. Sleep-related disturbances and physical inactivity are in- dependently associated with obesity in adults. Int J Obes (Lond) 2007;
31: 1713-21.
14. Van Den Berg JF, Van Rooij FJ, Vos H, Tulen JH, Hofman A, Miedema HM, Neven AK, Tiemeier H. Disagreement between subjective and acti- graphic measures of sleep duration in a population-based study of elder- ly persons. J Sleep Res 2008; 17: 295-302.
15. Kim HK, Suzuki T, Saito K, Yoshida H, Kobayashi H, Kato H, Katayama M. Effects of exercise and amino acid supplementation on body compo- sition and physical function in community-dwelling elderly Japanese sarcopenic women: a randomized controlled trial. J Am Geriatr Soc 2012;
60: 16-23.
16. Kojima N, Kim H, Saito K, Yoshida H, Yoshida Y, Hirano H, Obuchi S, Shimada H, Suzuki T. Association of knee-extension strength with instru- mental activities of daily living in community-dwelling older adults. Geri- atr Gerontol Int 2014; 14: 674-80.
17. Bassett J, International Diabetes Institute, World Health Organization, Regional Office for the Western Pacific, International Association for the Study of Obesity, International Obesity Task Force. The Asia-Pacific perspective : redefining obesity and its treatment. Australia: Health Com- munications Australia, 2000.
18. Matsuzawa Y, Inoue S, Ikeda Y, Sakata T, Saito Y, Satou U, Shirai K, Ohno M, Miyazaki S, Tokunaga K, et al. New diagnostic criteria for obesity and obesity related disorder. J Jpn Soc Study Obes 2000; 6: 18-28.
19. Kim M, Kim H. Accuracy of segmental multi-frequency bioelectrical im- pedance analysis for assessing whole-body and appendicular fat mass and lean soft tissue mass in frail women aged 75 yr and older. Eur J Clin Nutr 2013; 67: 395-400.
20. Strath SJ, Pfeiffer KA, Whitt-Glover MC. Accelerometer use with children, older adults, and adults with functional limitations. Med Sci Sports Ex- erc 2012; 44: S77-85.
21. Butte NF, Ekelund U, Westerterp KR. Assessing physical activity using wearable monitors: measures of physical activity. Med Sci Sports Exerc 2012; 44: S5-12.
22. Cellini N, Buman MP, McDevitt EA, Ricker AA, Mednick SC. Direct com- parison of two actigraphy devices with polysomnographically recorded naps in healthy young adults. Chronobiol Int 2013; 30: 691-8.
23. Sadeh A, Sharkey KM, Carskadon MA. Activity-based sleep-wake iden- tification: an empirical test of methodological issues. Sleep 1994; 17: 201-7.
24. Cole RJ, Kripke DF, Gruen W, Mullaney DJ, Gillin JC. Automatic sleep/
wake identification from wrist activity. Sleep 1992; 15: 461-9.
25. Choi L, Liu Z, Matthews CE, Buchowski MS. Validation of accelerome- ter wear and nonwear time classification algorithm. Med Sci Sports Ex- erc 2011; 43: 357-64.
26. Goldman SE, Stone KL, Ancoli-Israel S, Blackwell T, Ewing SK, Boudreau R, Cauley JA, Hall M, Matthews KA, Newman AB. Poor sleep is associat- ed with poorer physical performance and greater functional limitations in older women. Sleep 2007; 30: 1317-24.
27. Spira AP, Covinsky K, Rebok GW, Punjabi NM, Stone KL, Hillier TA, En- srud KE, Yaffe K. Poor sleep quality and functional decline in older wom- en. J Am Geriatr Soc 2012; 60: 1092-8.
28. Gangwisch JE, Malaspina D, Boden-Albala B, Heymsfield SB. Inade- quate sleep as a risk factor for obesity: analyses of the NHANES I. Sleep 2005; 28: 1289-96.
29. Patel SR, Blackwell T, Redline S, Ancoli-Israel S, Cauley JA, Hillier TA, Lewis CE, Orwoll ES, Stefanick ML, Taylor BC, et al. The association be- tween sleep duration and obesity in older adults. Int J Obes (Lond) 2008;
32: 1825-34.
30. van den Berg JF, Knvistingh Neven A, Tulen JH, Hofman A, Witteman JC, Miedema HM, Tiemeier H. Actigraphic sleep duration and fragmen- tation are related to obesity in the elderly: the Rotterdam Study. Int J Obes
(Lond) 2008; 32: 1083-90.
31. Lauderdale DS, Knutson KL, Yan LL, Rathouz PJ, Hulley SB, Sidney S, Liu K. Objectively measured sleep characteristics among early-middle- aged adults: the CARDIA study. Am J Epidemiol 2006; 164: 5-16.
32. Yan Z, Chang-Quan H, Zhen-Chan L, Bi-Rong D. Association between sleep quality and body mass index among Chinese nonagenarians/cen- tenarians. Age (Dordr) 2012; 34: 527-37.
33. van den Berg JF, Miedema HM, Tulen JH, Hofman A, Neven AK, Tie- meier H. Sex differences in subjective and actigraphic sleep measures: a population-based study of elderly persons. Sleep 2009; 32: 1367-75.
34. Unruh ML, Redline S, An MW, Buysse DJ, Nieto FJ, Yeh JL, Newman AB. Subjective and objective sleep quality and aging in the sleep heart health study. J Am Geriatr Soc 2008; 56: 1218-27.
35. Knutson KL, Spiegel K, Penev P, Van Cauter E. The metabolic consequenc- es of sleep deprivation. Sleep Med Rev 2007; 11: 163-78.
36. Stamatakis KA, Punjabi NM. Effects of sleep fragmentation on glucose metabolism in normal subjects. Chest 2010; 137: 95-101.
37. Ancoli-Israel S, Cole R, Alessi C, Chambers M, Moorcroft W, Pollak CP.
The role of actigraphy in the study of sleep and circadian rhythms. Sleep 2003; 26: 342-92.