Kyung Won Paek*, Ki Hong Chun�, Kwan Woo Lee�
Division of Social Welfare, Baekseok Unversity, Cheonan;
Department of Preventive Medicine and Public Health�; Department of Endocrinology and Metabolism�, Ajou University School of Medicine, Suwon, Korea
Address for correspondence Ki-Hong Chun, M.D.
Department of Preventive Medicine and Public Health, Ajou University School of Medicine, San-5 Wonchon-dong, Yongtong-gu, Suwon 443-721, Korea Tel : +82.31-219-5082, Fax : +82.31-219-5084 E-mail : ajoujkh@ajou.ac.kr
*This study was supported by a grant of the Korean Health 21 R&D Project, Ministry of Health and Welfare, Republic of Korea (A050463).
701
Relationship Between Metabolic Syndrome and Familial History of Hypertension/Stroke, Diabetes, and Cardiovascular Disease
This research analyzes the prevalence of metabolic syndrome (MS) in Korea and examines how the presence of a familial history of diseases related to MS, such as hypertension/stroke, cardiovascular disease, and diabetes, affect the development of MS in Koreans. The prevalence of MS and its components, as defined by the Nation- al Cholesterol Education Program Adult Treatment Panel guidelines, were evalu- ated in nationally representative samples of non-institutionalized civilian Koreans.
This analysis is based on the 2001 Korea National Health and Nutrition Examina- tion Survey, which used a stratified multistage probability sampling design. The final study included 5,742 adults who had completed the necessary health examinations and met the diagnosis of MS. The prevalence of MS was 25.5% in men and 28.7%
in women. Odds ratio for MS among men with a familial history of hypertension/stroke was higher than that among men who did not have this history. The OR for MS among women with a familial history of hypertension/stroke or diabetes was higher than that among women who had no familial history of these diseases. These results show that familial history of hypertension/stroke and diabetes was significantly related to the presence of MS in both young men and women.
Key Words : Metabolic Syndrome X; Causality; Predisposing Factor; Cardiovascular Diseases; Diabetes Mel- litus, Type 2; Korea
Received : 11 October 2005 Accepted : 19 January 2006
INTRODUCTION
As a result of rapid socioeconomic growth and lifestyle changes, cardiovascular disease has become increasingly preva- lent and is now a leading cause of death in Korea. In order to reduce the prevalence and mortality rate of cardiovascular diseases, the various contributing risk factors must be ana- lyzed and proactively controlled. Numerous studies conduct- ed to identify the causal mechanisms of cardiovascular diseases have suggested metabolic syndrome (MS) as a representative biological mechanism. Ford (1) found that the mortality rates for cardiovascular disease and coronary heart disease in a group of subjects with MS were 1.37 (95% CI: 1.02-1.85) and 1.29 (95% CI: 0.92-1.82) times greater than in a group without MS, respectively. These results support the role of MS as a key predictor of cardiovascular disease.
Metabolic syndrome is associated with risk factors for car- diovascular disease (2), and its symptoms include abdominal obesity, low serum high-density lipoprotein (HDL) choles- terol, elevated serum triglycerides (TG), hyperglycemia, and high blood pressure (3). The WHO and the Third Report of the National Cholesterol Education Program’s Adults Treat- ment Panel (ATP III) recently emphasized the importance of MS and proposed a working definition of this syndrome for the first time (3, 4).
Research results provide a diverse set of risk factors that contribute to MS. The prevalence and change in components of MS are affected by psychosocial factors (5-8) such as indi- vidual personality and stress as well as health behavior factors such as smoking (9), alcohol use (9, 10), and physical exercise (11-13). Moreover, data from recent studies show a correla- tion between socioeconomic factors (14-20), such as educa- tion level and household income, and individual components of MS and cardiovascular diseases, demonstrating how MS reflects social inequality. Other studies have shown that such modifying factors combined with genetic predisposing fac- tors contribute to MS. The effects of inherent hereditary fac- tors cannot be modified through changes in behavior, mak- ing genetics an important aspect of the prevalence of MS. Pre- vious research into the relationship between genetic predis- posing factors and MS suggests that individuals with a paren- tal history of conditions such as hypertension/stroke or dia- betes are more likely to develop MS or insulin resistance than are people without a familial history of these diseases (21, 22).
This research analyzes the prevalence of MS in Korea and demonstrates the relationship between familial history of relat- ed diseases, such as hypertension/stroke, diabetes mellitus, and cardiovascular disease, and the development of MS in Koreans.
MATERIALS AND METHODS Study subjects
The Korea National Health and Nutrition Examination Survey (KNHANES) has been conducted by the Korean Ministry of Health and Welfare every 3 yr since 1998 and includes non-institutionalized Korean civilians. The present study is based on data from the 2001 KNHANES, which uses a stratified multistage probability sampling design. The final study subjects included 5,742 adults in their 20s who completed the necessary health examinations for the diagno- sis of MS.
Definition of metabolic syndrome
As detailed in the ATP III report, participants with three or more of the following criteria were defined as having MS:
abdominal obesity (waist circumference >90 cm for men and
>80 cm for women; Asian Pacific Criteria), hypertriglyceri- demia (≥150 mg/dL), low HDL cholesterol (<40 mg/dL for men and <50 mg/dL for women), high blood pressure (≥
130/85 mmHg) and high fasting glucose (≥110 mg/dL).
We included participants who reported current use of anti- hypertensive or diabetic medication (insulin or oral agents) as participants with high blood pressure or diabetes, respec- tively.
Definition of variables used in this study
The genetic predisposing factors considered in this research were a history of hypertension/stroke, cardiovascular disease, or diabetes in parents, siblings, paternal grandparents, or mater- nal grandparents. If a relative had any one of these diseases, the patient was deemed to have a familial history of that con- dition. While the history of diabetes included patients of all ages in the relatives, hypertension/stroke and cardiovascular disease only included patients who are less than age 50 yr. The demographic factors were sex, age, and menopausal status.
Menopausal status was determined at in-depth interview as self-reported cessation of menstruation. Psychosocial factors were measured based on stress levels and health concerns. The level of stress was divided into three categories: high, moder- ate, and low. The level of health concerns was divided into three categories: high, moderate, and low. The socioeconomic factors considered were education level and household income.
Education level was divided into four categories: less than 7 yr, 7-9 yr, 10-12 yr, and more than 12 yr. Monthly household income was divided into three categories: less than USD1,000;
USD1,001 to 3,000; and more than USD3,001. The health behavior factors examined were smoking, alcohol consump- tion, exercise, and sleeping. With regard to smoking, the sub- jects were categorized as smokers, ex-smokers, or never-smok- ers. Ex-smokers were those who reported smoking at least 100
cigarettes during their lifetime but who did not currently smoke cigarettes. The degree of alcohol consumption was categorized as heavy, moderate, and never.
Health examination
Well-trained examiners conducted anthropometric mea- surements on the individuals while they were wearing light clothing or underwear and no shoes. Height was measured to the nearest 0.1 cm using a portable stadiometer (850-2,060 mm; Seriter�). Weight was measured in the upright position to the nearest 0.1 kg using a calibrated balance beam scale (Giant-150N; HANA�). Waist circumference measurements were taken to the nearest 0.1 cm at the end of a normal expi- ration, measuring from the narrowest point between the lower borders of the rib cage and the iliac crest. Systolic and dias- tolic blood pressure levels were measured twice, using a mer- cury sphygmomanometer (Baumanometer�) at phases I and V, respectively. Two readings each of systolic and diastolic blood pressure were measured, and the average of each was used for the data analysis. The first appearance of sound (phase I Korotkoff sound) was used to define systolic blood pressure, and the disappearance of sound (phase V Korotkoff sound) was used to define diastolic blood pressure (23). The blood pressure of each participant was measured in the sitting posi- tion after a 5 min rest period. During the 30 min preceding the measurements, the subjects were required to abstain from smoking or consuming caffeine. Blood samples were collect- ed from the antecubital vein after more than 10 hr of starva- tion for the analysis of serum total cholesterol, triglycerides, HDL cholesterol, and fasting blood glucose (FBS) (Hitachi- 747 autoanalyzer; Hitachi, Japan).
Statistics
The anthropometric characteristics and components of MS were represented as means and 95% confidence intervals sep- arated by sex. The sex- and age-specific prevalence rates of MS were estimated. A multiple logistic regression analysis was used for men and women to estimate the odds ratios of MS based on familial history of the related diseases. We ana- lyzed the data separately according to gender, using SPSS 11.0.
RESULTS
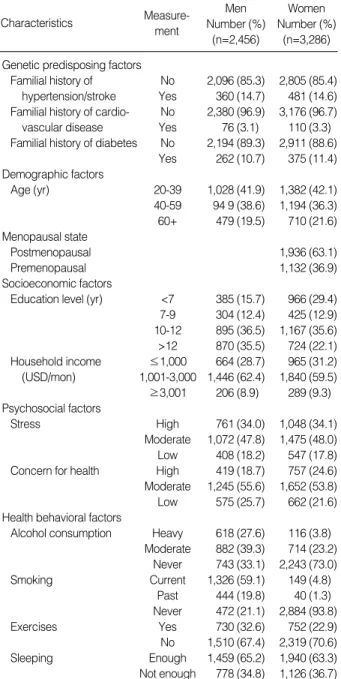
The anthropometric and sociodemographic characteristics of the study subjects are summarized in Table 1. The sex- and age-specific proportions of subjects with elements of MS appear in Table 2. The most prevalent elements of MS among Kore- an men and women were high blood pressure and low HDL cholesterol, respectively. The sex-specific prevalence of each component of MS increased with increasing age in both men and women, and the difference between the sexes was statis-
tically significant. A greater percentage of women (41.7%, 95% CI: 40.1-43.3%) than of men (24.0%; 95% CI: 22.4- 25.6%) had abdominal obesity, while a greater percentage of men (43.8%, 95% CI: 41.9-45.7%) than women (26.5%, 95% CI: 25.1-27.9%) had high triglyceride levels. Low HDL cholesterol was more prevalent in women (59.9%, 95% CI:
58.3-61.5%) than in men (37.4%, 95% CI: 35.6-39.2%).
The percentages of men and women with high blood pres- sure were 46.2% (95% CI: 44.3-48.1%) and 31.5% (95%
CI: 30.0-33.1%), respectively, and the percentages of men and women with high FBS were 18.8% (95% CI: 17.4-20.2
%) and 16.3% (95%CI: 15.1-17.5%), respectively.
The overall percentages of MS combined with these com- ponents appear in Table 3. MS, as defined by the ATP III guidelines, was present in 25.5% (95% CI: 23.8-27.2%) of
Characteristics Measure-
ment
Men Number (%)
(n=2,456)
Women Number (%)
(n=3,286) Table 1.Sociodemographic characteristics of study subjects
Sex Age group
(yr)
Abdominal Obesity
% (95% Cl)
High triglycerides
% (95% Cl)
Low HDL cholesterol
% (95% Cl)
High blood pressure
% (95% Cl)
High glucose
% (95% Cl) Men 20-39 18.8 (17.4-20.2)* 38.1 (36.3-39.9)* 34.4 (32.6-36.2)* 31.3 (29.5-33.1)* 10.9 (9.76-12.0)*
40-59 27.3 (25.7-28.9) 50.6 (48.7-52.5) 37.6 (35.8-39.4) 50.2 (48.3-52.1) 23.1 (21.6-24.6) 60+ 28.6 (26.9-30.3) 43.1 (41.2-45.0) 43.3 (41.5-45.1) 69.6 (67.8-71.4) 27.3 (25.7-28.9) Total 24.0 (22.4-25.6)� 43.8 (41.9-45.7)� 37.4 (35.6-39.2)� 46.2 (44.3-48.1)� 18.8 (17.4-20.2)� Women 20-39 22.3 (21.0-23.6)* 16.3 (15.1-17.5)* 53.8 (52.2-55.4)* 8.2 (7.3-9.1)* 7.9 (7.0-8.8)*
40-59 48.4 (46.8-50.0) 28.6 (27.1-30.1) 59.7 (58.1-61.3) 32.8 (31.2-34.4) 16.8 (15.6-18.0) 60+ 68.1 (66.6-69.6) 43.6 (42.0-45.2) 72.6 (71.2-74.1) 72.7 (71.2-74.2) 31.8 (30.3-33.3) Total 41.7 (40.1-43.3) 26.5 (25.1-27.9) 59.9 (58.3-61.5) 31.5 (30.0-33.1) 16.3 (15.1-17.5) Table 2.The prevalence of each component of metabolic syndrome by sex and age group
Cl, confidence interval.
*p<0.01 (among age groups), �p<0.01 (between men and women).
No. of metabo- lic abno- rmality
Men (n=2,456) Metabolic
syndrome
Prevalence
% (95%CI)
Proportion
% (95%CI)
Cumulative
%
0 No 21.2 (19.6-22.8) 21.2
1 27.3 (25.5-29.0) 48.5
2 26.0 (24.3-27.8) 74.5
3 Yes 25.5 (23.8-27.2) 17.0 (15.5-18.5) 91.5
4 6.8 (5.8-7.8) 98.3
5 1.7 (1.2-2.2) 100.0
No. of metabo- lic abno- rmality
Women (n=3,286) Metabolic
syndrome
Prevalence
% (95%CI)
Proportion
% (95%CI)
Cumulative
%
0 No 20.6 (19.2-22.0) 20.6
1 28.4 (26.9-30.0) 49.0
2 22.3 (20.9-23.7) 71.3
3 Yes 28.7 (27.2-30.2) 15.8 (14.6-17.1) 87.1
4 9.6 (8.6-10.6) 96.7
5 3.3 (2.7-3.9) 100.0
Table 3.The Distribution of metabolic abnormality and the preva- lence of metabolic syndrome*
Cl, confidence interval.
*No response or unknown data were excluded.
Genetic predisposing factors
Familial history of No 2,096 (85.3) 2,805 (85.4) hypertension/stroke Yes 360 (14.7) 481 (14.6) Familial history of cardio- No 2,380 (96.9) 3,176 (96.7)
vascular disease Yes 76 (3.1) 110 (3.3)
Familial history of diabetes No 2,194 (89.3) 2,911 (88.6) Yes 262 (10.7) 375 (11.4) Demographic factors
Age (yr) 20-39 1,028 (41.9) 1,382 (42.1)
40-59 94 9 (38.6) 1,194 (36.3) 60+ 479 (19.5) 710 (21.6) Menopausal state
Postmenopausal 1,936 (63.1)
Premenopausal 1,132 (36.9)
Socioeconomic factors
Education level (yr) <7 385 (15.7) 966 (29.4) 7-9 304 (12.4) 425 (12.9) 10-12 895 (36.5) 1,167 (35.6)
>12 870 (35.5) 724 (22.1) Household income ≤1,000 664 (28.7) 965 (31.2) (USD/mon) 1,001-3,000 1,446 (62.4) 1,840 (59.5)
≥3,001 206 (8.9) 289 (9.3) Psychosocial factors
Stress High 761 (34.0) 1,048 (34.1)
Moderate 1,072 (47.8) 1,475 (48.0) Low 408 (18.2) 547 (17.8) Concern for health High 419 (18.7) 757 (24.6) Moderate 1,245 (55.6) 1,652 (53.8) Low 575 (25.7) 662 (21.6) Health behavioral factors
Alcohol consumption Heavy 618 (27.6) 116 (3.8) Moderate 882 (39.3) 714 (23.2)
Never 743 (33.1) 2,243 (73.0)
Smoking Current 1,326 (59.1) 149 (4.8)
Past 444 (19.8) 40 (1.3) Never 472 (21.1) 2,884 (93.8)
Exercises Yes 730 (32.6) 752 (22.9)
No 1,510 (67.4) 2,319 (70.6)
Sleeping Enough 1,459 (65.2) 1,940 (63.3)
Not enough 778 (34.8) 1,126 (36.7)
the men and in 28.7% (95% CI: 27.2-30.2%) of the women.
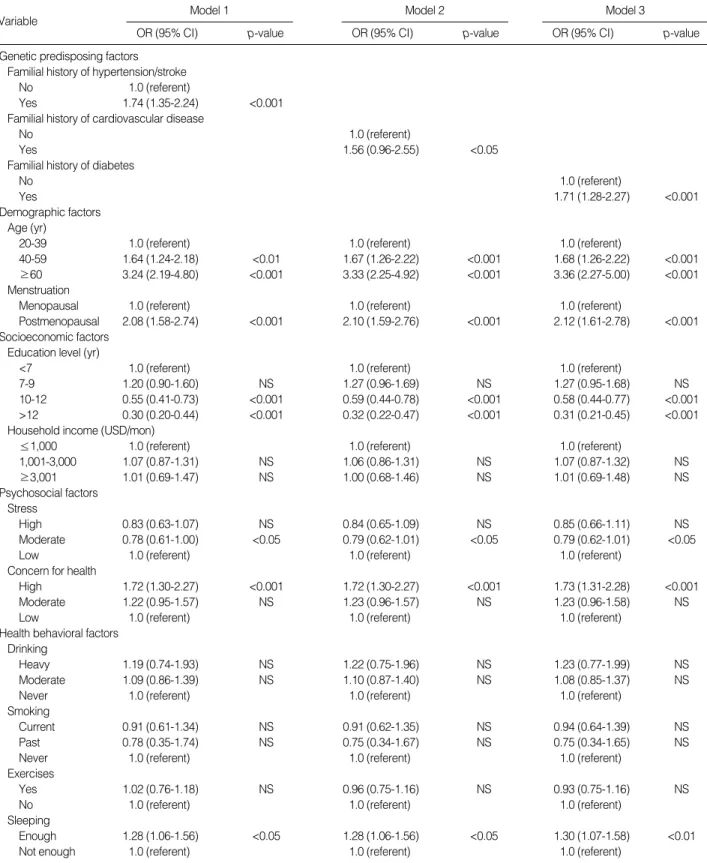
Table 4 and 5 show the adjusted OR for the associations bet- ween a familial history of related diseases and the risk of MS in men and women. Odds ratio (OR) for MS in men with a familial history of hypertension (or stroke) (OR: 1.41, 95%
CI: 1.08-1.84%) was higher than that in men without a his- tory. ORs for MS in women with a familial history of hyper- tension/stroke (OR: 1.74, 95% CI: 1.35- 2.24%) or cardio- vascular disease (OR: 1.56, 95% CI: 0.96-2.55%) or diabetes (OR: 1.71, 95% CI: 1.28-2.27%) were higher compared with
Variable Model 1
OR (95% CI) p-value
Model 2
OR (95% CI) p-value
Model 3
OR (95% CI) p-value
Table 4.Variables affecting to metabolic syndrome in men
CVD, cardiovascular disease; OR, odds ratio; Cl, confidence interval.
Genetic predisposing factors Familial history of hypertension/stroke
No 1.0 (referent)
Yes 1.41 (1.08-1.84) <0.05
Familial history of cardiovascullar disease
No 1.0 (referent)
Yes 1.18 (0.68-2.05) NS
Familial history of diabetes
No 1.0 (referent)
Yes 1.35 (0.99-1.84) NS
Demographic factors Age (yr)
20-39 1.0 (referent) 1.0 (referent) 1.0 (referent)
40-59 1.97 (1.54-2.53) <0.001 1.98 (1.55-2.54) <0.001 2.01 (1.57-2.57) <0.001
≥60 2.71 (1.94-3.80) <0.001 2.69 (1.92-3.77) <0.001 2.74 (1.95-3.84) <0.001
Socioeconomic factors Education level (yr)
<7 1.0 (referent) 1.0 (referent) 1.0 (referent)
7-9 1.03 (0.72-1.48) NS 1.03 (0.71-1.47) NS 1.02 (0.71-1.46) NS
10-12 1.03 (0.75-1.42) NS 1.04 (0.76-1.44) NS 1.03 (0.75-1.42) NS
>12 1.00 (0.71-1.41) NS 1.01 (0.71-1.43) NS 0.99 (0.77-1.40) NS
Household income (USD/mon)
≤1,000 1.0 (referent) 1.0 (referent) 1.0 (referent)
1,001-3,000 1.08 (0.86-1.37) NS 1.08 (0.85-1.36) NS 1.07 (0.84-1.35) NS
≥3,001 0.86 (0.57-1.30) NS 0.85 (0.56-1.29) NS 0.85 (0.56-1.29) NS
Psychosocial factors Stress
High 1.01 (0.75-1.36) NS 1.01 (0.76-1.36) NS 1.01 (0.75-1.36) NS
Moderate 0.75 (0.57-0.99) <0.05 0.76 (0.58-1.00) <0.05 0.76 (0.58-1.01) <0.05
Low 1.0 (referent) 1.0 (referent) 1.0 (referent)
Concern for health
High 1.07 (0.79-1.44) NS 1.08 (0.80-1.46) NS 1.07 (0.79-1.45) NS
Moderate 1.13 (0.89-1.44) NS 1.13 (0.89-1.45) NS 1.12 (0.88-1.43) NS
Low 1.0 (referent) 1.0 (referent) 1.0 (referent)
Health behavioral factors Drinking
Heavy 1.05 (0.82-1.36) NS 1.06 (0.82-1.37) NS 1.07 (0.83-1.38) NS
Moderate 1.00 (0.79-1.28) NS 1.01 (0.80-1.29) NS 1.02 (0.80-1.30) NS
Never 1.0 (referent) 1.0 (referent) 1.0 (referent)
Smoking
Current 0.92 (0.71-1.19) NS 0.91 (0.70-1.18) NS 0.91 (0.70-1.17) NS
Past 1.10 (0.81-1.49) NS 1.08 (0.80-1.46) NS 1.09 (0.80-1.47) NS
Never 1.0 (referent) 1.0 (referent) 1.0 (referent)
Exercises
Yes 1.02 (0.82-1.27) NS 1.03 (1.01-1.58) NS 1.03 (0.83-1.27) NS
No 1.0 (referent) 1.0 (referent) 1.0 (referent)
Sleeping
Enough 1.27 (1.01-1.59) <0.05 1.26 (1.06-1.56) <0.05 1.26 (1.01-1.58) <0.05
Not enough 1.0 (referent) 1.0 (referent) 1.0 (referent)
those in women with no familial history of these conditions.
The association between MS and age increased gradually in
both men and women, and a significantly higher OR (Model 1: 2.08, Model 2: 2.10, Model 3: 2.12) was observed in post-
Variable Model 1
OR (95% CI) p-value
Model 2
OR (95% CI) p-value
Model 3
OR (95% CI) p-value
Table 5.Variables affecting to metabolic syndrome in women
CVD, cardiovascular disease; OR, odds ratio; Cl, confidence interval.
Genetic predisposing factors Familial history of hypertension/stroke
No 1.0 (referent)
Yes 1.74 (1.35-2.24) <0.001
Familial history of cardiovascular disease
No 1.0 (referent)
Yes 1.56 (0.96-2.55) <0.05
Familial history of diabetes
No 1.0 (referent)
Yes 1.71 (1.28-2.27) <0.001
Demographic factors Age (yr)
20-39 1.0 (referent) 1.0 (referent) 1.0 (referent)
40-59 1.64 (1.24-2.18) <0.01 1.67 (1.26-2.22) <0.001 1.68 (1.26-2.22) <0.001
≥60 3.24 (2.19-4.80) <0.001 3.33 (2.25-4.92) <0.001 3.36 (2.27-5.00) <0.001
Menstruation
Menopausal 1.0 (referent) 1.0 (referent) 1.0 (referent)
Postmenopausal 2.08 (1.58-2.74) <0.001 2.10 (1.59-2.76) <0.001 2.12 (1.61-2.78) <0.001 Socioeconomic factors
Education level (yr)
<7 1.0 (referent) 1.0 (referent) 1.0 (referent)
7-9 1.20 (0.90-1.60) NS 1.27 (0.96-1.69) NS 1.27 (0.95-1.68) NS
10-12 0.55 (0.41-0.73) <0.001 0.59 (0.44-0.78) <0.001 0.58 (0.44-0.77) <0.001
>12 0.30 (0.20-0.44) <0.001 0.32 (0.22-0.47) <0.001 0.31 (0.21-0.45) <0.001
Household income (USD/mon)
≤1,000 1.0 (referent) 1.0 (referent) 1.0 (referent)
1,001-3,000 1.07 (0.87-1.31) NS 1.06 (0.86-1.31) NS 1.07 (0.87-1.32) NS
≥3,001 1.01 (0.69-1.47) NS 1.00 (0.68-1.46) NS 1.01 (0.69-1.48) NS
Psychosocial factors Stress
High 0.83 (0.63-1.07) NS 0.84 (0.65-1.09) NS 0.85 (0.66-1.11) NS
Moderate 0.78 (0.61-1.00) <0.05 0.79 (0.62-1.01) <0.05 0.79 (0.62-1.01) <0.05
Low 1.0 (referent) 1.0 (referent) 1.0 (referent)
Concern for health
High 1.72 (1.30-2.27) <0.001 1.72 (1.30-2.27) <0.001 1.73 (1.31-2.28) <0.001
Moderate 1.22 (0.95-1.57) NS 1.23 (0.96-1.57) NS 1.23 (0.96-1.58) NS
Low 1.0 (referent) 1.0 (referent) 1.0 (referent)
Health behavioral factors Drinking
Heavy 1.19 (0.74-1.93) NS 1.22 (0.75-1.96) NS 1.23 (0.77-1.99) NS
Moderate 1.09 (0.86-1.39) NS 1.10 (0.87-1.40) NS 1.08 (0.85-1.37) NS
Never 1.0 (referent) 1.0 (referent) 1.0 (referent)
Smoking
Current 0.91 (0.61-1.34) NS 0.91 (0.62-1.35) NS 0.94 (0.64-1.39) NS
Past 0.78 (0.35-1.74) NS 0.75 (0.34-1.67) NS 0.75 (0.34-1.65) NS
Never 1.0 (referent) 1.0 (referent) 1.0 (referent)
Exercises
Yes 1.02 (0.76-1.18) NS 0.96 (0.75-1.16) NS 0.93 (0.75-1.16) NS
No 1.0 (referent) 1.0 (referent) 1.0 (referent)
Sleeping
Enough 1.28 (1.06-1.56) <0.05 1.28 (1.06-1.56) <0.05 1.30 (1.07-1.58) <0.01
Not enough 1.0 (referent) 1.0 (referent) 1.0 (referent)
menopausal women. Education as a socioeconomic risk fac- tor was statistically significant for women; a higher level of education was significantly associated with a lower prevalence of MS. Stress as a psychosocial factor was statistically signif- icant in both men and women. Overall, patients who were subjected to moderate amounts of stress had statistically lower OR for MS than did those subjected to severe or no stress.
Concern for health as a psychosocial factor was statistically significant only in women. The patient group that expressed constant concern for their health had significantly higher prevalence of MS than did the other groups. Of the health behavior factors, only the level of sleep had statistical signif- icance for both men and women. The participants who report- ed getting enough sleep had higher prevalence of MS compared with those who reported a chronic lack of sleep.
DISCUSSION
Among Korean adults in this study, the overall prevalence of MS, as defined by the ATP III, was 25.5% (95% CI: 23.8- 27.2%) for men and 28.7% (95% CI: 27.2-30.2%) for women.
These figures show a notable increase from the research results from Park et al. (14.2% for men, 17.7% for women) (24) and Kim et al. (22.1% for men, 27.8% for women) (25) based on the 1998 KNHANES data. However, it should be noted that Park’s research applied different abdominal obesity cri- teria (>102 cm for men and >88 cm for women) than those used in this research. Yoon et al. (26) used the same abdom- inal obesity criteria as in the present study and reported MS prevalence rates of 20.8% and 26.9% for men and women, respectively. In this research, only 20.6% (95% CI: 19.2- 22.0%) of females and 21.2% (95% CI: 19.6-22.8%) of males in the population had no components of MS. More than 4/5 of the adult population in their 20s had one or more compo- nents of MS.
Among the genetic predisposing factors that affect the pre- valence of MS, familial histories of hypertension/stroke and of diabetes were significant for both men and women. Liese et al. (22) reported that children with either diabetes or hyper- tension in their familial histories had a higher incidence rate of MS than did children without such history and that chil- dren with familial histories on both parents’ sides had an OR of 4.7 (95% CI: 1.5-14.7%) for these conditions. Williams et al. (27) studied metabolic abnormalities in high school students with familial histories of hypertension and coronary heart disease and reported a higher risk for the onset of MS elements, such as abdominal obesity, hypertension, and dys- lipidemia, in this population.
The present study extends the scope of genetic influence on MS by including parents, grandparents, and siblings in the familial history. The results indicate that a familial his- tory of hypertension/stroke is statistically significance for an increased risk of MS in both men and women. Additionally,
because MS serves as a risk factor for chronic diseases such as cardiovascular diseases and diabetes, we can predict that a fami- lial history of hypertension/stroke affects the onset of these diseases. For women, a familial history of hypertension/stroke yielded an OR of 1.74 (95% CI: 1.35-2.24) for the onset of MS, a familial history of cardiovascular disease yielded an OR of 1.56 (95% CI: 0.96-2.55) and a familial history of diabetes yielded an OR of 1.71 (95% CI: 1.28-2.27). For men, only a familial history of hypertension/stroke was statistically sig- nificant and yielded an OR of 1.41 (95% CI: 1.08-1.84) for the onset of MS. These ratios indicate that familial histories of hypertension/stroke and diabetes have a greater effect on women than on men in terms of the onset of chronic diseases.
As a demographic factor, age was statistically significant for both men and women, and menopause was a major factor among women. We found a significantly higher OR (Model 1: 2.08, Model 2: 2.10, Model 3: 2.12) for the onset of MS among menopausal women, while Park et al. (28) reported an OR of 1.6 (95% CI: 1.1-2.3), indicating a higher preva- lence among menopausal women.
The prevalence of MS was significantly higher among wo- men with lower levels of education. Winkleby et al. (29) de- fined the three factors of the socioeconomic metric as educa- tion, income, and occupation and used them to analyze the changes in health risk factors. The risk for cardiovascular dis- ease according to socioeconomic levels suggested that people of lower socioeconomic status, including lower education level, had statistically significant higher the risk of prevalence of risk factors (HDL cholesterol, and total cholesterol values).
The psychosocial factor of stress was significant for both men and women. Subjects who indicated moderate stress levels had the lowest prevalence of MS, suggesting that moderate stress may have a positive effect of on health.
Among the health behavior factors, sleep and the preva- lence of MS were significantly related. Previous research on alcohol consumption, smoking, and exercise found that sub- jects who used to be heavy smokers but no longer smoked had low HDL cholesterol levels and that subjects who cur- rently smoked exhibited metabolic irregularities caused by acute insulin resistance (30). Long-term smoking, regardless of age, was associated with a statistically significant increase in the coronary heart disease factors of total cholesterol and TG. Although alcohol consumption was found to lower insulin levels (31) and increase insulin sensitivity (32-34) and had a significant inverse relation with OR low HDL cholesterol (26, 34, 35), previous research showed that light to moder- ate alcohol consumption by severely obese subjects decreased the prevalence of type 2 diabetes and that moderate alcohol consumption by diabetic patients significantly lowered the likelihood of coronary heart disease (24, 36). Additionally, regular exercise was reported to lower total cholesterol, LDL cholesterol, and triglycerides, while increasing HDL choles- terol, thereby improving the overall lipid distribution (24, 37). Exercise can also affect blood sugar levels by delaying
or suppressing the progression of glucose intolerance in dia- betes and can block the rise in blood sugar levels by reducing insulin resistance in diabetes (38). However, the present study found that health behavior factors (smoking, alcohol consump- tion, and exercise) were not statistically related to MS. This indicates that the relationship between such risk factors for cardiovascular disease and diabetes and MS as an initial stage of chronic disease has yet to be established.
The research presented in this paper analyzed demographic, socioeconomic, psychosocial, and health behavioral risk fac- tors for MS focusing on the genetic predisposing factors. The results show that the MS is closely related to the age and the familial history of hypertension/stroke or diabetes, but is not significantly related to the health behaviors that are known major risk factors for the chronic diseases. Familial history factors could represent the genetic as well as the environmen- tal factors of patients. This may limit identifying the isolat- ed relationship between genetic factors and MS.
While both MS and health behaviors are established as major risk factors for cardiovascular diseases and diabetes, the results show that MS is not significantly related to health behaviors. However, even though the risk factors for cardio- vascular diseases and diabetes, the presence of MS, and the practice of certain health behaviors are independent of each other, the results of this study suggest that the practice of cer- tain health behaviors can enhance the significance of the rela- tionship between MS and chronic diseases such as cardiovas- cular disease and diabetes. Therefore, MS may be used as a primary predictor for the onset of chronic disease later in life.
Unfortunately, this research did not include eating behavior, which is one of the many factors to consider when using MS as a research parameter.
REFERENCES
1. Ford EF. The metabolic syndrome and mortality from cardiovascu- lar disease and all-causes: findings from the National Health and Nutrition Examination Survey II Mortality Study. Atherosclerosis 2004; 173: 309-14.
2. Isomaa B, Almgren P, Tuomi T, Forsen B, Lahti K, Nissen M, Taski- nen MR, Groop L. Cardiovascular morbidity and mortality associ- ated with the metabolic syndrome. Diabetes Care 2001; 24: 683-9.
3. National Cholesterol Education Program. Executive Summary of the Third Report of the National Cholesterol Education Program (NCEP) Expert Panel on Detection, Evaluation, and Treatment of High Blood Cholesterol in Adults (Adult Treatment Panel III). JAMA 2001; 285:
2486-97.
4. Alberti KG, Zimmet PZ. Definition, diagnosis and classification of diabetes mellitus and its complications. Part 1: Diagnosis and clas- sification of diabetes mellitus, provisional report of a WHO consul- tation. Diabet Med 1998; 15: 539-53.
5. Kawachi I, Sparrow D, Spiro A 3rd, Vokonas P, Weiss ST. A prospec- tive study of anger and coronary heart disease. The Normative Aging
Study. Circulation 1996; 94: 2090-5.
6. Karasek R, Baker D, Marxer F, Ahlbom A, Theorell T. Job decision latitude, job demands, and cardiovascular disease: a prospective study of Swedish men. Am J Public Health 1981; 71: 694-705.
7. Rozanski A, Blumenthal JA, Kaplan J. Impact of psychological factors on the pathogenesis of cardiovascular disease and implications for therapy. Circulation 1999; 99: 2192-217.
8. Hemingway H, Marmot M. Psychosocial factors in the aetiology and prognosis of coronary heart disease: systematic review of prospec- tive cohort studies. BMJ 1999; 318: 1460-7.
9. Lee KS, Park CY, Meng KH, Bush A, Lee SH, Lee WC Lee WC, Koo JW, Chung CK. The association of cigarette smoking and alco- hol consumption with other cardiovascular risk factors in men from Seoul, Korea. Ann Epidemiol 1998; 8: 31-8.
10. Rosell M, de Faire U, Hellenius ML. Low prevalence of the metabolic syndrome in wine drinkers-is it the alcohol beverage or the lifestyle?
Eur J Clin Nutr 2003; 57: 227-34.
11. Center for Disease Control and Prevention. Surgeon General’s report on physical activity and health. JAMA 1996; 276: 522.
12. Ivy JL. Role of exercise training in the prevention and treatment of insulin resistance and non-insulin-dependent diabetes mellitus. Sports Medicine 1997; 24: 321-36.
13. Mayer-Davis EJ, D’Agostino R, Karter AJ, Haffner SM, Rewers MJ, Saad M, Bergman RN. Intensity and amount of physical activity in relation to insulin sensitivity: The Insulin Resistance Atherosclero- sis Study. JAMA 1998; 279: 669-74.
14. Smith GD, Bartley M, Blane D. The Black Report on socioeconomic inequalities in health 10 years on. BMJ 1990; 301: 373-7.
15. Smith GD, Carroll D, Rankin S, Rowan D. Socioeconomic differen- tials in mortality: evidence from Glasgow grave-yards. BMJ 1992;
305: 1554-7.
16. Kunst AE, Mackenbach JP. The size of mortality differences associ- ated with educational level in nine industrialized countries. Am J Public Health 1994; 84: 932-7.
17. Goldblatt P. Mortality and alternative social classifications. In: Gold- blatt P, ed. Longitudinal study: mortality and social organisation.
London: HMSO, 1990; 163-92.
18. Davey SG, Blane D, Bartley M. Explanations for socioeconomic differentials in mortality: evidence from Britain and elsewhere. Euro- pean J Public Health 1994; 4: 131-44.
19. Choiniere R, Latontaine P, Edwards AC. Distribution of cardiovas- cular disease risk factors by socioeconomic status among Canadian adults. Can Med Asso J 2000; 162: S13-24.
20. Brunner EJ, Marmot MG, Nanchahal K, Shipley MJ, Stansfeld SA, Juneja M. Social inequality in coronary risk: central obesity and the metabolic syndrome. Evidence from the Whitehall II study. Diabetolo- gia 1997; 40: 1341-9.
21. Hunt KJ, Heiss G, Sholinsky PD, Province MA. Familial history of metabolic disorders and the multiple metabolic syndrome: the NHLBI family heart study. Genet Epidemiol 2000; 19: 395-409.
22. Liese AD, Mayer-Davis EJ, Tyroler HA, Davis CE, Keil U, Schmidt MI, Brancati FL, Heiss G. Familial components of the multiple meta- bolic syndrome. Diabetologia 1997; 40: 963-70.
23. American Society of Hypertension. Recommedations for routine blood
pressure measurements by indirect cuff sphygmomanometry. Am J Hypertens 1992; 5: 207-9.
24. Park HS, Oh SW, Cho SI, Choi WH, Kim YS. The metabolic syn- drome and associated lifestyle factors among South Korean adults.
Int J Epidemiol 2004; 33: 328-36.
25. Kim MH, Kim BY, Shin YJ. Prevalence of the metabolic syndrome and its association with cardiovascular disease in Korea. J Korean Med Sci 2004; 19: 195-201.
26. Yoon YS, Oh SW, Baik HW, Park HS, Kim WY. Alcohol consump- tion and the metabolic syndrome in Korean adults: the 1998 Korean National Health and Nutrition Examination Survey. Am J Clin Nutr 2004; 80: 217-24.
27. Williams JE, Paton CC, Siegler IC, Eigenbrodt ML, Nieto FJ, Tyroler HA. Anger proneness predicts coronary heart disease risk: prospec- tive analysis from the atherosclerosis risk in communities (ARIC) study. Circulation 2000; 101: 2034-9.
28. Park YW, Zhu S, Palaniappan L, Heshka S, Carnethon MR, Heyms- field SB. Prevalence and associated risk factor findings in the US population from the NHANES III (National Health and Nutrition Examination Survey Third), 1988-1994. Arch Intern Med 2003; 163:
423-36.
29. Winkleby MA, Jatulis DE, Frank E, Fortmann SP. Socioeconomic status and health: how education, income and occupation contribute to risk factors for cardiovascular disease. Am J Public Health 1992;
82: 816-20.
30. Kong C, Nimmo L, Elatrozy T, Anyaoku V, Hughes C, Robinson S, Richmond W, Elkeles RS. Smoking is associated with increased hep- atic lipase activity, insulin resistance, dyslipidaemia and early athe-
rosclerosis in Type 2 diabetes. Atherosclerosis 2001; 156: 373-78.
31. Lazarus R, Sparrow D, Weiss ST. Alcohol intake and insulin levels:
The Normative Aging Study. Am J Epidemiol 1997; 145: 909-16.
32. Kiechl S, Willeit J, Poewe W, Egger G, Oberhollenzer F, Muggeo M, Bonora E. Insulin sensitivity and regular alcohol consumption: large, prospective, cross sectional population. BMJ 1996; 313: 1040-4.
33. Facchini F, Chen YD, Reaven GM. Light-to moderate alcohol intake is associated with enhanced insulin sensitivity. Diabetes Care 1994;
17: 115-9.
34. Freiberg MS, Vasan RS, Cabral HJ, Ellison RC, Heeren TC. Alcohol consumption and the prevalence of the metabolic syndrome in the U.S. Diabetes Care 2004; 27: 2954-9.
35. Nanchahal K, Ashton WD, Wood DA. Alcohol consumption, meta- bolic cardiovascular risk factors and hypertension in woman. Int J Epidemiol 2000; 29: 57-64.
36. Dixon JB, Dixon ME, O’Brien PE. Alcohol consumption in the seve- rely obese: relationship with the metabolic syndrome. Obes Res 2002;
10: 245-52.
37. Pan XP, Li GW, Hu YH, Wang JX, Yang WY, An ZX, Hu ZX, Lin J, Xiao JZ, Cao HB, Liu PA, Jiang XG, Jiang YY, Wang JP, Zheng H, Zhang H, Bennett PH, Howard BV. Effects of diet and exercise in prevention NIDDM in people with impaired glucose tolerance: the Da Qing IGT and Diabetes Study. Diabetes Care 1997; 20: 537-44.
38. Lakka TA, Laaksonen DE, Lakka HM, Mannikko N, Niskanen LK, Rauramaa R, Salonen JT. Sedentary lifestyle, poor cardiorespiratory fitness, and the metabolic syndrome. Med Sci Sports Exerc 2003;
35: 1279-86.