INTRODUCTION
The rapid introduction of desflurane produces sympathet- ic stimulation and associated changes, which are represent- ed by increases in blood pressure, heart rate and pupil diam- eter (1-3). The cerebrovascular response to a rapid increase in desflurane was also reported and considered to be either a coincident or independent change from hemodynamic stimu- lation (4, 5). There are few reports on the cerebral oximetric response to the introduction of desflurane.
Hoffman et al. (6) observed an increase in the cerebral tis- sue PO2during desflurane anesthesia, and suggested the in- creased PO2to be indicative of the improved cerebral oxygena- tion status. The cerebral oximetry (rSO2) values can be com- pared with the focal cerebral tissue PO2. Moreover, the increase in rSO2can be regarded not only as an improvement in the cerebral oxygenation status but also as a resultant hyperemia.
It was hypothesized that rSO2would also respond to the rapid introduction of desflurane.
Carbon dioxide plays an important role in regulating the cerebral blood flow. Hence, hypocapnia would be favorable in desflurane-induced hyperemic changes to the brain. The addition of N2O, which is commonly used in everyday prac- tice of anesthesia, decreases the minimun alveolar concentra- tion (MAC) of desflurane and would attenuate the response
of rSO2by increasing the depth of anesthesia if the change in rSO2is dependent on systemic sympathetic stimulation.
This study examined the inherent cerebrovascular effects of N2O. It is expected that this study will help to improve the understanding of the cerebrovascular changes during desflu- rane anesthesia.
Accordingly, in order to demonstrate that hypocapnia or the addition of N2O can modify the response of rSO2, the con- centration (dose)-response relationship for the change in rSO2 during the rapid introduction of desflurane was examined using a nonlinear mixed-effects model in a grouped repeat- ed design.
MATERIALS AND METHODS
After obtaining institutional research board approval (2008- 1-26) and written informed consent, 12 American Society of Anesthesiologist (ASA) physical status class 1-2 adults who underwent a variety of surgical procedures requiring general anesthesia were enrolled in this study. The exclusion criteria included subjects with alleged respiratory, cardiovascular, and cerebral diseases, or were taking associated medications. No premedicament was given. The subjects were allocated ran- domly to an Air (n=6) or N2O group (n=6).
1051
Younsuk Lee, Jeoung Hyuk Lee, Dong-Il Yoon, Youngmin Lee, Kyoung Ok Kim, Seunghyun Chung, Junyong In, Jun Gwon Choi, and Hun Cho
Department of Anesthesiology and Pain Medicine, and Medical Research Institute, Dongguk University College of Medicine, Goyang, Korea
Address for correspondence Younsuk Lee, M.D.
Department of Anesthesiology and Pain Medicine, Ilsan Hospital, Dongguk University College of Medicine, 814 Siksa-dong, Ilsandong-gu, Goyang 410-773, Korea Tel : +82.31-961-7872, Fax : +82.31-961-7864 E-mail : [email protected]
This research was supported by a grant from 2008 Dongguk University Research Fund.
DOI: 10.3346/jkms.2009.24.6.1051
Hypocapnia Attenuates, and Nitrous Oxide Disturbs the Cerebral Oximetric Response to the Rapid Introduction of Desflurane
The aim of this study was to develop a nonlinear mixed-effects model for the increase in cerebral oximetry (rSO2) during the rapid introduction of desflurane, and to deter- mine the effect of hypocapnia and N2O on the model. Twelve American Society of Anesthesiologist physical status class 1 and 2 subjects were allocated randomly into an Air and N2O group. After inducing anesthesia, desflurane was then increased abruptly from 4.0 to 12.0%. The PETCO2, PETDESFand rSO2were recorded at 12 pre- determined periods for the following 10 min. The maximum increase in rSO2reached +24-25% during normocapnia. The increase in rSO2could be fitted to a four param- eter logistic equation as a function of the logarithm of PETDESF. Hypocapnia reduced the maximum response of rSO2, shifted the EC50to the right, and increased the slope in the Air group. N2O shifted the EC50to the right, and reduced the slope leaving the maximum rSO2unchanged. The N2O-effects disappeared during hypocapnia.
The cerebrovascular reactivity of rSO2to CO2is still preserved during the rapid intro- duction of desflurane. N2O slows the response of rSO2. Hypocapnia overwhelms all the effects of N2O.
Key Words : Cerebral Oximetry; Desflurane; Anesthesia
Received : 10 November 2008 Accepted : 19 January 2009
In addition to the standard monitoring equipment, the emitter-sensor couplet of a cerebral oximeter (INVOS 5100B, Somanetics�, Troy, OH, U.S.A.) was attached to the right brow, and a sensor from a Finometer (Finapres Medical Sys- tems, Amsterdam, The Netherlands) was attached to the ap- propriate finger to obtain the continuous arterial pressure, heart rate, and cardiac output. The concentrations of CO2, N2O and desflurane were measured using the airway mod- ule embedded in an anesthesia machine (S/5 Avance, Datex- Ohmeda, Helsinki, Finland). Anesthetic induction and main- tenance were achieved as described by our institution’s stan- dard anesthetic guidelines. Briefly, vecuronium (0.08-0.1 mg/
kg), remifentanil (computer-estimated effect-site concentra- tion, Ce=3.0 ng/mL) were administered intravenously as re- quired after confirming the loss of consciousness with a titrat- ed dose of intravenous propofol (1.5-2.0 mg/kg). Remifentanil was administered using a target-controlled infusion device (Orchestra�Base Primea, Fresenius-Kabi, Bad Homburg, Germany). Desflurane (6.0% dial-concentration) were inhaled.
After the trachea was intubated, the infusion of remifentanil was stopped and the dial-concentration of desflurane was ad- justed to 4.0%. In the Air group, medical air was added to the oxygen to ensure an inspired oxygen fraction of 0.4. N2O was added in the N2O group. Mechanical ventilation was started with VT=8 mL/kg and RR=10 breath/min while permitting an inter-subjects difference in the end-tidal concentration of CO2(PETCO2). The corresponding PETCO2was 33±4 (ranged 24-41) mmHg throughout the study period. The SpO2values were approximately 98-100% during the course of the study.
After stabilization for approximately 20 min until the Ce of remifentanil fell to below 0.3, the average end-tidal (PET-
DESF) and inspired (PFIDESF) desflurane reached 4.0%, and the dial-concentration of desflurane was increased to 12.0%, simul- taneously with 6 L/min of a fresh gas flow rate and the PET-
DESFconverged within 90% of the PFIDESF. This time was set to time 0 (T0).
Measurements and calculations
The basic preanesthetic measurements included the body weight, height, rSO2, mean arterial pressure (MAP), heart rate (HR), cardiac output (CO), body surface area (BSA), and derived cardiac index (CI). Consecutive measurements, includ- ing the rSO2, SpO2, MAP, HR, CI, PETDESF, PFIDESF, and PETCO2
were recorded at T0 and the following periods; 0.5, 1.0, 1.5, 2.0, 2.5, 3.0, 3.5, 4.0, 5.0, 8.0, and 10 min from T0. The measurement was stopped when the MAP>120 mmHg or
<50 mmHg, and the HR>130 beats/min or <45 beats/min.
However, the measurements before stopping were also in- cluded in the analysis. Two subjects, one in the Air group and one in the N2O group, showed hypotension (MAP<50 mmHg), which was treated promptly with intravenous ephe- drine 5 mg. The rSO2was defined as the difference between the rSO2at a given time from rSO2at T0. The estimated alveo-
lar concentration of desflurane (PET/FIDESF) was defined and calculated as the PETDESFdivided by the final PFIDESF.
Reliability of the rSO2measurements
By examining the variance components using a random intercept and slope model, the reliability of the two rSO2 measurements was tested before and after the induction of anesthesia. The value of rSO2was predicted from hemoglobin with a combination of the anesthesia-effect and subject-effect as random effects. The intra-class correlation (ρ) was defined and estimated,
τ2 ρ= τ2+σ2
where τis the between-subjects variance and σis the with- in-subjects variance. The variance of the between-subjects random effects was composed of the variance of each random effect, in this case, τ2=τintercept2+τslope2. Interpretation of ρwas descriptive. A high ρ(>0.90) suggests that the between-sub- jects component was dominant in the total variances, which also indicated a good reliability of the repeated measurement within-subjects.
Hemodynamic variables
The temporal changes in the MAP, HR, and CI were ana- lyzed by an analysis of the covariance (ANCOVA). The AN- COVA model was fitted as a function of time, and N2O was used as a grouping variable. When the N2O-effect was signif- icant, 12 pairwise comparisons were made at each time peri- od using the adjusted P according to the Dunn-Sidak pro- cedures (P′=1-[1-P]12).
Modeling for temporal changes in PET/FIDESF
The temporal change in the PET/FIDESFwas modeled using an exponential function of time as follows:
Predicted PET/FIDESF=f(time)=Asym+(y0-Asym)×e-elrc×time where Asym is the asymptote as time approaches infinity, and y0 is PET/FIDESFat T0. The parameter, lrc, is the logarithm of the rate constant, ensuring a positive rate constant. The time to half (t0.5) can be derived from log(2)/elrc. The param- eter time is the elapsed time from T0. PET/FIDESFwas fitted as a function of time, where the covariates, such as N2O, PETCO2, MAP, HR, and CI, were analyzed to demonstrate their effects on the individual parameters; Asym, y0, and lrc. The term for the random effects was constructed initially with the inter- cepts of Asym, y0, and lrc. Between the random effects, the high correlations (r>0.9) were removed by under-parameter- ization. The variance component of the random effects belong- ing to the subjects was also examined.
Modeling for the increase in rSO2for PETDESF
The rSO2 increased as a function of the logarithm of PETDESFaccording to the following equation:
rSO2=f[log(PETDESF)]= Rmax+ R0-Rmax 1+e[log(PETDESF)-LC50]/θ where Rmaxis the maximum response, R0is the initial res- ponse, LC50is the log(PETDESF) value at the inflection point
[=log(EC50)], and θis simply the inverse slope factor. This is known as the four-parameter logistic model, which relates the response of rSO2to an input PETDESFusing a sigmoidal function. When describing and discussing the results, all the LC50was translated in terms of the EC50, eLC50.
The effects of PETCO2and N2O on the individual model parameters, Rmax, R0, LC50, and θ, were the primary focus of this study. The other covariates, MAP, HR and CI, were also examined using the stepwise including and excluding tech- nique. The term for the random effects was constructed with the intercepts of Rmaxand θ. No random effects of R0or LC50 were assumed. The block diagonal matrix was specified to represent the random effects variance-covariance matrix. The heteroscedasticity of the within-subject errors, particularly at low PETDESFlevels, was accommodated using a variance function, which is a power of the absolute value of the vari- ance covariate.
The final model was chosen based on a log-likelihood test and an analysis of variance of nonlinear mixed-effects model.
The median (Q1-Q3) standardized residuals were calculated to determine the quality of the prediction for the population.
The typical values of the overall cerebrovascular reactivity of rSO2to CO2were estimated form (Rmax(40 mmHg)-Rmax(30 mmHg))/
10 mmHg in each group.
Unless specified otherwise, all values are reported as mean
±SD. All statistical analyses, including nonlinear mixed- effects modeling, inferential statistics, and arithmetic calcu- lations, were performed using S-Plus 8.0 (Insightful Corp., Seattle, WA, U.S.A.), which was enhanced using the nlme (nonlinear mixed effects) version 3.3.2 library (Pinheiro and Bates, U.S.A.).Therefore, estimates of the parameters for the fixed effects of the mixed-effects model are presented as the mean (standard error of the mean), and the residuals of the fitted model were presented as the median (Q2-Q3). Random effects were presented as overall SD of the random effects. Bet- ween the groups, the basic measurements and calculations were compared using a Wilcoxon rank test, and the gender distribution was compared using a Fisher’s exact test. A mul- tiple Wilcoxon rank test was used with the P′to compare the pairwise contrasts for the groups at 12 periods. P values
<0.05 were considered significant.
RESULTS
Measurements, calculations, and the reliability of the measurements
There was no significant difference in the basic measure- ments between the groups (Table 1). There was also no sig-
Values are reported as the mean±SD.
All measurements in the Table 1 show no significant differences bet- ween the two groups (P≥0.05).
BSA, body surface area, estimated by 71.84×Body Weight0.425×Height0.725/ 10,000; MAP, mean arterial pressure; HR, heart rate; CO, cardiac output;
CI, cardiac index.
Parameters Overall
(n=12)
Air group (n=6)
N2O group (n=6)
Age (yr) 42±10 45±6 39±12
Sex (male/female) 6/6 3/3 3/3
Body weight (kg) 63±10 64±12 62±9
Height (cm) 162±9 160±10 164±9
BSA (m2) 1.67±0.17 1.67±0.19 1.67±0.17 Hemoglobin (g/dL) 13.8±1.2 13.6±1.2 14.0±1.2
MAP (mmHg) 94±15 90±6 99±20
HR (beat/min) 71±12 62±10 71±12
CO (L/min) 5.80±1.67 6.50±1.86 5.10±1.23 CI (L/min/m2) 3.48±0.95 3.93±1.07 3.03±0.59 Table 1. Summary statistics for the basic measurements and calculations
Values are reported as the mean±SD (min-max).
Measurements of PETCO2, SpO2, and final PFIDESFin the Table 2 show no significant difference between the two groups (P≥0.05).
The values of MAP, HR, CO, CI, and PETDESFwere not compared based on the simple mean±SD, which is meaningless.
n, number of total repeated measurements for 6 subjects in each group;
BSA, body surface area; MAP, mean arterial pressure; HR, heart rate;
CO, cardiac output; CI, cardiac index; PETCO2, end-tidal CO2concentra- tion; SpO2, pulse oximetry; PETN2O, end-tidal N2O concentration; PFIN2O, inspired N2O concentration; PETDESF, end-tidal desflurane concentration;
Final PFIDESF, final inspired desflurane concentration.
Parameters Overall
(n=138)
Air group (n=67)
N2O group (n=71) MAP (mmHg) 74±18 (44-123) 72±20 76±15 HR (beat/min) 81±22 (45-150) 74±16 87±25 CO (L/min) 6.32±2.01 6.02±1.62 6.61±2.29
(2.00-11.90)
CI (L/min/m2) 3.82±1.32 3.64±1.03 4.00±1.54 (1.35-7.83)
PETCO2(mmHg) 33±4 (24-41) 33±3 34±4
SpO2(%) 99±1 (98-100) 98±1 99±1
PETN2O(%) - - 52±4
PFIN2O(%) - - 53±4
PETDESF(%) 8.9±1.9 9.0±2.0 8.9±1.8 Final PFIDESF(%) 11.5±0.7 11.9±0.9 11.1±0.3 Table 2. Summary statistics for the repeated measurements dur- ing rapid introduction of desflurane
nificant difference in the repeated measurements during rapid introduction of desflurane between the groups (Table 2). The mean rSO2values before and after anesthesia were 68±8%, whose anesthesia-effect was estimated to be +0-4% but failed
to reach significance at the 5% level (P=0.127). The ρ, esti- mated intra-class correlation between the two rSO2measure- ments was 0.9336, indicating that the repeated measurements of rSO2were reliable within-subjects.
Hemodynamic variables
The MAP, HR and CI evenly showed an initial increase with a subsequent decrease (Fig. 1). The temporal changes in the MAP, HR, and CI were statistically significant (P<
0.001, P=0.007, and P=0.001, respectively). N2O signifi- cantly affected the pattern of the temporal changes in the CI (P=0.021) but not MAP (P=0.059) or HR (P=0.877). Changes in N2O had no significant effect on the CI at any separate time period (P′≥0.05 between groups). Despite the statistical insignificance, N2O mildly augmented the increase in the HR (+17 beats/min), and reduced the slope of the decrease in the HR, MAP, and CI.
Modeling for the temporal changes in PET/FIDESF
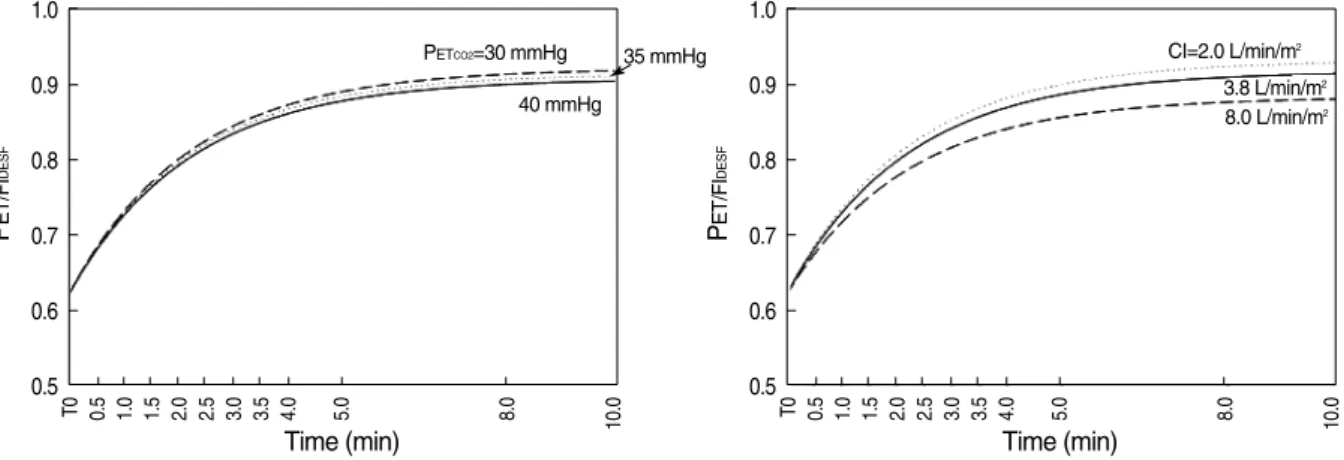
The temporal changes in PET/FIDESFwere modeled by Predicted PET/FIDESF
=f(time)=0.9080+(0.6196-0.9080)×e-e-0.7836×Time
when PETCO2=40 mmHg and CI=3.8 L/min/m2(Fig. 2).
The time to half (t0.5) was estimated to be approximately 1.5 min from T0. In concordance with the well-known concept on the pharmacokinetics of volatile anesthetics, the PETCO2
(P=0.001) and CI (P<0.001) significantly modified the Asym, not lrc or y0. A decrease in PETCO2increased the Asym by 0.0014 (0.0009, SE)/mmHg and increase the CI by 0.0081 (0.0019, SE)/L/min/m2. No other covariates, such as the N2O, MAP, or HR, modified the parameters. There was a strong correlation between the random effects for the intercepts of
Fig. 1. Temporal changes in the MAP (upper panel), HR (middle panel) and CI (lower panel). During rapid introduction of desflu- rane, MAP, HR, and CI show consistent initial increase (near 30%, 1.5 min) and a subsequent decrease. N2O does not blunt these increases, and modifies the temporal pattern of the change in CI significantly* (P=0.021) regardless of there being no significant difference at any time period by multiple comparisons (P′≥0.05).
140 120 100 80 60 40 7 6 5 4 3 2 1
T0 0.5 1.0 1.5 2.0 2.5 3.0 3.5 4.0 5.0 8.0 10.0
120 100 80 60 40
2Mean arterial pressure (mmHg)Heart rate (beat/min)Cardiac index (L/min/m) 20
Time (min)
Air
N2O
Air N2O
Air N2O
Air N2O
Air N2O*
Fig. 2. Predicted temporal changes in the PET/FIDESFfor variables PETCO2(left panel), and CI (right panel). Typical curves were redrawn separate- ly for the changes in PETCO2and CI within the reasonable range of the data. The time to half (t0.5) was estimated to be approximately 1.5 min.
PET/FIDESF=estimated alveolar concentration of desflurane; PETCO2=end-tidal carbon dioxide concentration (mmHg); CI, cardiac index (L/
min/m2).
PET/FIDESF
1.0
0.9
0.8
0.7
0.6
0.5
Time (min)
T0 0.5 1.0 1.5 2.0 2.5 3.0 3.5 4.0 5.0 8.0 10.0 PET/FIDESF
1.0
0.9
0.8
0.7
0.6
0.5
Time (min)
T0 0.5 1.0 1.5 2.0 2.5 3.0 3.5 4.0 5.0 8.0 10.0
PETCO2=30 mmHg 40 mmHg
8.0 L/min/m2 CI=2.0 L/min/m2
3.8 L/min/m2 35 mmHg
Asym and y0 (r=0.983) and random effects for y0 were re- moved. Random effects were ±0.0458. The standardized residuals were normally distributed, -0.1803 (-0.7387-0.5468).
Modeling for the increase in rSO2for PETDESF
The final model for the increase in rSO2were determined using the following equation
Predicted rSO2=f[log(PETDESF)]
=25.9425+ -0.3362-25.9425 1+e[log(PETDESF-40)-9.3549]/0.1084
where PETCO2=40 mmHg in the Air group. In the model,
R0was constant at -0.3362 (0.2894) and Rmax, EC50and θwere modified by a combination of PETCO2and N2O (Table 3). No other covariates, such as MAP, HR, or CI, had a significant effect on the parameters (P≥0.05). The effects of CO2 on Rmaxand θwere estimated within the course of the increase in PETDESF(Fig. 3). However, the typical values for the cere- brovascular reactivity to CO2could be estimated by 1.5389%/
mmHg in the Air group, and 1.2898%/mmHg in the N2O group (P≥0.05 between groups). Random effects were ± 2.3872. The standardized residuals were normally distribut- ed, 0.1798 (-0.4629-0.4713).
DISCUSSION
During the rapid introduction of desflurane, the curve for the temporal increase in PET/FIDESF from a concentration of 4% to 12% in this study agreed reasonably well with a text- book example regarding the effect of PETCO2and CI. High residuals are indicative of low predictability and the need of the two-exponential curves. We did not attempt to refine the model because it was beyond the interest of the present study.
Prefilled N2O in the lung had no effect on the curve. The rapid introduction of desflurane produced a similar hemody- namic stimulatory effects to previous reports. Stimulation peaked at approximately 1.5 min from T0, which approxi- mated to t0.5of the curve for the increase in PET/FIDESF. N2O failed to block the stimulation of MAP and HR, or mildly promoted the increased pattern, which is comparable to the N2O-induced changes in pupil diameter reported by Daniel et al. (3). As expected, rSO2also increased up to 24-25% ac- cording to the increase in PETDESFin a concentration-depen- dent manner. The residuals were extremely small and inde- pendent of any possible violation by the MAP, HR, or CI.
This study did not examine the random effects in detail. The
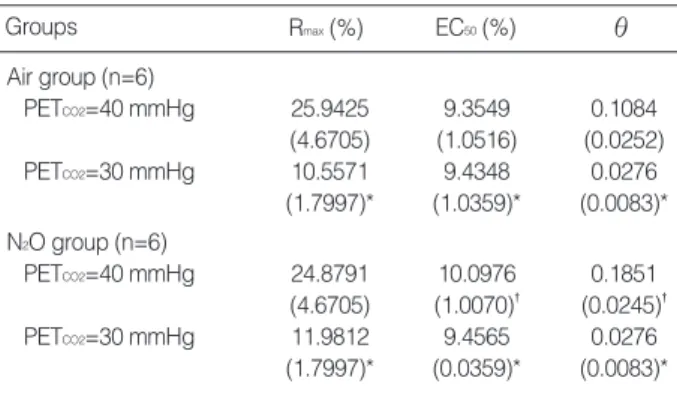
Values are reported as the mean (standard error of mean).
Rmax, the destined maximum response of rSO2; EC50, median effective concentration of desflurane, eLC50; θ, the inverse slope factor; PETCO2, end- tidal concentration of carbon dioxide.
The * mark denotes the statistically significant difference from PETCO2=40 mmHg (P<0.001); The �mark denotes the statistically significant differ- ence from Air group (P<0.001).
Groups Rmax(%) EC50(%) θ
Air group (n=6)
PETCO2=40 mmHg 25.9425 9.3549 0.1084 (4.6705) (1.0516) (0.0252) PETCO2=30 mmHg 10.5571 9.4348 0.0276 (1.7997)* (1.0359)* (0.0083)*
N2O group (n=6)
PETCO2=40 mmHg 24.8791 10.0976 0.1851 (4.6705) (1.0070)� (0.0245)�
PETCO2=30 mmHg 11.9812 9.4565 0.0276
(1.7997)* (0.0359)* (0.0083)*
Table 3. Parameter estimates of the model to fit rSO2accord- ing to PETCO2
Fig. 3. Predicted rSO2for the increase in PET/FIDESFaccording to the change in PETCO2. The predicted rSO2increases with increasing PETDESFas a four-parameter logistic curve. At PETCO2=40 mmHg, the addition of N2O decreases the slope of the increase, but the same maxi- mum rSO2lies outside of this graph. In N2O group, both the inverse slope factor and maximum rSO2decrease significantly with decreas- ing PETCO2. The N2O-effects decrease with decreasing PETCO2, and the differences between the groups disappear when PETCO2= 30 mmHg.
PETDESF, end-tidal concentration of desflurane (%); PETCO2, end-tidal carbon dioxide concentration (mmHg).
Predicted rSO2(%)
30
25
20
15
10
5
0
PETCO2
40 mmHg
30 mmHg Air group
0 2 4 6 8 10 12
PETof desflurane (%)
Predicted rSO2(%) 25
20
15
10
5
0
PETCO2
40 mmHg
30 mmHg N2O group
0 2 4 6 8 10 12
PETof desflurane (%)
random effects were confined to refining the relationship bet- ween the predictors and the response by eliminating the indi- vidual variability. Modeling for the population was beyond the scope of this study. The fitted equation included three major parameters, Rmax, EC50, and θ.
Hypocapnia reduced the Rmax, and increased the slope in the Air group. EC50was shifted to the right slightly but sig- nificantly. This suggests that the cerebrovascular reactivity to CO2still subsists at more than 1.5 MAC desflurane. The CO2reactivity was not measured while the patient was awake.
Therefore, the absolute values for the reactivity cannot be used to draw any real conclusion as to whether it was intact or pre- served. There are no reports on the reactivity to CO2measured at high concentrations of desflurane that could be used to compare with the present study. With 0.5-1.0 MAC desflu- rane, the reactivity to CO2is considered to be preserved (7- 9). In a study of 1.5 age-adjusted MAC desflurane-anesthe- tized children, the reactivity to CO2was impaired (8). The estimate of the overall reactivity to CO2of rSO2was 1.2898- 1.5389%/mmHg, which is similar to the 1.1±0.67%/
mmHg estimated results from 5% desflurane-anesthetized adults by Lee et al. (9). In this study, the reactivity to CO2 was estimated during the dynamic phase of the increasing concentration of desflurane, which is unlike the steady state used by others. Its importance is unknown and so any com- parison might be invalid.
Although there is some discrepancy in the measurements or design, it can be generally summarized that the cerebrovascular effect of the solitary or additional N2O to volatile anesthetics causes an elevation (10-12), or at least no decrease (13-16) in the cerebral blood flow. Interpreting the effect of N2O on these parameters is quite complicated. During normocapnia, the addition of 60% N2O obviously increased the inverse slope factor θand shifted EC50to the right in order to reduce the change in rSO2caused by an increase in desflurane concentra- tion, while the Rmaxwas unchanged. These N2O-effects dis- appeared in hypocapnia. Lowering PETCO2shifted the EC50to the left and reduced the θs. Summary of the hypocapnia-effect in the N2O group is the right-shift and steepening of the curve.
There may be two explanations for this observation. The rapid introduction of desflurane could cause a pronounced hyper- emic condition of the brain, in which no more hyperemia could be reached even by adding N2O. The slower response in the N2O group might indicate a disturbance of the cerebral vascu- latures to changes in the desflurane concentration. The other explanation is that hypocapnia overwhelms the effect of N2O.
The former explanation partly agrees with some previous studies that reported a cerebrovascular effect in anesthesia with a combination of N2O and volatile anesthetics, in which N2O had no additional effect on the volatile-induced change in cerebral blood flow velocity (16). Contradiction was also found. For example, N2O disturbs the flow/metabolism cou- pling when added to sevoflurane (12). No other report has estimated the additional N2O-effect even with a desflurane
concentration of >1.5 MAC or with a variety of CO2tension.
The latter explanation remains to be demonstrated. There are no reports of interactions between hypocapnia and N2O.
Local factors of the brain should also be considered. N2O or volatile anesthetics redistribute rCBF (13, 17, 18). The rSO2 measurements were limited to the frontal pole of the brain, which represent neither the global CBF nor typical rCBF.
One limitation of this study is that the protocol included 3 ng/mL Ce of remifentanil during induction of anesthesia.
It was clinically relevant to suppress the hemodynamic res- ponse due to laryngoscopy. By waiting 20 min from the dis- continuation of the remifentanil infusion, it was confirmed the Ce fell below 0.3 ng/mL. This is the minimum concentra- tion where no hemodynamic interaction between remifentanil and desflurane would be expected. Moreover, our episodic finding suggested that desflurane-induced sympathetic stim- ulation is unlikely repeat once it was stimulated, which was also inferred from the classical report by Weiskopf et al. (19).
Another shortcoming of this study is the well-known lim- itations of rSO2. It is believed that the confounders had been eliminated. The hemoglobin concentrations and PETCO2values were similar in both groups, which would be regarded a major determinant for the change in rSO2. The SpO2values were all within 98-100%, and the MAP values were within 44-123 mmHg. Only two subjects showed a MAP <50 mmHg. The within-subject variability was confirmed to be <10% with the reliability test using the intra-class correlation. The value of the intra-class correlation in examining the reliability of the repeated medical data was well described by Everitt and Rabe-Hesketh (20). The inter-subjects variability of rSO2was also removed by considering the difference from the baseline.
There was a relatively small number of subjects enrolled in this study. However, the nature of mixed-effects modeling can overcome the size of the sample. The limitations related to the small sample size always arise from the inevitable inter- individual variability, which can be eliminated by mixed-effects modeling. The quality of our fitted model was exceptionally good, and the results and conclusions are strong.
In conclusion, a nonlinear mixed-effects model, which st- rongly predicted the response of rSO2as the function of log- arithm concentration of PETDESF, was modified only by PETCO2
and N2O. Hypocapnia shifted the response curve to the right and reduced the maximum response of rSO2in the Air group.
The cerebrovascular reactivity to CO2still preserved within the scope of this study. It is difficult to interpret the effects of N2O on the response of rSO2to the rapid introduction of desflurane. There are little or no N2O-induced hemodynam- ic changes and the effects of N2O are definitely due to its in- herent cerebrovascular effect.
REFERENCES
1. Ebert TJ, Muzi M, Lopatka CW. Neurocirculatory responses to sevo-
flurane in humans. A comparison to desflurane. Anesthesiology 1995;
83: 88-95.
2. Ebert TJ, Muzi M. Sympathetic hyperactivity during desflurane anes- thesia in healthy volunteers. A comparison with isoflurane. Anesthe- siology 1993; 79: 444-53.
3. Daniel M, Larson MD, Eger EI 2nd, Noorani M, Weiskopf RB. Fen- tanyl, clonidine, and repeated increases in desflurane concentration, but not nitrous oxide or esmolol, block the transient mydriasis caused by rapid increases in desflurane concentration. Anesth Analg 1995;
81: 372-8.
4. Brenet O, Granry JC, Poirier N, Le Gall R. The effect of desflurane on cerebral blood flow velocity and cerebrovascular reactivity to CO2 in children. Ann Fr Anesth Reanim 1998; 17: 227-33.
5. Tonner PH, Scholz J, Krause T, Paris A, von Knobelsdorff G, Schulte an Esch J. Administration of sufentanil and nitrous oxide blunts car- diovascular effects of desflurane but does not prevent an increase in middle cerebral artery blood flow velocity. Eur J Anaesthesiol 1997;
14: 389-96.
6. Hoffman WE, Charbel FT, Edelman G. Desflurane increases brain tissue oxygenation and pH. Acta Anaesthesiol Scand 1997; 41: 1162-6.
7. Mielck F, Stephan H, Buhre W, Weyland A, Sonntag H. Effects of 1 MAC desflurane on cerebral metabolism, blood flow and carbon diox- ide reactivity in humans. Br J Anaesth 1998; 81: 155-60.
8. Luginbuehl IA, Karsli C, Bissonnette B. Cerebrovascular reactivity to carbon dioxide is preserved during hypocapnia in children anes- thetized with 1.0 MAC, but not with 1.5 MAC desflurane. Can J Ana- esth 2003; 50: 166-71.
9. Lee YS, Kwon TM, In JY, Woo SH, Yon JH, Kim JW, Choe WJ, Kim KM, Hong KH. Reliability of rSO2to measure CO2reactivity of cerebral vasculatures during desflurane-N2O anesthesia. Korean J Anesthesiol 2002; 43: 288-93.
10. Girling KJ, Cavill G, Mahajan RP. The effects of nitrous oxide and oxygen on transient hyperemic response in human volunteers. Anesth
Analg 1999; 89: 175-80.
11. Reinstrup P, Ryding E, Algotsson L, Berntman L, Uski T. Regional cerebral blood flow (SPECT) during anaesthesia with isoflurane and nitrous oxide in humans. Br J Anaesth 1997; 78: 407-11.
12. Kaisti KK, Langsjo JW, Aalto S, Oikonen V, Sipila H, Teras M, Hink- ka S, Metsahonkala L, Scheinin H. Effects of sevoflurane, propofol, and adjunct nitrous oxide on regional cerebral blood flow, oxygen consumption, and blood volume in humans. Anesthesiology 2003;
99: 603-13.
13. Manohar M, Parks C. Regional distribution of brain and myocar- dial perfusion in swine while awake and during 1.0 and 1.5 MAC isoflurane anaesthesia produced without or with 50% nitrous oxide.
Cardiovasc Res 1984; 18: 344-53.
14. Cho S, Fujigaki T, Uchiyama Y, Fukusaki M, Shibata O, Sumikawa K. Effects of sevoflurane with and without nitrous oxide on human cerebral circulation. Transcranial Doppler study. Anesthesiology 1996; 85: 755-60.
15. Reinstrup P, Ryding E, Ohlsson T, Dahm PL, Uski T. Cerebral blood volume (CBV) in humans during normo- and hypocapnia: influence of nitrous oxide (N2O). Anesthesiology 2001; 95: 1079-82.
16. Karsli C, Luginbuehl IA, Bissonnette B. The effect of nitrous oxide on cerebral blood flow velocity in children anaesthetised with des- flurane. Anaesthesia 2003; 58: 24-7.
17. Manohar M. Regional distribution of porcine brain blood flow during 50% nitrous oxide administration. Am J Vet Res 1985; 46: 831-5.
18. Kannurpatti SS, Biswal BB, Kim YR, Rosen BR. Spatio-temporal characteristics of low-frequency BOLD signal fluctuations in isoflu- rane-anesthetized rat brain. Neuroimage 2008; 40: 1738-47.
19. Weiskopf RB, Eger EI 2nd, Noorani M, Daniel M. Repetitive rapid increases in desflurane concentration blunt transient cardiovascu- lar stimulation in humans. Anesthesiology 1994; 81: 843-9.
20. Everitt B, Rabe-Hesketh S. Analyzing Medical Data Using S-PLUS.
New York: Springer-Verlag, 2001.