INTRODUCTION
Developments in modern medicine have significantly pro- longed the life span of humans. Various preventive medicines and improvements in the treatment of disease have also led to a rapid extension of the anticipated life span of women in Korea. This continuing rise in the average life expectancy has increased the focus on quality of life (QOL) as an important health parameter for the aging population. There are many different measures for assessing QOL, the type chosen being dependent upon the specific situation being evaluated.
Menopause is a condition that is caused by the depletion of ovarian function followed by the cessation of menstruation in women. Most women spend one-third to one-half of their lifetime in postmenopause. The increasing average length of the postmenopausal life span emphasizes the importance of menopause in today’s society.
For middle-aged women, this loss of reproductive capabil- ity is a critical issue that represents the end of fertility and the onset of the aging process. As a result of the lack of estro- gen, women may experience compromised physical well-being during menopause (1), as well as climacteric symptoms, such as mucosal dryness, hot flashes, sweats, and emotional fluc- tuation. Moreover, menopause changes a woman’s self-iden- tity. Therefore, this process and the changes associated with it should be considered when measuring the QOL of post- menopausal women. The Menopause Rating Scale (MRS) is a health-related QOL (HRQOL) scale that was developed in the early 1990s in response to the lack of standardized scales for measuring the severity of the symptoms of aging and their impact on the HRQOL. The MRS is known to be a standard- ized HRQOL scale with good psychometric characteristics.
The severity of menopausal symptoms, as measured using the MRS, is known to clearly reflect the profile of the QOL
758
Moon-Soo Lee1,2, Jong-Hun Kim1, Man Sik Park3, Jaewon Yang1,2, Young-Hoon Ko1,2, Seung-Duk Ko4, and Sook-Haeng Joe1,2
Department of Psychiatry1, Korea University Research Institute of Mental Health2; Department of Biostatistics3, Korea University, College of Medicine, Seoul;
Department of Health Management4, Hyupsung University, Hwaseong, Korea
Address for Correspondence Sook-Haeng Joe, M.D.
Department of Psychiatry, Korea University, College of Medicine, Guro Hospital, 97 Gurodong-gil, Guro-gu, Seoul 152-703, Korea
Tel : +82.2-2626-3161, Fax : +82.2-920-5818 E-mail : [email protected]
Factors Influencing the Severity of Menopause Symptoms in Korean Post-menopausal Women
We have relatively limited knowledge of symptomatic aspects of the postmeno- pause, rather than perimenopause. We tried to determine the factors associated with experiencing menopausal symptoms by Korean postmenopausal women. A total of 657 Korean women who underwent a natural menopause completed multi- ple questionnaires, which included questions regarding their attitudes to menopause, depressive symptoms, state anxiety, self-esteem, dyadic relationships, sociode- mographic variables, and 11-item Menopause Rating Scale (MRS). Multiple regres- sion analyses were performed to collectively examine the relative impact of each independent variable on the quality of life, as determined by the MRS. Decreased severity of menopausal symptoms was associated with more time spent in educa- tion, an employed status, a history of pregnancy, longer postmenopausal duration, positive attitudes to menopause, higher state anxiety, heightened self-esteem, and higher dyadic consensus. Increased severity of menopausal symptoms was also associated with absence of a partner, alcohol consumption, a history of hormone replacement therapy, a history of probable premenstrual dysphoric disorder, and increased severity of depressive symptoms. Sociodemographic characteristics, lifestyle factors, premenstrual dysphoric disorder, attitudes to menopause, a dyadic relationship with a partner, and the inner psychological status can be associated with the severity of menopause symptoms specifically in Korean postmenopausal women.
Key Words : Menopausal Symptoms; Postmenopausal Women; Dyadic Relationship
Received : 10 June 2009 Accepted : 8 October 2009
ⓒ 2010 The Korean Academy of Medical Sciences.
This is an Open Access article distributed under the terms of the Creative Commons Attribution Non-Commercial License (http://creativecommons.org/licenses/by-nc/3.0) which permits unrestricted non-commercial use, distribution, and reproduction in any medium, provided the original work is properly cited.
dimensions of the Short-Form-36; it can therefore be used to measure the QOL of postmenopausal women (2).
Many factors can affect the experience of menopausal symp- toms, and the study of these symptoms is biopsychosocial.
The symptoms are biological, but the perception of meno- pausal symptoms is related to a woman’s subjective experi- ence or the manifestation of some underlying physical, psy- chological, or social dysfunction (2). The perception of meno- pause is also clearly influenced by the broader social and cul- tural contexts in which such normative biological events are embedded (3). Thus, evaluating these aspects might be help- ful in gauging the effects of experiencing menopausal symp- toms. Demographic characteristics, psychosocial and lifestyle factors are important determinants for postmenopausal symp- toms.
As there are dramatic hormonal changes during the peri- menopause period, perimenopause has been a main themes in research. Although there are some studies about the meno- pausal symptoms in Korean women (4-7), most papers focused on the middle-aged or peri-menopausal women. At this time, the prevalence of postmenopausal symptoms in older post- menopausal women has not been well documented, and pre- dictors of symptoms in older postmenopausal women have not been examined. We have specifically targeted for the post- menopausal women who already experienced a natural meno- pause. The purpose of this study was thus to determine the collective influence of many factors on the experience of meno- pausal symptoms in a group of postmenopausal women in a Korean urban community. A major focus of the analysis was the potential role of many psychological factors (i.e., anxiety, depression, self-esteem, and a dyadic relationship with a part- ner) and sociodemographic factors on severity of menopause symptoms.
MATERIALS AND METHODS Participants and procedure
This research was conducted in an urban area of Korea (Hwaseong City, Gyeonggi-do) in 2005. Consecutive women aged between 41 and 59 yr were recruited into this cross-sec- tional study, which formed part of a community-based men- tal health survey performed by the Department of Health Management, Hyupsung University. Surveys and postage- paid return envelopes were mailed to the parents of univer- sity students. Included in this mail were details on the pur- pose of the study and instructions for completion of the anony- mous self-administered survey. Only age-eligible mothers who were in the postmenopausal state were selected for this study and completed the questionnaire, which included a checklist regarding basic epidemiological data, and the self- reported assessment tools listed below. The study was approved by the Institutional Review Board of Korea University Medi-
cal Center, Guro hospital.
Measures
The epidemiological variables included in the analysis were those thought to affect the experience of postmenopausal symptoms: age, educational level, religious status, marital status, occupational status, a history of drinking consump- tion, a history of pregnancy, hormone replacement therapy, and possibility of having premenstrual dysphoric disorder (PMDD). In the case of probable PMDD, we acquired more detailed information on past existence of PMDD by request- ing that the respondent complete a questionnaire compris- ing 11 items derived from the Diagnostic and Statistical Man- ual of Mental Disorders, fourth edition (DSM-IV) criteria of PMDD. We regarded participants as having had a probable PMDD if they reported at least 5 of the 11 symptoms requir- ed for its diagnosis, with 1 of the 5 being mood symptoms that are characterized by depression, anxiety, irritability, or mood lability.
The MRS (8): There is some evidence of the ability of the MRS to measure treatment effects on the QOL across the full range of complaint severity among aging women. The sever- ity of menopausal symptoms best reflects the profile of the QOL dimension. The MRS comprises a list of 11 items (symp- toms or complaints), the severity of which can be scored on a scale of 0-4, where 0 means no complaints and 4 reflects severe symptoms. Three independent dimensions exist in this scale: the psychological, somatovegetative, and urogenital subscales. The subscale score for each dimension is based on adding up the scores of each item. The total score is the sum of the subscale scores. The mean values and standard devia- tion of MRS total score and 3 domains in a large, multina- tional survey were as follows: Europe-psychological, 3.4± 3.4, somatovegetative, 3.6±2.9, urogenital, 1.9±2.2, total, 8.8±7.1; North America-psychological, 3.4±3.5, soma- tovegetative, 3.8±3.1, urogenital, 2.0±2.3, total, 9.1± 7.6; Latin America-psychological, 4.9±4.5, somatovegeta- tive, 4.1±3.6, urogenital, 1.4±2.2, total, 10.4±8.8 (mean
±standard deviation values) (8). Cronbach’s alpha in this study was 0.861.
Attitudes to menopause: The questionnaire content was based partly on the menopause attitude scale developed by Bowles and modified by Khademi and Cooke (9). Original- ly, the participant selected one of the four of five scaled res- ponses, and the maximum score was 36. In the previous study, mean rural and urban total score was 18.80 and 20.30, each (9). We have revised the scale. All of the items are scored on a 5-point Likert scale from 1 to 5, whereby a higher score indi- cates a more-positive response. The total score of the attitudes to menopause was calculated by adding up the points for the responses to all the questions. The scores could range from 8 (most negative) to 40 (most positive). Cronbach’s alpha in this study was 0.655.
The Beck Depression Inventory (BDI) (10): The BDI is a 21-item self-reported instrument that was designed to mea- sure the severity of depression. There are four response options for each item, ranging from 0 to 3. The Korean version of BDI is known to have good validity and reliability.
The Spielberger State-Trait Anxiety Inventory-State (STAI- S) score (11): The State-Trait Anxiety Inventory is a measure of both the state and trait anxieties, and the STAI-S has demon- strated both validity and reliability. For this study, only the state subscale was used, and this comprised 20 statements that assess the current situational anxiety. The STAI-S mea- sures the transitional emotional status evoked by a stressful situation, like experiencing menopausal symptoms. The res- pondents can respond to each statement with a score rang- ing from 1 to 4, where higher scores indicate higher levels of state anxiety. The Korean version of STAI was developed and widely in use. It is also used in the current study.
The Rosenberg Self-Esteem Scale (RSES) (12): Self-esteem was measured by the Korean version of the RSES. The RSES contains ten items. The total score can range from 10 to 40;
a higher score indicates a higher level of self-esteem. The Kore- an version of the Rosenberg Self-Esteem Questionnaire was also used in other study. The RSES score ranged from 16 to 34 in the previous study (mean=24.88, standard deviation=
3.22) (13). Cronbach’s alpha in this study was 0.829.
The Revised Dyadic Adjustment Scale (RDAS) (14): This is a 14-item self-reported questionnaire that was derived from the original Spanier Dyadic Adjustment Scale. It comprises three subscales that measure marital consensus, satisfaction, and cohesion. A higher score indicates better marital param- eters. The mean values and standard deviation of RDAS total score and subscales in the previous study were as follows:
dyadic consensus, 22.6±4.0; dyadic satisfaction, 14.3±3.1;
dyadic cohesion, 11.1±3.4; total RDAS, 48.0±9.0 (mean
±standard deviation values) (14). Cronbach’s alpha in this study was 0.873.
Statistical analysis
Statistical analyses were performed with the Statistical Pack- age for the Social Sciences (SPSS) software (version 12.0; SPSS, Chicago, IL, USA). Analyses included descriptive statistics to examine the general characteristics of the respondents.
Pearson’s correlation analysis was used to examine the afore- mentioned measures. Finally, multiple linear regression anal- ysis was performed to examine collectively the relative impact of each independent variable on the QOL expressed by the MRS. Four multiple linear regression analyses were employed using the subscale scores and the total score of the MRS as dependent variables. For the categorical variables, dichoto- mous dummy variables were created by combining the cat- egories and entering them into the regression analysis as fol- lows: education (0=under middle school, 1=at least high school), religion (0=none, 1=believer), marital status (0=
married, 1=divorced/separated or widowed/single), occupa- tion (0=unemployed, 1=employed), economic status (0=
monthly income under 3 million Korean won, 1=monthly income over 3 million Korean won), smoking (0=never, 1=
currently or previously), alcohol consumption (0=never, 1=
currently or previously), a history of pregnancy (0=no, 1=
yes), a history of hormone replacement therapy (0=no, 1=
yes), and a history of probable PMDD (0=no, 1=yes). All of
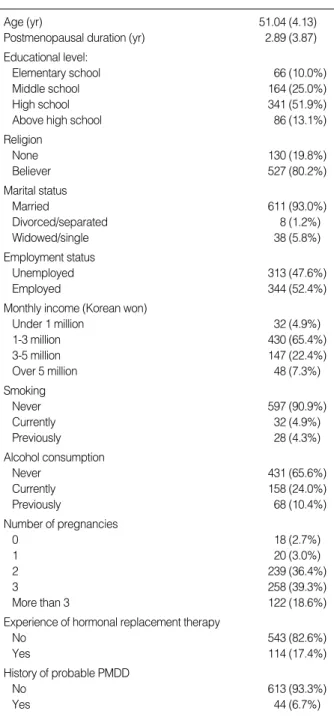
All data are presented as n (%) values, except for age and postmeno- pausal duration, which are presented as mean (SD) values.
PMDD, premenstrual dysphoric disorder.
Age (yr) 51.04 (4.13)
Postmenopausal duration (yr) 2.89 (3.87) Educational level:
Elementary school 66 (10.0%)
Middle school 164 (25.0%)
High school 341 (51.9%)
Above high school 86 (13.1%)
Religion
None 130 (19.8%)
Believer 527 (80.2%)
Marital status
Married 611 (93.0%)
Divorced/separated 8 (1.2%)
Widowed/single 38 (5.8%)
Employment status
Unemployed 313 (47.6%)
Employed 344 (52.4%)
Monthly income (Korean won)
Under 1 million 32 (4.9%)
1-3 million 430 (65.4%)
3-5 million 147 (22.4%)
Over 5 million 48 (7.3%)
Smoking
Never 597 (90.9%)
Currently 32 (4.9%)
Previously 28 (4.3%)
Alcohol consumption
Never 431 (65.6%)
Currently 158 (24.0%)
Previously 68 (10.4%)
Number of pregnancies
0 18 (2.7%)
1 20 (3.0%)
2 239 (36.4%)
3 258 (39.3%)
More than 3 122 (18.6%)
Experience of hormonal replacement therapy
No 543 (82.6%)
Yes 114 (17.4%)
History of probable PMDD
No 613 (93.3%)
Yes 44 (6.7%)
Table 1. Basic epidemiological characteristics of the participants (n=657)
the statistical results reported in this paper are based on two- sided tests, and the level of statistical significance was set at P<0.05.
RESULTS Description of the samples
A total of 802 women consented to participate in the pro- ject and completed the questionnaire. Among these, 145 had experienced artificially induced menopause (12 by chemical means and 133 by surgical means). Only women who expe- rienced natural menopause were included, and hence the data from a final total of 657 women were analyzed. The mean age of these subjects was 51.04 yr (range: 41-59 yr). The basic
epidemiological data are given in Table 1, while Table 2 pre- sents the results of each self-reported instrument (the BDI, MRS, STAI-S, RSES, and RDAS).
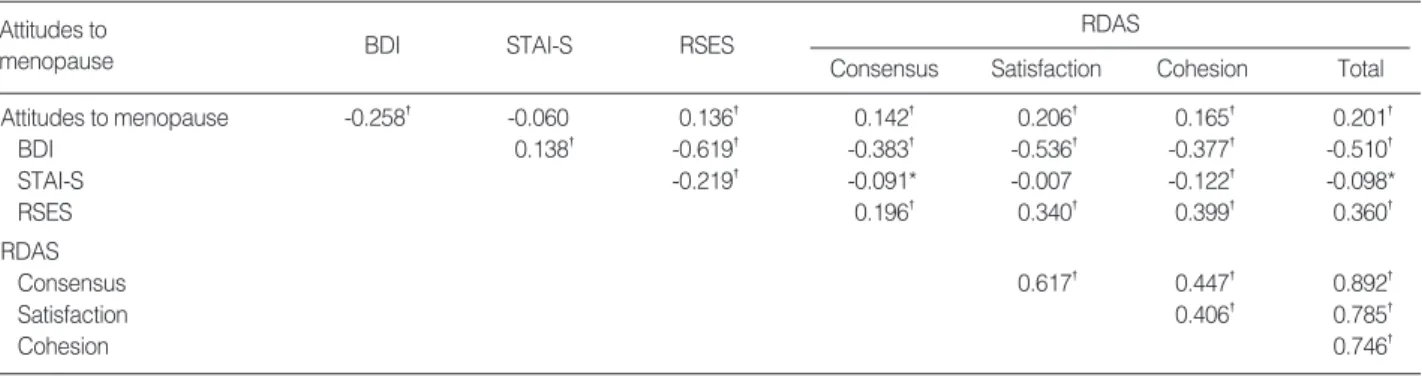
Correlations between attitudes to menopause and scores on the BDI, STAI-S, RSES, and RDAS
Attitude to menopause significantly negatively correlated with BDI score (r=-0.258, P<0.01) and positively correlated with RDAS consensus (r=0.142, P<0.01), RDAS satisfac- tion (r=0.206, P<0.01), RDAS cohesion (r=0.165, P<0.01), and RDAS total score (r=0.201, P<0.01). The BDI score neg- atively correlated with the RSES score (r=-0.619, P<0.01), RDAS consensus (r=-0.383, P<0.01), RDAS satisfaction (r=
-0.536, P<0.01), RDAS cohesion (r=-0.377, P<0.01), and RDAS total score (r=-0.510, P<0.01). The STAI-S score neg- atively correlated with the RSES score (r=-0.219, P<0.01).
The RSES score positively correlated with RDAS consensus (r=0.196, P<0.01), RDAS satisfaction (r=0.340, P<0.01), RDAS cohesion (r=0.399, P<0.01), and the RDAS total score (r=0.360, P<0.01) (Table 3).
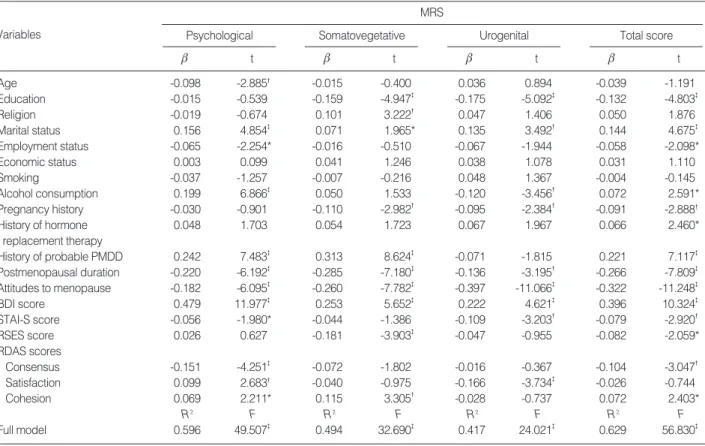
Multiple linear regression analyses using MRS scores as dependent variables
All of the variables were included in the multiple linear regression analyses. The number of educational years, mari- tal status, occupational status, the alcohol consumption sta- tus, a history of pregnancy, a history of hormone replacement therapy, a probable history of PMDD, the postmenopausal duration, the total score of attitudes to menopause, and the BDI, STAI-S, RSES, and RDAS scores all made significant contributions to predicting menopause symptoms. However, age, the smoking status, and the subject’s current economic status did not predict the QOL as defined by the MRS score (Table 4).
Instruments Scores
Total score of the attitudes to menopause 23.83 (3.84)
BDI 10.70 (7.71)
MRS score
Psychological 3.34 (2.31)
Somatovegetative 3.66 (2.22)
Urogenital 1.97 (1.66)
Total 8.97 (5.15)
STAI-S score 39.12 (5.80)
RSES 27.12 (4.37)
RDAS
Consensus 21.00 (5.06)
Satisfaction 13.90 (2.81)
Cohesion 7.73 (3.64)
Total 42.63 (9.43)
Table 2. Scores for each instrument
Data are mean (standard deviation) values.
BDI, Beck Depression Inventory; MRS, Menopause Rating Scale; STAI- S, Spielberger State-Trait Anxiety Inventory-State; RSES, Rosenberg Self- Esteem Scale; RDAS, Revised Dyadic Adjustment Scale.
*P<0.05; �P<0.01.
BDI, Beck Depression Inventory; STAI-S, Spielberger State-Trait Anxiety Inventory-State; RSES, Rosenberg Self-Esteem Scale; RDAS, Revised Dyadic Adjustment Scale.
Attitudes to
menopause BDI STAI-S RSES RDAS
Total Cohesion
Satisfaction Consensus
Attitudes to menopause -0.258� -0.060 0.136� 0.142� 0.206� 0.165� 0.201�
BDI 0.138� -0.619� -0.383� -0.536� -0.377� -0.510�
STAI-S -0.219� -0.091* -0.007 -0.122� -0.098*
RSES 0.196� 0.340� 0.399� 0.360�
RDAS
Consensus 0.617� 0.447� 0.892�
Satisfaction 0.406� 0.785�
Cohesion 0.746�
Table 3. Correlation analysis among attitudes to menopause and BDI, STAI-S, RSES, and RDAS scores
DISCUSSION
Menopause can be precipitated by various conditions. In a prospective study of approximately 2,500 premenopausal women, depression was associated with surgical menopause;
however, natural menopause changes were reported to have no association with depression (15). Since there are differences between the natural course and an artificial cause in the phe- nomenology of menopause, we selected for this study only those women who had experienced natural menopause.
MRS is a commonly used QOL measure for menopause.
The mean values of the MRS total scores and three domains have been reported in a multinational survey by Heinemann et al. (8). We reported that MRS scores in Korean postme- nopausal women (psychological, 3.34±2.31; somatovege- tative, 3.66±2.22; urogenital, 1.97±1.66; total, 8.97±5.15;
mean±SD values) were lower than those found in other stud- ies performed in North America and Latin America. How- ever, since ours was an independent study and the perception of postmenopausal symptoms is known to be influenced by cultural factors (16), caution is required when comparing our results with those of other international studies.
Women learn to respond to menopause in culturally depen- dent manners (17). Some studies have suggested that the youth-centered culture of the Western world considers meno- pause as a disease (9). Conversely, menopausal symptoms have been found to be less common in societies where meno- pause is viewed as a positive rather than a negative event (17).
Studies of mid-life women in some non-Western societies have suggested that a more positive orientation toward meno- pause and aging in those societies in part accounts for their relatively low symptom level.
Data are standardized regression coefficients (b), which indicate the relative magnitude of prediction for each independent variable. All independent variables were entered simultaneously into a multiple linear regression model, with the explained amount of variance (adjusted R2) for each menopause symptom rating dimension. In cases of categorical variables, dichotomous dummy variables were created by combining the categories, and these were entered into the regression analysis as follows: education (0=under middle school, 1=at least high school), religion (0=none, 1=believer), mari- tal status (0=married, 1=divorced/separated or widowed/single), occupation (0=unemployed, 1=employed), economic status (0=monthly income under 3 million Korean won, 1=monthly income over 3 million Korean won), smoking (0=never, 1=currently or previously), alcohol consumption (0=never, 1=currently or previously), pregnancy history (0=no, 1=yes), history of hormone replacement therapy (0=no, 1=yes), and history of probable PMDD (0=no, 1=yes).
*P<0.05; �P<0.01; �P<0.001.
MRS, Menopause Rating Scale; PMDD, Premenstrual Dysphoric Disorder.
Variables
MRS Psychological
t b
Somatovegetative t b
Urogenital t b
Total score t b
Age -0.098 -2.885� -0.015 -0.400 0.036 0.894 -0.039 -1.191
Education -0.015 -0.539 -0.159 -4.947� -0.175 -5.092� -0.132 -4.803�
Religion -0.019 -0.674 0.101 3.222� 0.047 1.406 0.050 1.876
Marital status 0.156 4.854� 0.071 1.965* 0.135 3.492� 0.144 4.675�
Employment status -0.065 -2.254* -0.016 -0.510 -0.067 -1.944 -0.058 -2.098*
Economic status 0.003 0.099 0.041 1.246 0.038 1.078 0.031 1.110
Smoking -0.037 -1.257 -0.007 -0.216 0.048 1.367 -0.004 -0.145
Alcohol consumption 0.199 6.866� 0.050 1.533 -0.120 -3.456� 0.072 2.591*
Pregnancy history -0.030 -0.901 -0.110 -2.982� -0.095 -2.384� -0.091 -2.888�
History of hormone 0.048 1.703 0.054 1.723 0.067 1.967 0.066 2.460*
replacement therapy
History of probable PMDD 0.242 7.483� 0.313 8.624� -0.071 -1.815 0.221 7.117�
Postmenopausal duration -0.220 -6.192� -0.285 -7.180� -0.136 -3.195� -0.266 -7.809�
Attitudes to menopause -0.182 -6.095� -0.260 -7.782� -0.397 -11.066� -0.322 -11.248�
BDI score 0.479 11.977� 0.253 5.652� 0.222 4.621� 0.396 10.324�
STAI-S score -0.056 -1.980* -0.044 -1.386 -0.109 -3.203� -0.079 -2.920�
RSES score 0.026 0.627 -0.181 -3.903� -0.047 -0.955 -0.082 -2.059*
RDAS scores
Consensus -0.151 -4.251� -0.072 -1.802 -0.016 -0.367 -0.104 -3.047�
Satisfaction 0.099 2.683� -0.040 -0.975 -0.166 -3.734� -0.026 -0.744
Cohesion 0.069 2.211* 0.115 3.305� -0.028 -0.737 0.072 2.403*
R2 F R2 F R2 F R2 F
Full model 0.596 49.507� 0.494 32.690� 0.417 24.021� 0.629 56.830�
Table 4. Relationships between the demographics, attitudes to menopause, the depressive and anxious symptoms, self-esteem, and dyadic adjustment to the dimensions of the MRS
As depressive symptoms became more severe, our partici- pants reported more negative attitudes to menopause, lower self-esteem, and poorer dyadic consensus with their partners.
The relationship between depression and self-esteem has been studied (18). The present study showed that depression is also closely related to self-esteem among Korean postmenopausal women. The relationship between depression and marital adjustment in a nonclinical sample has been reported previ- ously by Trevino et al. (19), who found a negative correlation between depression scores and dyadic consensus scores. Our study, which was performed on postmenopausal women, also replicated these findings, demonstrating a correlation bet- ween depressive symptoms and dyadic relationships.
Women who experience low or unstable self-esteem often experience feelings of anxiety (20), as was shown in the pre- sent study by the negative correlation between the STAI-S and RSES scores. The RSES score was significantly correlat- ed with the RDAS subscale/total scores. Self-esteem was pre- viously reported to respond to other people’s evaluations, since the self-esteem system monitors the degree to which other people accept versus reject the individual in the sociometer theory (21). Self-esteem is closely correlated with the level of satisfaction achieved from the dyadic relationship. The find- ings of the present study support those results. The satisfac- tion of women with the dyadic relationship increased with their self-esteem.
Many studies have investigated the relationships between menopausal symptoms and each influential factor. A study performed in Taiwan found that educated women expressed that they had more problems with menopause compared to less-educated women (22). Other studies have indicated that well-educated women hold a more positive attitude regard- less of being from an Eastern or Western culture (23). Our study was performed on women living in an urbanized Kore- an area, and found that women who have been educated for longer report milder menopausal symptoms.
A study that was performed on urban Australian-born, mid- dle-aged women showed that a stable marital status that in- cluded a partner was significantly related to higher well-being scores (24). In the present study, women who did not have a partner (i.e., they were separated, divorced, widowed, or sin- gle) also had higher MRS symptom scores.
Employment status significantly affected the experience of menopause symptoms. There may be several explanations for this. Employment may act as a stress buffer for some women who are approaching menopause (25). Employed women also seem to have more opportunities for self-realization outside the home and thus report milder menopause symptoms. This suggests that employment status influences the psychologi- cal condition, and that being in employment changes the experience of menopause symptoms favorably.
While smoking was not linked to the severity of menopause symptoms, alcohol consumption significantly predicted the severity of menopause symptoms. Alcohol consumption was
related to psychological and urogenital symptoms, but not to somatovegetative symptoms. Women who consumed alco- hol reported higher psychological scores but lower urogeni- tal symptom scores. We can assume that the relationship bet- ween consuming alcohol and the severity of menopause symp- toms varies according to the amount of alcohol ingested and the type of menopausal symptom. The measurement of this lifestyle factor is relatively crude and a much more detailed examination of alcohol use is needed.
A history of PMDD significantly predicted MRS scores.
Premenstrual symptoms were reported to be a predictor of menopausal symptoms. It has been reported that women with premenstrual syndrome are more likely to report menopausal hot flushes (26). We tried to retrospectively identify women who had a history of probable PMDD with the criteria from the DSM-IV; those who were designated as having probable PMDD in the past reported higher MRS scores.
A longer duration of menopause was related to lower MRS scores. Women who have had more time to adapt to the chan- ges caused by menopause adjust their perceptions of meno- pause symptoms and report a lower severity of those symp- toms.
Attitude to menopause is known to influence the severity of specific menopausal symptoms (27). A positive attitude to menopause was reported to produce minimal symptoms, while a negative attitude seems to produce full menopausal syndrome. Attitude to menopause has also been reported to be associated with the reporting of menopausal symptoms.
It has been shown that women with a negative attitude to menopause have associations with more frequently reported symptoms compared to women with a positive attitude (28).
Our study also showed that attitudes to menopause signifi- cantly predicted the severity of menopause symptoms: the more positive the attitude, the lower MRS subscale/total scores.
This finding is in line with those of previous studie (28).
The inner psychological status is closely related to the per- ception of menopausal symptoms. In a previous Korean study, a positive correlation was found between depression and cli- macteric symptoms in postmenopausal women when depres- sion was measured using BDI (4). We found the BDI score of a nonclinical sample to be 10.70±7.71 (mean±SD). This means that the subjects as a whole did not have clinically mean- ingful depressive symptoms. There was a significant corre- lation between the BDI symptom scores and all of the sub- scale and the total MRS scores although those depressive symp- toms are not clinically severe enough to merit a diagnosis as a depressive disorder.
The relationship between self-esteem and menopausal symp- toms has been studied previously. It was noted that the higher the self-esteem, the lower the perceived severity of menopausal symptoms. High self-esteem is associated with high satisfac- tion with one’s own body (27). Accordingly, high satisfaction might be related to lower menopausal symptoms scores.
Menopause symptoms-based complaints by middle-aged
women were negatively correlated with sexual satisfaction in Korean reports (5, 6). Sexual communication satisfaction was reported to be significantly associated with dyadic con- sensus, satisfaction and cohesion (29). As a result, we can sug- gest the relationship between menopausal symptoms and dyadic relations. Lam et al. (30) reported that Green Climac- teric Scale scores were negatively correlated with their Chi- nese Dyadic Adjustment Scale scores. In the present study, there was also a negative correlation between the MRS total scores and dyadic consensus subscale scores when we direct- ly investigated the correlations between menopausal symp- toms experience and dyadic relation. It is interesting to note that the direction of correlation was different between dyadic consensus and dyadic cohesion subscale scores. This may be due, in part, to the small amount of variance in menopausal symptoms explained by each dyadic subscale score. While the relationship between menopausal symptoms and dyadic relations is felt to be important clinically, it may be more difficult to demonstrate this statistically. This is supported by the large number of other variables believed to be related to symptoms.
The findings should be cautiously interpreted in light of several study limitations. First, this report is based on a cross- sectional design. A prospective study would be more appro- priate for a more accurate assessment of predictors. Second, the severity of symptoms investigated by this study was con- fined to self-reported data. However, some of the self-report measures were not validated in Korean languages although authors tried to assess the internal consistency with Cronbach’s alpha.
In conclusion, this population-based study of urban Korean women with natural-menopause finds that sociodemographic characteristics, lifestyle factors, a dyadic relationship with a partner, and inner psychological status can be associated with the severity of menopause symptoms. Clinicians should dis- cuss systematically the issue of psychological well-being when evaluating menopausal symptoms in postmenopausal women.
Demonstrating the direction of causality will require further prospective data.
REFERENCES
1. Fuh JL, Wang SJ, Lee SJ, Lu SR, Juang KD. Quality of life and menopausal transition for middle-aged women on Kinmen island.
Qual Life Res 2003; 12: 53-61.
2. Schneider HP. The quality of life in the post-menopausal woman.
Best Pract Res Clin Obstet Gynaecol 2002; 16: 395-409.
3. Papini DR, Intrieri RC, Goodwin PE. Attitude toward menopause among married middle-aged adults. Women Health 2002; 36: 55-68.
4. Lee YW. Depression in post menopausal women. J Korean Acad Nurs 2003; 33: 471-7.
5. Yeun EJ, Kwon YM, Song MS, Ahn OH, Kim BS. Correlational study on health behaviors, menopausal symptoms and sexual satis-
faction in Korean middle-aged women. J Korean Acad Adult Nurs 2004; 16: 502-12.
6. Cha BK. Relationship between climacteric symptoms and sexual satisfaction in middle-aged women. J Korean Acad Fundam Nurs 2003; 10: 283-91.
7. Kim YH, Ha EH, Shin SJ. A study on the menopausal symptoms and quality of life in middle aged women. J Korean Acad Nurs 2003;
33: 601-8.
8. Heinemann K, Ruebig A, Potthoff P, Schneider HP, Strelow F, Heine- mann LA, Do MT. The Menopause Rating Scale (MRS) scale: a methodological review. Health Qual Life Outcomes 2004; 2: 45.
9. Khademi S, Cooke MS. Comparing the attitudes of urban and rural Iranian women toward menopause. Maturitas 2003; 46: 113-21.
10. Hahn HM, Yum TH, Shin YW, Kim KH, Yoon DJ, Chung KJ. A standardization study of Beck Depression Inventory in Korea. J Korean Neuropsychiatr Assoc 1986; 25: 487-500.
11. Kim JT, Shin DK. A study based on the standardization of the STAI for Korea. New Med J 1978; 21: 69-75.
12. Chon SJ. A study on depression & self-esteem of the elderly in Kore- an. Red Cross College of Nurs Res 1988; 10: 125-44.
13. An JY, An K, O'Connor L, Wexler S. Life satisfaction, self-esteem, and perceived health status among elder Korean women: focus on living arrangements. J Transcult Nurs 2008; 19: 151-60.
14. Busby DM, Christensen C, Crane DR, Larson JH. A revision of the dyadic adjustment scale for use with distressed and nondistressed couples: construct hierarchy and multidimensional scales. J Mari- tal Fam Ther 1995; 21: 289-308.
15. McKinlay JB, McKinlay SM, Brambilla D. The relative contribu- tions of endocrine changes and social circumstances to depression in mid-aged women. J Health Soc Behav 1987; 28: 345-63.
16. Lock M. Menopause in cultural context. Exp Gerontol 1994; 29:
307-17.
17. Pan HA, Wu MH, Hsu CC, Yao BL, Huang KE. The perception of menopause among women in Taiwan. Maturitas 2002; 41: 269-74.
18. Brown GW, Bifulco A, Veiel HO, Andrews B. Self-esteem and de- pression. II. Social correlates of self-esteem. Soc Psychiatry Psychi- atr Epidemiol 1990; 25: 225-34.
19. Trevino YA, Wooten HR, Scott RE. A correlational study between depression and marital adjustment in hispanic couples. The Family Journal 2007; 15: 46-52.
20. Deeks AA. Psychological aspects of menopause management. Best Pract Res Clin Endocrinol Metab 2003; 17: 17-31.
21. Leary MR, Baumeister RF. The nature and function of self-esteem:
sociometer theory. In: Zanna MP, ed. Advances in experimental social psychology: Academic Press, New York, NY. 2000: 1-62.
22. Cheng MH, Wang SJ, Wang PH, Fuh JL. Attitudes toward meno- pause among middle-aged women: a community survey in an island of Taiwan. Maturitas 2005; 52: 348-55.
23. Chen YL, Voda AM, Mansfield PK. Chinese midlife women’s per- ceptions and attitudes about menopause. Menopause 1998; 5: 28-34.
24. Dennerstein L, Smith AM, Morse C. Psychological well-being, mid- life and the menopause. Maturitas 1994; 20: 1-11.
25. Hunter MS. Psychological and somatic experience of the menopause:
a prospective study [corrected]. Psychosom Med 1990; 52: 357-67.
26. Freeman EW, Sammel MD, Rinaudo PJ, Sheng L. Premenstrual syndrome as a predictor of menopausal symptoms. Obstet Gynecol 2004; 103: 960-6.
27. Bloch A. Self-awareness during the menopause. Maturitas 2002;
41: 61-8.
28. Sievert LL, Espinosa-Hernandez G. Attitudes toward menopause in relation to symptom experience in Puebla, Mexico. Women Health 2003; 38: 93-106.
29. Cupach WR, Comstock J. Satisfaction with sexual communication in marriage-links to sexual satisfaction and dyadic adjustment. J Soc Personal Relationships 1990; 7: 179-86.
30. Lam PM, Cheung GW, Shek DT, Lee DT, Haines C, Chung TK.
Psychological well-being and the dyadic relationship of Chinese menopausal women (and their spouses) attending hormone replace- ment clinics. Gynecol Endocrinol 2004; 18: 206-11.