─ 325 ─ ISSN: 2288-1115 (Print), 2288-1123 (Online)
ⓒ The Korean Society of Limnology. All rights reserved.
This is an open-access article distributed under the terms of the Creative Commons Attribution Non-Commercial License (http://creativecommons.org/licenses/by-nc/3.0/), which permits unrestricted non-commercial use, distribution, and reproduction in any medium, provide the original work is properly cited.
INTRODUCTION
The various environmental factors in the stream ecosys- tem constantly changed and influenced on their lives while the water flows, so the number of species and individuals of the lives would be changed. The stream ecosystem consists of the abiotic factors such as substrate of river bed, veloc- ity of flow, water quality and biotic factors such as fish, algae, etc. The interaction among these environmental fac- tors makes the unique structure and function in the stream
ecosystem (Hynes, 1970; Vannote et al., 1980; Horne and Goldman, 1994; Allan, 1995).
Biotic communities in the stream ecosystem showed the structure and functional difference of individuals or groups by natural changes and artificial changes, so analyses for them were useful to assess the influence of environment changes about water system. Benthic macroinvertebrates are good indicator organisms for biomonitoring water qual- ity (Rosenberg and Resh, 1993). They live in the freshwater ecosystem abundantly and have small area of movement, so the analyses by quantitative sampling are easy. They have enough long life cycle to reflect the water environment con- ditions and various reaction according to water environment changes (Yoon et al., 1981, 1992; Kim et al., 2005; Won et
Community Structure of Benthic Macroinvertebrate Affected by Lake Water and Sewage Effluent at Urban Stream in
Gwangju, Korea
Yoon, Sang-Hoon * (0000-0001-6294-2077) , Suk-Kyeong Jung (0000-0003-4159-7360) , Gwang-Yeob Seo (0000-0002-4861-5595) and Young-Gwan Cho (0000-0002-9045-1387) Health & Environment Research Institute of Gwangju, Gwangju 61986, Republic of Korea
Abstract The ecosystem in the Gwangju Stream has taken a wide range of disturbance such as the discharging water of sewage treatment plant, the lake water and the river water from different water system over the past decade. This study was figured out some significant influence factors by analyzing the relationship between biotic and abiotic factors in the urban stream. Abiotic components included 15 water quality variables which were measured in five sampling sites along the stream from October 2014 to July 2015, whereas the benthic macroinvertebrates found in those sites were used to estimate various biotic indices representing the ecological status of the community. The results of correlation analyses indicated that abiotic factors by human activities affected on the inhabitation of benthic macroinvertebrates more than biotic factors. The results of cluster analyses and ANOVA tests also showed that biotic and abiotic characteristics were clearly different in season.
The main influence factors of cluster analysis by sites were NH
3-N, EPT(I) and DO. It was considered that more various statistical analyses would be necessary to find some different relationships and influence factors between biotic and abiotic variables in the urban stream.
Key words: urban stream, macroinvertebrates, correlation, cluster analyses, ANOVA
Manuscript received 13 June 2017, revised 31 July 2017, revision accepted 1 August 2017
* Corresponding author: Tel: +82-62-613-7586, Fax: +82-62-613-7620,
E-mail: [email protected]
al., 2006; Lee et al., 2009). Changes of organic materials entering from the outside to the stream according to natural or artificial environment changes could affect on inhabi- tation and community structure of benthic macroinverte- brates (Cummins and Klug, 1979; Merritt and Cummins, 1996; Bae et al., 2003). Recently the studies of indicator organisms and biotic index are carried out and introduced to be the river management method. Furthermore, biotic water quality assessment method using benthic macroin- vertebrates was made and river ecosystem health has been assessed by it (Won et al., 2006).
Gwangju Stream having 106.5 km
3of basin area, 22.8 km of stream length is an tributary of Yeongsan River. It was a typical urban stream to have water pollution according to rapid urbanization since 1970’s, purification project of water pollution and public park project. The reprocessing and discharging water of the sewage treatment plant (STP), the lake water of Juam reservoir and the river water of the Yeongsan River has been discharged to secure the stream maintenance water into the dry Gwangju Stream. The dis- charging water of STP had been discharged to Gwangju Stream since 1990, had been discharged more since 2009 additionally. The lake water of Juam reservoir had been dis- charged to Gwangju Stream since 2012. Gwangju Stream had a certain amount of flowing water by these projects and showed some positive effects such as the improvement of water quality and aesthetic landscape, the solution of ther- mal island effect and so on. Meanwhile the maintenance and restoration aspects of water ecosystem was considered little. Generally in case of the urban stream that human in- fluence was focused on, it was said that biological diversity was very low and a few specific species was dominant as water quality deteriorated (Allan, 1995). The water pollut- ants such as biological oxygen demand, total phosphorus and so on had been controlled by mandatory regulation.
But the investigation on the biological influence by the dis- charging water of STP was a little in the Gwangju Stream.
The objective of this study was to figure out the actual condition of the water environment on the Gwangju Stream as a urban stream by comparing and analyzing the physico- chemical water quality, distribution and community struc- ture of benthic macroinvertebrates. In addition, we tried to find some significant influence factors of water environ- ment statistically by understanding relationship biological
results with environmental variables using statistical analy- ses.
MATERIALS AND METHOD 1. Survey period and study sites
Field investigations were conducted four times from 30
thOctober 2014, 4
thFebruary 2015, 22
ndApril 2015, 30
thJuly 2015 considering the eclosion period of benthic macroin- vertebrates and the characteristics of seasonal communities.
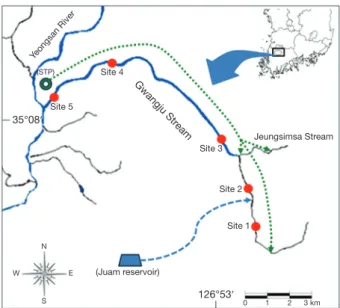
The study sites of this survey was five sites (Site 1 to site 3 was located in upper, Site 4 was in middle and Site 5 was in lower reaches) that were selected by considering the river water quality monitoring network of Korea government and the river maintenance water flowing in the Gwangju Stream (Fig. 1). The water flow width of Site 1 (N 35°05′45″, E 126°56′19″) was about 3 m. Especially in Summer season Persicaria thunbergii (Siebold & Zucc.) H. Gross formed a flora colony along water’s edge and the open water sur- face decreased to 1.5 m by them. One side of bank was a concrete retaining wall, and the discharging water of STP was released 30,000 m
3per day at 1 km upper region of Site 1. The water width of Site 2 (N 35°07′11″, E 126°55′55″) was about 3~5 m. The lake water of Juam reservoir as
Fig. 1. Map of study sites in the Gwangju Stream, Korea. STP;
Sewage treatment plant, ; Discharging water of STP,
; Lake water of Juam reservoir.
Gwangju Str
eam Yeongsan River
Site 5
35°08′
N
W E
S
126°53′
Site 4
Site 3
Site 2
Site 1
(Juam reservoir)
Jeungsimsa Stream (STP)
0 1 2 3 km
river maintenance water was released 100,000 m
3per day from 500 m upper region of Site 2 from May to October, so the depth and water flow width changed seasonally. The stream width and water flow width of Site 3 (N 35°08′02″, E 126°53′25″) became 30 m wider and 10 m wider respec- tively. The Jeungsimsa Stream joined at this site and the discharging water of STP was released 50,000 m
3per day to the Jeungsimsa Stream. The stream bed of Site 3 was cov- ered with dark and slippery materials to be combined with moss, sediment and other organisms. The stream width and water flow width of Site 4 (N 35°10′07″, E 126°53′00″) as middle reaches of the Gwangju Stream was about 50 m and 20~30 m respectively. The stream bed was covered with grey and slippery materials at this site. Site 5 (N 35°08′56″, E 126°49′52″) as lower reaches of the Gwangju Stream was a point to join the Yeongsan River being a main river of Yeongsan River basin. The main substrates of stream bed were sand and silt. Sampling was conducted at a small rip- ple under a concrete weir located in Site 5.
2. Physicochemical water quality analysis
Water temperature (WT), pH, electronic conductivity (EC), dissolved oxygen (DO) were measured with a por- table water quality analyzer (556MPS, YSI, USA) in the field. Total nitrogen (TN), total phosphorus (TP), dissolved total nitrogen (DTN) and dissolved total phosphorus (DTP) were measured with auto water quality analyzer (Futura, Alliance, France). Ammonia nitrogen (NH
3-N) and nitric nitrogen (NO
3-N) were measured with a absorption meter (UV-2550, Shimadzu, Japan). Total organic carbon (TOC) was measured with TOC analyzer (TOC-V
CPH, Shimadzu, Japan) and the rest items were analyzed with the water pol- lution standard method (MOE, 2014).
3. Sampling and identification of benthic macroinvertebrates
Benthic macroinvertebrates were sampled quantitatively three times per a site using a Surber net (50×50 cm; mesh 1.0 mm) at riffle according to the survey and evaluation method for river and stream ecosystem health assessment (MOE, 2015). The samples were preserved with Kahle’s solution and transported to the laboratory for sorting and identification. Benthic macroinvertebrates were identified
to the species level using available references (Yoon, 1988;
Won et al., 2005; Kwon et al., 2013).
Number of individuals were calculated as the number of individuals per square meter (Inds. m
-2), so the dominant and subdominant species were selected by them. Dominant index (DI) was calculated by McNauthton’s formula (1967), Diversity index (H′) was by Shannon-Weaver’s (1949), Richness index (RI) was by Margalef’s (1958) and Even- ness index (J) was by Pielou’s (1975).
4. Analyses of functional groups
Benthic macroinvertebrates were assigned to a functional feeding groups (FFGs) and habitat oriented groups (HOGs) (Merritt and Cummins, 1996; Ro and Chun, 2004; Merritt et al., 2008). Functional feeding groups (FFGs) had filter- ing-collectors, gathering-collectors, predators, plant-piecers, shredders and scrapers and habitat oriented groups (HOGs) had swimmers, clingers, burrows, sprawlers and climbers.
5. Statistical analyses
Correlation and cluster analysis were conducted to inves- tigate relationship between benthic macroinvertebrate com- munities and environmental variables using SPSS software (Korean, ver. 20.0). Correlation analyses was calculated using Spearman rank correlation coefficient of a non-para- metric method and cluster analyses were conducted using Ward’s linkage method with Euclidean distance measure for searching similarity among the study sites. One-way ANOVA (analysis of variance) was conducted to find the significant differences and main influence factors on each group of the study sites after clustering analyses.
RESULTS AND DISCUSSION 1. Water quality
The fourth surveyed mean values of environmental vari- ables were shown in Table 1. The mean range of pH values was from 7.6 to 8.1. WT and DO had not big differences.
However, WT and EC were lowest and DO was highest at
Site 2 of Site 1 to Site 3. It was considered as results that
the lake water of Juam reservoir released to Site 2 from
May to October. The maximum WT of the lake water of
Juam reservoir was 22.4℃ on September 2015 and mean WT was 19.6℃ from June to October 2015. On the other hand, DO was the lowest but WT and EC were the highest at Site 3 where the sewage treatment water was discharged and the sewage treatment water to be discharged at upper reaches was collected. WT of the sewage treatment water discharged was kept from 13℃ to 15℃ even in Winter.
EC was shown the concentrations of dissolved matter like underwater organic matter indirectly. The mean concen- tration of EC at Site 3 was higher than other sites because EC of the sewage treatment water was high as 482 μs cm
-1. The mean concentrations of EC in other streams through Gwangju city were 239 μs cm
-1, 188 μs cm
-1and 183 μs cm
-1respectively. The mean concentration of EC of the lake water of Juam reservoir was 76 μs cm
-1at Site 2.
The mean concentrations of TOC, BOD, COD
Mn, NH
3-N, NO
3-N, DTN, TN showing the pollution caused by organic matter were highest at Site 3. The mean concentrations of DTP, TP, Chl-a also increased more rapidly at Site 3 than the Site 1 and Site 2. The reason was considered to be re-
lated with that the sewage treatment water discharged at upper reaches was collected at Site 3 and the water quality of Gwangju Stream was affected by the discharged water of sewage treatment water. Although the discharge flow of the lake water of Juam reservoir was about one hundred thou- sand ton per a day and was similar to the sewage treatment water, the influence on the water quality of the Gwangju Stream of the lake water of Juam reservoir was relatively small.
2. Distribution of benthic macroinvertebrate fauna In total 6,361 individuals belonging to 56 species, 37 families, 7 orders and 5 classes were detected from the five study sites (Appendix 1). The taxonomic group including the most species was Ephemeroptera (2,668 individuals, 16 species). The next orders were Trichoptera (2,249 individu- als, 13 species), Diptera (434 individuals, 4 species). In the total number ofspecies and individuals, the Class Insecta was 78.2% and 87.5%, so they accounted for the most part Table 1. Mean values and standard deviation of water quality at five sampling sites in the Gwangju Stream, Korea.
Variables Abbreviation Site 1 Site 2 Site 3 Site 4 Site 5
Water quality
Hydrogen ion concentration pH 7.9±0.5 8.1±0.5 7.6±0.1 8.0±0.2 8.1±0.5 Water temperature (℃) WT 13.8±8.5 13.0±9.6 14.3±9.5 14.4±11.2 14.1±11.4 Dissolved oxygen (mg L
-1) DO 11.0±2.5 11.5±3.7 10.8±2.7 11.4±3.5 12.7±4.3 Electronic conductivity (μs cm
-1) EC 219.3±15.6 180.3±77.9 301.8±12.8 255.5±60.3 238.8±38.5 Total organic carbon (mg L
-1) TOC 2.476±0.264 1.827±0.566 3.379±0.207 2.653±0.516 3.055±0.650 Biologial oxygen demand (mg L
-1) BOD 1.5±0.5 0.9±0.4 4.0±1.8 2.2±0.9 2.5±1.5 Chemical oxygen demand (mg L
-1) COD
Mn5.9±1.4 4.7±2.4 7.3±0.8 6.3±1.2 6.9±1.3 Suspended solid (mg L
-1) SS 2.9±1.9 4.4±3.2 7.9±1.7 11.1±3.2 8.0±5.9 Ammonia nitrogen (mg L
-1) NH
3-N 1.218±0.750 0.312±0.385 4.670±2.631 0.510±0.868 0.980±0.255 Nitric nitrogen (mg L
-1) NO
3-N 2.628±1.732 1.858±1.298 2.457±1.528 2.259±1.543 2.486±1.662 Dissolved total nitrogen (mg L
-1) DTN 4.389±1.192 2.031±1.139 6.392±1.435 3.136±0.618 3.938±1.221 Dissolved total phosphorus (mg L
-1) DTP 0.037±0.042 0.011±0.008 0.022±0.009 0.028±0.021 0.030±0.019 Total nitrogen (mg L
-1) TN 4.988±1.537 2.343±1.193 7.295±1.695 3.348±0.753 4.201±1.360 Total phosphorus (mg L
-1) TP 0.023±0.004 0.014±0.012 0.041±0.023 0.049±0.026 0.105±0.084 Chlorophyll-a (mg m
-3) Chl-a 2.6±1.6 4.6±4.8 4.0±0.8 8.7±0.6 11.2±8.3 Substrate
Silt (%) 0 5 5 5 5
Sand (%) 10 10 10 10 30
Gravel (%) 20 10 10 30 40
Pebble (%) 50 60 50 40 10
Cobble (%) 10 10 20 10 10
Boulder (%) 10 5 5 5 5
Water depth (cm) WD 22.5±6.5 21.8±8.5 33.3±12.9 29.3±8.7 26.3±11.1
Silt < 0.063 mm, Sand 0.063~2 mm, Gravel 2~4 mm, Pebble 4~64 mm, Cobble 64~256 mm, Boulder > 256 mm
of benthic macroinvertebrates (Fig. 2). In general, it was considered that the more EPT taxon the better stream envi- ronment (Davis et al., 2003; Peitz, 2003). From the surveys, although the individuals and species percentages of EPT taxon were high with 77.4% and 55.4%, the percentage of Plecoptera was very low, so the Gwangju Stream’s water environment could not considered only with EPT taxon.
EPT taxon was affected by the structure of stream bed and other physical conditions (Kil et al., 2010) and it was diffi- cult EPT taxon to be a indicator of water pollution (Choi et al., 2012). Analyses of EPT taxon would be better off being utilized as means to assess among the different study sites of the same study stream than compare the study stream with other streams.
Fig. 3 shows the relative abundance of benthic macro- invertebrates taxon per study site. Even though regular change was not found directly from this graph, the indi- viduals percentages of Diptera and Non-insecta tended to rise from upper reaches to lower reaches. The relative abundance of Ephemeroptera was the lowest but Trichop- tera was the highest at Site 3. It could be closely connected with the stream bed of Site 3 to be covered with dark and slippery materials to be combined with moss, sediment and other organism. Dominant species of Site 3 was Cheumato- psyche brevilineata Iwata to live on the surface of cobble or boulder and catch some food with web. Epeorus pellusidus (Brodsky) as gathering-collector was a dominant species at Site 1 (mean 185 Inds. m
-2) and Site 2 (mean 153 Inds. m
-2) but the individual number of it decreased rapidly to mean 2 Inds. m
-2(Ro and Chun, 2004). The mean concentrations
of TOC, BOD, COD
Mn, NH
3-N, NO
3-N, DTN, TN were highest at Site 3 (Table 1). These environmental factors were considered to be related with the relative abundance of Ephemeroptera and Trichoptera. Organic matter and nutri- ent caused a decline in water quality and change the number of species and individuals per study sites.
3. Dominant species and community indices 1) Dominant species
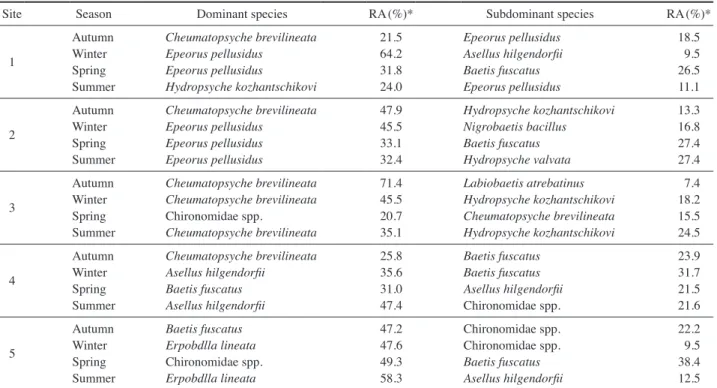
Seasonal dominant and subdominant species and rel- ative abundance of benthic macroinvertebrates detected from five study sites are shown in Table 2. Dominant and subdominant species were Family Ephemeroptera such as E. pellusidus, Baetis fuscatus Linnaeus and so on and Family Trichoptera such as C. brevilineata, Hydropsyche Fig. 3. Relative abundance of benthic macroinvertebrates moni-
tored at five sampling sites in the Gwangju Stream.
Non-insecta Ephemeroptera Plecoptera Trichoptera Diptera Coleoptera Odonata Megaloptera
100
80
60
40
20
0
Relative abundance(%)
Site 1 Site 2 Site 3 Site 4 Site 5
Fig. 2. Composition of species and individuals monitored at five sampling sites in the Gwangju Stream. EPT: abbreviation of Ephemerop- tera, Plecoptera and Trichoptera.
No. of species
EPT, 55.4%
Ephemeroptera, 28.6%
Ephemeroptera, 41.9%
Plecoptera, 3.6%
Plecoptera, 0.1%
Trichoptera, 23.2%
Trichoptera, 35.3%
EPT, 77.4%
Non-insecta,
21.8% Non-insecta,
12.5%
Diptera,
7.1% Diptera,
6.8%
Coleoptera,
3.6% Coleoptera,
2.9%
Megaloptera,
1.8% Megaloptera,
0.0%
Odonata, 9.1%
Odonata, 0.4%
No. of individuals
kozhantschikovi Martynov and so on at Site 1 and Site 2.
C. brevilineata and H. kozhantschikovi werestill dominant species but Chironomidae spp. appeared instead of Ephem- eroptera at Site 3. Non-insecta such as Asellus hilgendorfii, Erpobdlla lineata and so on began to appear as dominant species at Site 4 and 5. Change of dominant species at the study sites was considered to show that physical and chem- ical stream environment would be changed from upper reaches to lower reaches.
2) Community indices
Fig. 4 shows the seasonal change of community indices at five study sites. The range and mean of dominant index (DI) was 0.36~0.88 and 0.61. DI was highest at Site 1 in Winter, Site 3 in Autumn, Site 5 in Spring but not changed visibly at Site 2 for the year. The range and mean of diver- sity index (H′) was 1.47~3.41 and 2.54. H′ of Site 1 was highest in Autumn and lowest in Winter. H′ of Site 3 was highest in Spring and lowest in Autumn. Meanwhile there were no visible seasonal changes of H′ at Site 2 and 4. The range and mean of richness index (RI) was 0.70~3.80 and 2.51. RI was highest at Site 1 in Spring and lowest at Site 5 in Winter. There were no visible seasonal changes of RI
at Site 4. RI of the upper reaches (Site 1 to Site 3) were higher than the lower reaches (Site 4 and 5) on the whole.
The range and mean of evenness index (J′) was 0.46~0.87 and 0.70. J′ of Site 1 was highest in Summer and lowest in Winter. J′ of Site 3 was highest in Spring and lowest in Autumn The other sites had no seasonal changes of J′.
All things considered, seasonal differences of community indices were larger at Site 1 and 3 than Site 2 and 4. Even though seasonal differences of community indices were ex- pected to be large according to inflow of the lake water of Juam reservoir, they were not so large. Seasonal differences of community indices were large at Site 1 and 3 where the discharging water of sewage treatment plant was released for the year.
4. Analyses of functional groups
In general, distribution trends of functional feeding groups (FFGs) and habitat oriented groups (HOGs) reflected the feed resource and environmental factors of habitat (Kil et al., 2010). The graph of FFGs shows that Gathering-col- lectors and Filtering-collectors occupies a high rate (Fig. 5).
Gathering-collectors was dominant at Site 1, but the ratio of Table 2. Seasonal dominant species and subdominant species of benthic macroinvertebrates monitored at five sampling sites in the Gwangju
Stream.
Site Season Dominant species RA (%)* Subdominant species RA (%)*
1
Autumn Cheumatopsyche brevilineata 21.5 Epeorus pellusidus 18.5
Winter Epeorus pellusidus 64.2 Asellus hilgendorfii 9.5
Spring Epeorus pellusidus 31.8 Baetis fuscatus 26.5
Summer Hydropsyche kozhantschikovi 24.0 Epeorus pellusidus 11.1
2
Autumn Cheumatopsyche brevilineata 47.9 Hydropsyche kozhantschikovi 13.3
Winter Epeorus pellusidus 45.5 Nigrobaetis bacillus 16.8
Spring Epeorus pellusidus 33.1 Baetis fuscatus 27.4
Summer Epeorus pellusidus 32.4 Hydropsyche valvata 27.4
3
Autumn Cheumatopsyche brevilineata 71.4 Labiobaetis atrebatinus 7.4 Winter Cheumatopsyche brevilineata 45.5 Hydropsyche kozhantschikovi 18.2
Spring Chironomidae spp. 20.7 Cheumatopsyche brevilineata 15.5
Summer Cheumatopsyche brevilineata 35.1 Hydropsyche kozhantschikovi 24.5 4
Autumn Cheumatopsyche brevilineata 25.8 Baetis fuscatus 23.9
Winter Asellus hilgendorfii 35.6 Baetis fuscatus 31.7
Spring Baetis fuscatus 31.0 Asellus hilgendorfii 21.5
Summer Asellus hilgendorfii 47.4 Chironomidae spp. 21.6
5
Autumn Baetis fuscatus 47.2 Chironomidae spp. 22.2
Winter Erpobdlla lineata 47.6 Chironomidae spp. 9.5
Spring Chironomidae spp. 49.3 Baetis fuscatus 38.4
Summer Erpobdlla lineata 58.3 Asellus hilgendorfii 12.5
Filtering-collectors was the highest at Site 3. The graph of HOGs shows that the rate of Clingers decreases and the rate of Sprawlers increases from Site 1 to Site 3. This result was related with the individuals number of Tricoptera belonging to Filtering-collectors and Sprawlers that were most at Site 3 (Fig. 2). Allan (1995) reported when the quantity of fine
particulate organic matter increased at middle and lower reaches of stream, the rate of Filtering-collectors increased.
Concentrations of EC, TOC, BOD as indirect indices to cal- culate the quantity of water organic matter were the highest at Site 3 (Table 1).
Fig. 4. Seasonal biotic community indices monitored at five sampling sites in the Gwangju Stream.
Dominance index (DI)
AutumnWinter Spring Summer
Diversity index (H ′)
Richness index (RI) Evenness index (J ′)
Site 1
Site 1
Site 1
Site 1 1.0
0.8 0.6 0.4 0.2 0.0
4.0 3.0 2.0 1.0 0.0
4.0 3.0 2.0 1.0 0.0
1.0 0.8 0.6 0.4 0.2 0.0 Site 5
Site 5
Site 5
Site 5 Site 2
Site 2
Site 2
Site 2 Site 4
Site 4
Site 4
Site 4 Site 3
Site 3
Site 3
Site 3
Fig. 5. Proportion of functional feeding groups (FFGs) and habitat oriented groups (HOGs) at five sampling sites in the Gwangju Stream (FC: Filtering-collectors, GC: Gathering-collectors, P: Predators, SC: Scrapers, SH: Shredders, BU: Burrowers, CB: Climbers, CL:
Clingers, SP: Sprawlers, SW: Swimmers).
FFGs 100%
75%
50%
25%
0%
100%
75%
50%
25%
0%
HOGs
FC GC P SC SH
BU CB CL SP SW
Site 1 Site 2 Site 3 Site 4 Site 5 Site 1 Site 2 Site 3 Site 4 Site 5
5. Statistical analyses 1) Correlation analysis
Table 3 shows the results of correlation analyses between fifteen environmental variables and four biotic factors [num- ber of species, number of individuals, EPT(S) and EPT(I)].
It was conducted by the spearman rank correlation analyses.
The number of species and individuals showed negative correlation with BOD, SS, TP and Chl-a (P < 0.05), while EPT(S) and EPT(I) were more strongly correlated with TOC, BOD, SS, TP, Chl-a (P < 0.01). EPT taxon (Ephem- eroptera, Plecoptera and Trichoptera) lived under a good condition of water environment, but the water quality items such as TOC, BOD, SS, TP, Chl-a could influence on inhab- itation of EPT taxon negatively. Especially EPT(I) showed the strongest negative correlation with SS (r=-0.743, P <
0.01)
2) Cluster analysis
Fig. 6 shows the results of clustering using biotic data and physicochemical data with Ward’s linkage method by season. Horizontal axis was relative distance among groups and vertical axis was the study sites. The study sites clas- sified seasonally under 3 groups by cluster analyses. The
clustering were identified by using single solution to get more definite results. Clusters were classified to Site 1 and 3, Site 2, Site 4 and 5 in Autumn, Site 2 and 4, Site 1, Site 3 and 5 in Winter, Site 1 and 2, Site 3 and 4, Site 5 in Spring, Site 1 and 2, Site 3, Site 4 and 5 in Summer.
One-way ANOVA was conducted to enhance the statisti- cal reliability and validity on each group of the study sites after clustering (Table 4). Main factors were used 3 data of single solution. The data that significance level was under 0.05 were shown in Table 3. This signified the means of data had statistical differences in a significance level among groups (Kim et al., 2016). In other words, clustering of the study sites was considered to be due to larger influence of abiotic factors than biotic factors. The lower P-value, the bigger the influence on cluster analysis. NH
3-N (Autumn P=0.005, Winter P=0.011) in Autumn and Winter, EPT(I) (P=0.011) in Spring and DO (P=0.003) in Summer showed the lowest significance level and those were considered the main influence factors of cluster analysis by sites. The post hoc analysis to find which sites had a difference was not conducted because the site number per a group was under 2.
CONCLUSION
We tried to figure out the actual condition of the water environment by comparing and analyzing the physicochem- ical water quality, distribution and community structure of benthic macroinvertebrates in the Gwangju Stream. The significant relationship of biological results with environ- mental variables was found as using statistical analyses.
The most species detected were Ephemeroptera (16 species) Table 3. Spearman rank correlation coefficients between biotic
factors and environmental variables monitored at five sampling sites in the Gwangju Stream.
EPT(S)
a)EPT(I)
b)Number of
species Number of individuals
pH .112 -.262 -.306 - .300
WT - .234 -.236 .196 .210
DO .085 .212 -.282 - .283
EC - .416 -.363 -.103 - .186
TOC - .569** -.482* -.416 - .339
BOD - .702** -.500* -.480* - .457*
COD
Mn- .635** -.383 -.327 - .292
SS - .607** - .743** - .457* - .440
NH
3-N - .265 -.107 .035 .051
NO
3-N - .184 - .112 - .108 - .182
DTN - .307 -.079 -.063 - .114
DTP - .252 - .336 - .222 - .103
TN - .244 -.002 .014 - .053
TP - .654** - .719** - .492* - .493*
Chl-a - .698** -.686** -.505* - .557*
*: P-value < 0.05, **: P-value < 0.01
a)
EPT(S); a ratio of sum of species number of Ephemeroptera, Plecoptera and Tricoptera to whole appearance species
b)


![Table 3 shows the results of correlation analyses between fifteen environmental variables and four biotic factors [num-ber of species, num[num-ber of individuals, EPT(S) and EPT(I)]](https://thumb-ap.123doks.com/thumbv2/123dokinfo/5538586.465785/8.892.452.795.166.364/results-correlation-analyses-environmental-variables-factors-species-individuals.webp)

