217 TOF Method and C6D6 Scintillation Spectrometer"
Resonance Integral of Neptunium(237Np) from Energy Dependent Differential Neutron Capture Cross-Section by Using the Linac TOF Method and C6D6
Scintillation Spectrometer
Samyol Lee
Department of Radiological Science, Dongseo University, Jurae-dong, Sasang-gu, Busan, Korea
Abstract
237Np is very important material in the fission products of nuclear reactors. Resonance integral(RI) tests of this material is necessary to check between the experiments and the evaluated data. Such feedback to the evaluated data is very important to correct data and improve of codes. The RI for the 237Np(n,γ)238Np reaction were measured by using the 46-MeV electron linear accelerator (linac) at the Research Reactor Institute, Kyoto University (KURRI). The measurement was performed in the energy region from 0.005 eV and 10 keV.
RI obtained as 804.7 barns, compared with those of the evaluated data in JENDL-4.0 and Mughabghab.
Keywords: Resonance integral, 237Np(n,γ)238Np, Differential, Neutron, Capture, Cross-section, Neptunium, TOF method
I. Introduction
Neptunium (237Np) is a significant radioisotope in reactors because of a fission product which is produced in light reactor and fast breeders reactors[1]. Therefore, the precise measurement of the Resonance Integral(RI) for the
237Np(n,γ)238Np reaction is of great importance in the design of a reactor core because of varying the neutron flux[2]. Furthermore, the efficiency of reactor is greatly influenced by their fission products ratio. However, the previous measurement have large discrepancies among the their experiment data and evaluated data as shown in Table 1, because it has a very big s-wave resonance at 0.491 eV [3-11] . In generally RI data were measured by using activation method with nuclear reactor. However we tried to measure the RI by summing the differential neutron capture data which is from TOF method. We
have obatined the RI for 237Np with the neutron time-of-flight (TOF) method by using the 46-MeV electron linear accelerator (linac) at the Research Reactor Institute, Kyoto University (KURRI)[12]. The RI for 237Np(n,γ)238Np reaction was determined from the differential neutron capture cross-sections in the neutron energies from 0.005 eV to 10 keV. The RI was measured by using the detector assembled with C6D6 scintillators at KURRI.
II. Measurement
We measured the neutron capture cross-sections for various samples by using the neutron TOF method for a pulsed neutron source based on a 46-MeV electron. The capture cross-section measurements are described elsewhere[12–14]. The previous energy-dependent neutron capture cross section measurement was carried out using a neutron TOF method with the total-energy absorption
Corresponding Author: 이삼열
detector assembled with BGO scintillators at the 46-MeV electron linac of KURRI. In the present study, we measured it by the C6D6 scintillation detectors. The experimental arrangement is almost the same as before
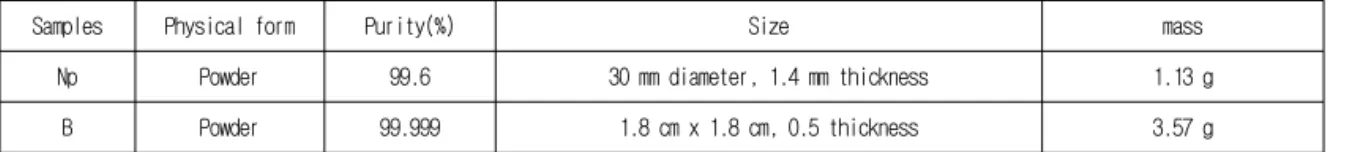
[12-14] and is shown in Fig. 1. The parameters of the samples used in the capture cross-section measurement are summarized in Table 2. The 237Np sample was in the form of neptunium oxide(NpO2) powder of 1.13g, which was packed in an aluminum disk.
Figure 1. Experimental arrangement
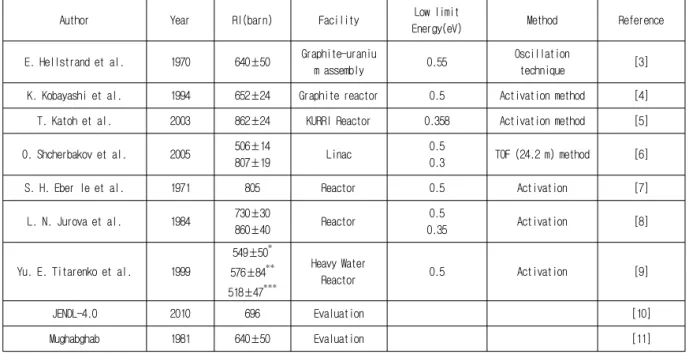
Table 1. Previous experimental RI data and evaluated data
Author Year RI(barn) Facility Low limit
Energy(eV) Method Reference
E. Hellstrand et al. 1970 640±50 Graphite-uraniu
m assembly 0.55 Oscillation
technique [3]
K. Kobayashi et al. 1994 652±24 Graphite reactor 0.5 Activation method [4]
T. Katoh et al. 2003 862±24 KURRI Reactor 0.358 Activation method [5]
O. Shcherbakov et al. 2005 506±14
807±19 Linac 0.5
0.3 TOF (24.2 m) method [6]
S. H. Eber le et al. 1971 805 Reactor 0.5 Activation [7]
L. N. Jurova et al. 1984 730±30
860±40 Reactor 0.5
0.35 Activation [8]
Yu. E. Titarenko et al. 1999
549±50* 576±84**
518±47***
Heavy Water
Reactor 0.5 Activation [9]
JENDL-4.0 2010 696 Evaluation [10]
Mughabghab 1981 640±50 Evaluation [11]
Reference material(*: Mn, **: Cu, ***: Au)
The sample thickness is important for decreasing the effects of multiple-scattering and self-shielding which depend on the neutron energy, and for obtaining a good signal-to-noise (S/N) ratio. The 10B sample in the form of powder was packed in a thin aluminum case and was used to measure the energy-dependent neutron flux in the relevant energy region. A graphite sample was also utilized for the experimental investigation of background due to neutrons scattered by the 237Np sample. Each sample was located at the center of the C6D6 scintillation detector
assembly. Prompt capture γ-rays were detected with the C6D6 detection assembly. The C6D6 detection assembly consists of two scintillation detectors, each 11 cm in diam- eter and 5 cm thickness, was used for the measurement of capture γ-rays from the sample. The C6D6 detection assembly is installed at 12±0.02 m from the neutron source of Ta target. The front of the C6D6 detection assembly was covered with 6LiF tiles, 3 mm in thickness, to absorb neutrons scattered by the sample. However, the tiles were not always enough to shield against higher
TOF Method and C6D6 Scintillation Spectrometer"
energy neutrons above 10 eV. The effect due to scattered neutrons was experimentally investigated by using a graphite sample. A block diagram of the electronics for
the data acquisition system is almost the same as before
[12–14]. The
Table 2. Physical parameters of the samples used in the experiment
Samples Physical form Purity(%) Size mass
Np Powder 99.6 30 mm diameter, 1.4 mm thickness 1.13 g
B Powder 99.999 1.8 cm x 1.8 cm, 0.5 thickness 3.57 g
KURRI linac was operated with two different modes.
One was for the low-energy experiment below 20 eV with a repetition rate of 50 Hz, a pulse width of 3.0 μs, a peak current of 0.5 A, and an electron energy about 30 MeV.
The other was for the high-energy experiment above 0.7 eV with a repetition rate of 300 Hz, a pulse width of 0.010 μs, a peak current of 6 A, and an electron energy about 30 MeV. Short experimental runs for 10 to 30 minutes were cyclically made with and without the 237Np sample, which were called the foreground and the background measurement, respectively, and were repeated in order to average out the changes in the measuring conditions, such as the neutron beam intensity, although the linac operation was steady during the experiments. In the case of the 10B sample, a dummy case made of thin aluminum was used for the background measurement. The background corrections were made for the scattered neutrons by considering the graphite thickness equivalent to the scattering cross-section of the capture sample. The BF3 monitor counts were used for the data normalization between the experimental runs. The details of the measuring conditions and method are described elsewhere
[12-15].
III. Data Analysis
The capture count rate for the 237Np sample at an energy E, CNp(E), can be obtained from the following relation[12-15]:
(E) (E) Y (E)
CNp =εNp Np φ ··· (1)
where the subscript “Np” of εNp and YNp(E) means
237Np. Since the C6D6 scintillation detector assembly is not a total-energy absorption detector. Therefore, we couldn't measure neutron capture cross section absolutely in this study. The detection efficiency εNp may be independent of the neutron energy E, and φ(E) is the neutron flux as a function of neutron energy E. The capture yield YNp(E) can be obtained from
(E) (E) Y C
(E) (E) C
Y B
B Np Np =ε
··· (2)
Here, ε is a relative detection efficiency obtained from
"εB/"εNp and the subscript “B” means 10B. In the case of the 10B sample used in the current measurement, the capture yield YB(E) is unity in the relevant energy region.
Thus, we can drop the subscript “Np”in the capture yield.
The capture yield, Y(E), is the primary value to be determined from the measured number of capture counts in both samples by using Eq. (2). The neutron capture cross-section, σc(E), is obtained as follows[16]:
(E)t)}Y(E) exp(-N
- (E){1 (E) f
(E) c t t
c σ σ
σ = ·· (3)
where fC(E) is the correction function due to the neutron scattering and/or the self-shielding in the sample, σt(E) is the neutron total cross-section obtained from the
evaluated data file, N is the atomic density of the sample, and t is the sample thickness. The correction function, fC(E), was determined by using the MCNP simulation code[17]. The RI is defined by the following relation:
∫∞
=
ECd
dE E E)/ ) ( ( INp σ
··· (4)
where (E) is the neutron capture cross-section as a function of the neutron energy E, and ECd is a Cd cutoff energy, which is usually defined as 0.5 eV [18]. The epi-cadmium dilute RI for a particular reaction in a 1/E spectrum is expressed by using this relationship, where 0.5 eV is determined by using the cadmium cut-off energy, which depends on the cadmium thickness. We assumed that the dE/E neutron spectrum was not perturbed by the absorbing materials. In the present study, the RI for the
237Np(n,γ)238Np reaction was obtained from an integration of differential data according to the definition of the RI.
IV. Results and Discussion
The neutron capture cross-sections and the RI(804.7 barns) of a 237Np(n,γ)238Np reaction were measured in the neutron energy region from 0.005 eV and 10 keV by using the 46-MeV electron linear accelerator at KURRI. 237Np isotopes has a very large s-wave resonance at 0.491 eV.
Therefore, the measurement of the RI is very difficult because Cd cutoff energy is close to the resonance energy.
The neutron capture cross section of 237Np(n,γ)238Np reaction was shown in Fig. 2 [15]. The integral values of present results depends on the energy were shown in Fig.
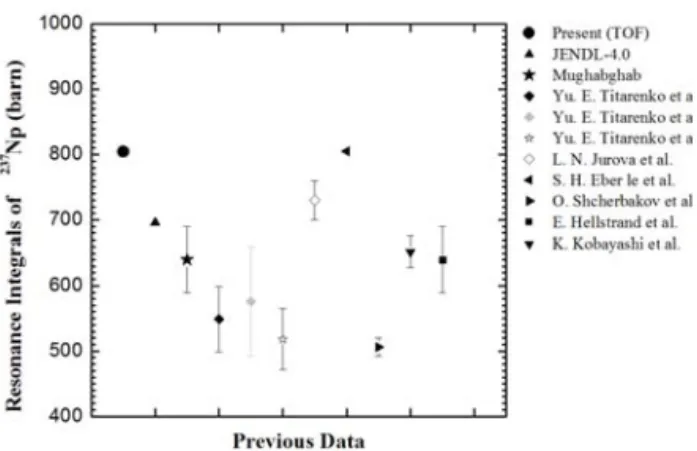
3. The present measurement of the neutron capture cross-sections was compared with the previous experimental data and the evaluated data of JENDL-4.0
[10], Mughabghab [11] as shown in Fig. 4. In the case of
237Np sample, it has a very large s-wave resonance at 0.491. Therefore, the discrepancy of the RI value as shown in Fig 3. is more large than the other elements, especially. The present result are seem to be close to the
result of S. H. Eber le et al and more large than the other values. In the calculation of RI with differential neutron capture cross section, we have to choose the data near the 0.5 eV, very carefully because the data value of RI has comparatively large than more higher data in the keV region.
Figure 2. Neutron Capture Cross section for the 237Np(n,γ)238Np reaction
Figure 3. Integrated RI value of present result for the
237Np(n,γ)238Np reaction
TOF Method and C6D6 Scintillation Spectrometer"
Figure 4. Previous and present RI values for the
237Np(n,γ)238Np reaction
Acknowledgments
The authors would like to express their sincere thanks to the staff of the Research Reactor Institute, Kyoto University (KURRI), for the excellent accelerator operation. The study was supported by the 2011 year special research funds of Dongseo University.
References
[1] Mukaiyama, T., et al.: Conceptual study of actinide burner reactors, Proc. of 1988 Int Reactor Phys. Conf., Jackson Hale, Vol. IV, p.369, 1988.
[2] J. Tommasi et al., ibid., ANS, La Grange Park, Illinois, p.1252, 1993.
[3] E. Hellstrand, J. Phelps, C. Sastre, Rep., BNL-50242, (T-577), 1970.
[4] K. Kobayashi, A. Yamanaka, I. Kimura, Journal of Nuclear Science and Technology, Vol. 31, p.1239, 1994.
[5] T. Katoh, S. Nakmura, K. Furutaka, H. Harada, K. Jujiwara, T.
Fujii, H. Yamana, Journal of Nuclear Science and Technology, Vol. 40, p.559, 2003.
[6] O. Shcherbakov, K. Furutaka, S. Nakamura, H. Sakane, H.
Harada, K. Kobayashi, S. Yamamoto, Jun-ichi Hori, Journal of Nuclear Science and Technology, Vol. 42, p.135, 2005.
[7] S. H. Eber le, W. Robel, W. Jung, I. Bayat, H. J. Bley l, E.
Bojarsky, L. Schmit, E. Gantner, J. Reinhardt, C. Krueckeberg, Rep., KFK-1456, p.45, 1971.
[8] L. N. Jurova, A. A. Poljakov, V. P. Rukhlo, Ju. E. Titarenko,
S. F. Komin, Ju. V. Stogov, O. V. Shvedov, B. F. Mjasoedov, A. V. Davydov, S. S. Travnikov, Journal of YK, Vol. 1/55, p.3, 1984.
[9] Yu. E. Titarenko, O. V. Shvedov, M. M. Lgumnov, V. F.
Batayev, V. I. Volk, A. Yu. Vakhrushin, S. V. Shepelkov, A.
V. Lopatkin, S. G. Mashnik, T. A. Gabriel, Journal of Nuclear Science and Technology, Vol. 131, p.96, 1999.
[10] S. Shibata, T. Narita (Eds.), “Descriptive Data of JENDL-3.2”, JAERI-Data/ Code 98-006, part II, 1998.
[11] 11) S. F. Mughabghab, M. Divadeenam and N. E. Holden, Neutron Cross Sections, Neutron Resonance Parameters and Thermal Cross Sections, Vol. 1, part A: Z=1-60(Academic Press, New York, 1981.
[12] S. Yamamoto et al., Journal of Nuclear Science and Technology, Vol 126, p.201, 1997.
[13] K. Kobayashi et al., J. Nucl. Sci. Technol. Vol. 36, p.20 1999.
[14] 14) K. Kobayashi et al., Annu. Rep. Res. Reactor Inst., Kyoto Univ., Vol. 22, p.142, 1987.
[15] 15) K. Kobayashi, Samyol Lee, Shuji Yamamoto, Hyun Je Cho and Yoshiaki Fujita, Journal of Nuclear Science and
Technology, Vol, 39, No. 2, p.111, 2002.
[16] H. W. Schmitt, ORNL-2883, 1-28-60, 1960.
[17] J. F. Briesmeister (Ed.), “MCNP-A General Monte Carlo Code for Neutron and Photon Transport, Version 4A”, Los Alamos National Laboratory, LA-12625-M, 1997.
[18] K. Shibata, et al., Journal of Nuclear Science and Technology, Vol. 39. p.1125. 2002.