Relationship of Physicochemical Characteristics and Ethanol Yield of Korean Barley ( Hordeum vulgare L.) Cultivars
Mi-Ja Lee, Yang-Kil Kim, Jong Chul Park, Young-Jin Kim, Kyeong-Hoon Kim, Induck Choi, Jae-Seong Choi, Kee-Jong Kim, and Hyung-Soon Kim†
National Institute of Crop Science, Rural Development Administration, Iksan, 570-080, Republic of Korea
†Department of Environmental & Chemical Engineering, Seonam University, Namwon, Jeollabuk-do, 590-711, Republic of Korea
401
†Corresponding author: (Phone) +82-63-840-2220 (E-mail) [email protected]
<Received 29 August, 2012; Revised 16 November, 2012; Accepted 19 November, 2012>
ABSTRACT The grain and agronomic characteristics of Korean barley cultivars were investigated with respect to ethanol yield. Test weight, grain yield, and starch yield showed noticeable variation among the cultivars. Grain yields were higher in covered barley and non-waxy barley.
Starch yield was higher in non-waxy barley than waxy barley. Protein, β-glucan, and starch content of tested cultivars ranged in 10.0-12.9%, 4.4-7.5% and 49.7-65.3%, respectively. Naked barley cultivar had higher starch content than covered barley cultivar. However, covered barley had high starch yield because it has higher grain yield than naked barley. Covered barley cultivar had higher husk content, ranging 7.6-14.0%, than that of naked barley cultivar, ranging 5.3-8.0%. Starch content was positively correlated with amylose content, test weight, ethanol yield and negatively correlated with protein, husk, β-glucan content. Ethanol yield per ton was positively correlated with starch content, but negatively correlated with husk content. Ethanol yield per hectare was positively correlated with starch yield, grain yield, grain weight and negatively correlated with protein, test weight. From this research, the important characteristics of barley cultivar as a bioethanol producing material were starch content and grain yield. Optimum barley genotype was non-waxy naked barley that had low protein, β-glucan, husk content, and high starch content and grain yield.
Keywords : barley, amylose, β-glucan, starch, ethanol
Barley
(Hordeum vulgare L.) is a valuable agricultural crop, grown in large quantities around the world (Nilan &Ullrich, 1993). Whole barley grain consists of about 65-68%
starch, 10-17% protein, 4-9% β-glucan, 2-3% free lipids
and 1.5-2.5% minerals (Baik & Steven, 2008; Edney et al., 2002). Starch, protein, and dietary fiber are the major components of barley. They are important nutrients for animal and humans, but also have important roles in brewing and technical uses (Baik & Steven, 2008). Starch, the largest single component in barley grain, often contributes to the properties of food and is added as a functional ingredient in many products.
Since the late 1970s, ethanol production from renewable resources has become a huge industry and now, provides several billion liters of ethanol for formulated gasoline in Canada, Brazil, the United States, and some other countries (Wu et al., 2006). Under the Kyoto Protocol, many countries are trying to reduce the greenhouse gas emissions. The Canada government has committed to reduce its greenhouse gas emissions by 6% from 1990 levels between 2008 and 2012. Ethanol blended gasoline have the potential to contribute significantly to emissions reductions (Pascale, 2008).
A great amount of research has been conducted on corn to achieve higher ethanol yields or to increase values of the byproducts. However, corn cannot meet the demand for fuel ethanol. Even if 100% of the 2004 corn crops were used for ethanol, they would only meet about 23% of our demands. Therefore, other small grains are needed for ethanol production, especially in the regions without corn (Wu et al., 2006). Since the 1990s, a great amount of research has been conducted on fuel ethanol production from other major cereal grains such as wheat, barley, oat, rye, and triticale (Tomas et al., 1995).
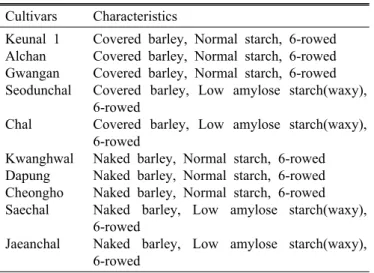
Table 1. Major characteristics of barley cultivars used in the experiment
Cultivars Characteristics Keunal 1
Alchan Gwangan Seodunchal Chal Kwanghwal Dapung Cheongho Saechal
Covered barley, Normal starch, 6-rowed Covered barley, Normal starch, 6-rowed Covered barley, Normal starch, 6-rowed Covered barley, Low amylose starch(waxy), 6-rowed
Covered barley, Low amylose starch(waxy), 6-rowed
Naked barley, Normal starch, 6-rowed Naked barley, Normal starch, 6-rowed Naked barley, Normal starch, 6-rowed
Naked barley, Low amylose starch(waxy), The current starch-based ethanol conversion process dictates that small grains such as wheat and barley are obvious ethanol feedstock in areas where corn production is limited. Selection of the cultivars or crops best suited for ethanol production would require studies where commonly grown crops and cultivars are evaluated for ethanol yields (Lacerenza et al., 2008). Since some parts of barley are attractive for making fuel ethanol, development of new barley varieties for producing ethanol could help solve the energy problems.
The objectives of this study were to investigate the barley genotype having high ability of bioethanol production and important characteristics related with bioethanol yield in order to obtain useful basic data that will assist in the selection of new barley varieties as bioethanol producing materials. We investigated the physicochemical characteristics and the correlation between chemical components of barley and bioethanol yield.
MATERIALS & METHODS
Materials and chemicals
Ten registered barley cultivars were grown in 2008 and 2009 at National Institute of crop science, Rural Development Administration, Korea. Fertilizer was applied at a rate of 7.8:6.8:3.0 kg (N : P : K) per 10a. The barley cultivars and their main characteristics are presented in Table 1. All barley cultivar grains were grounded by a Retsch centrifugal
mill (Zm 100, I. Kurt Rotech CmbH & Co. KG, Germany) with 0.5 mm sieve, and the powder was stored at 4℃ until use. Megazyme β-glucan and total starch assay kit were purchased from Megazyme Co., Ireland. All other chemicals and solvents used were commercial analytical grade.
Analysis of protein and amylose content
Protein was analyzed by Elementar analyzer system (Vario MACRO, Hanau, Germany). Conversion factor of protein was determined by comparing with the value analyzed with Kjeldahl method. The amylose contents were determined by the iodine colorimetric procedure described by Juliano (Juliano, 1985). The absorption of sample solution at 620 nm was determined using UV-Vis spectrophotometer (UV-1650, Shimadzu, Kyoto, Japan).
Analysis of β-glucan and total starch content The mixed β-glucan contents of the barley samples were determined by estimating the absorbance in 510 nm using a Megazyme β-glucan assay kit applying McCleary method (Mccleary and Codd, 1991; Mccleary and Mugford, 1992). Starch content was determined using a total starch assay kit (Megazyme Co., Ireland) with slight modification of McCleary method (Mccleary and Solah, 1994; Mccleary and Mugford, 1997) and absorbance measurements at 510 nm.
Estimate the husk content
Covered barley grain was weighed to 20 g and the boiling solvent with 80 mL NaClO and 20 mL 12.5%
NaOH was prepared. Barley grain was boiled with this solution for 2-3 min and washed with water. Then, the it was dried in room temperature for 1 day after removing the husk. Next day, dried at 130℃ for 3 hr, the samples were weighed after they were cooled in desiccator. Husk content of naked barley was estimated by weighing the husk after the starch was removed from the grain. To remove the starch of grain, grains were germinated in petridish for 1 week and then were pressed and squeezed.
Husk removed starch was dried and weighed. Husk content
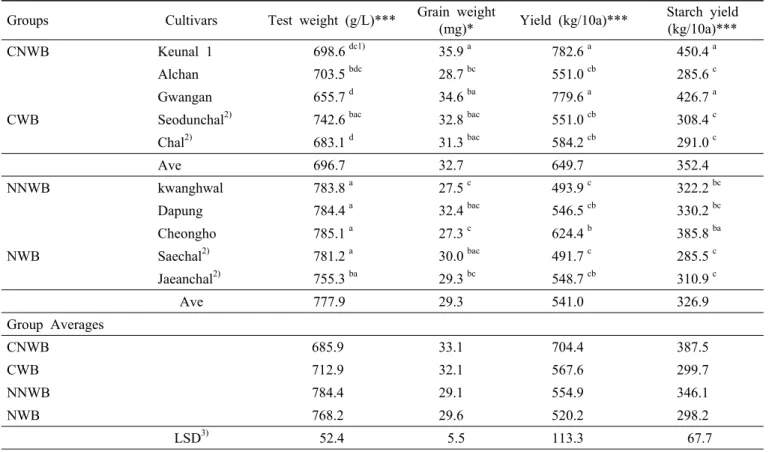
Table 2. Agronomic characteristics of barley cultivars used in the experiment.
Groups Cultivars Test weight (g/L)*** Grain weight
(mg)* Yield (kg/10a)*** Starch yield (kg/10a)***
CNWB Keunal 1 698.6 dc1) 35.9 a 782.6 a 450.4 a
Alchan 703.5 bdc 28.7 bc 551.0 cb 285.6 c
Gwangan 655.7 d 34.6 ba 779.6 a 426.7 a
CWB Seodunchal2) 742.6 bac 32.8 bac 551.0 cb 308.4 c
Chal2) 683.1 d 31.3 bac 584.2 cb 291.0 c
Ave 696.7 32.7 649.7 352.4
NNWB kwanghwal 783.8 a 27.5 c 493.9 c 322.2 bc
Dapung 784.4 a 32.4 bac 546.5 cb 330.2 bc
Cheongho 785.1 a 27.3 c 624.4 b 385.8 ba
NWB Saechal2) 781.2 a 30.0 bac 491.7 c 285.5 c
Jaeanchal2) 755.3 ba 29.3 bc 548.7 cb 310.9 c
Ave 777.9 29.3 541.0 326.9
Group Averages
CNWB 685.9 33.1 704.4 387.5
CWB 712.9 32.1 567.6 299.7
NNWB 784.4 29.1 554.9 346.1
NWB 768.2 29.6 520.2 298.2
LSD3) 52.4 5.5 113.3 67.7
1) The different superscripts in the same column mean significantly different at p<0.05
2) Waxy barley cultivar
3) Least significant difference at 5% level of significance.
CNWB; covered non-waxy barley, CWB; covered waxy barley, NNWB; naked non-waxy barley, NWB; naked waxy barley.
Ethanol production
Liquefaction, saccharification, and fermentation were performed by modifying the method reported by Wu et al.
(2006) and Wang et al. (1999). Liquefaction was performed the method of Wu et al. (2006). Barley starch was liquefied by 1% α-amylase (α-amylase A-3403, sigma, St.
Louis, MO) and saccharificated for 1 hr, at 60℃ by glucoamylase. Subsequently, yeast preculture was added and fermented at 33℃ for 72 hr, in shaking incubator. Ethanol concentration was determined by Liquid chromatography.
The ethanol yield (L/ton) was calculated using the ethanol concentration (%, v/v) and grain yield.
Statistical analysis
All measurements were conducted at least in triplicate and the data were then analyzed by SAS Enterprise Guide 4.0 (Statistical analysis system, 2006, Cray, NC, USA).
Duncan’s multiple range test and Fisher’s least significant different test were used to compare the mean values at p<0.05.
RESULTS AND DISCUSSION
Agronomic characteristics of barley cultivars Agronomic data of cultivars chosen for this study and averages of each group for agronomic characteristics are summarized in Table 2. The range for all cultivars for test weight varied significantly for individual cultivars.
Cheongho had the highest test weight and Gwangan had the lowest. Test weights were higher in naked non-waxy barley (NNWB) and naked waxy barley (NWB) than those of covered non-waxy barley (CNWB) and covered waxy barley (CWB). Grain weight varied substantially at 27.3-35.9 g for individual. Grain yields were 4.9-7.8 ton/ha
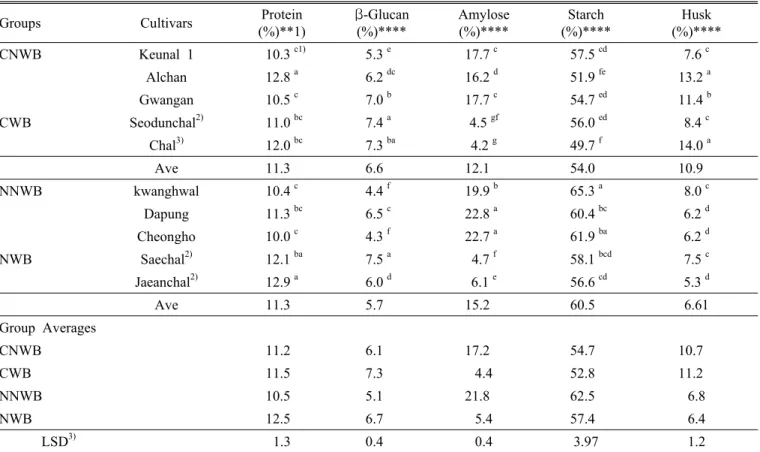
Table 3. Grain characteristics of barley cultivars used in the experiment.
Groups Cultivars Protein
(%)**1)
β-Glucan (%)****
Amylose (%)****
Starch (%)****
Husk (%)****
CNWB Keunal 1 10.3 c1) 5.3 e 17.7 c 57.5 cd 7.6 c
Alchan 12.8 a 6.2 dc 16.2 d 51.9 fe 13.2 a
Gwangan 10.5 c 7.0 b 17.7 c 54.7 ed 11.4 b
CWB Seodunchal2) 11.0 bc 7.4 a 4.5 gf 56.0 ed 8.4 c
Chal3) 12.0 bc 7.3 ba 4.2 g 49.7 f 14.0 a
Ave 11.3 6.6 12.1 54.0 10.9
NNWB kwanghwal 10.4 c 4.4 f 19.9 b 65.3 a 8.0 c
Dapung 11.3 bc 6.5 c 22.8 a 60.4 bc 6.2 d
Cheongho 10.0 c 4.3 f 22.7 a 61.9 ba 6.2 d
NWB Saechal2) 12.1 ba 7.5 a 4.7 f 58.1 bcd 7.5 c
Jaeanchal2) 12.9 a 6.0 d 6.1 e 56.6 cd 5.3 d
Ave 11.3 5.7 15.2 60.5 6.61
Group Averages
CNWB 11.2 6.1 17.2 54.7 10.7
CWB 11.5 7.3 4.4 52.8 11.2
NNWB 10.5 5.1 21.8 62.5 6.8
NWB 12.5 6.7 5.4 57.4 6.4
LSD3) 1.3 0.4 0.4 3.97 1.2
1) The different superscripts in the same column mean significantly different at p<0.05 for individual cultivars. Saechal cultivar had the lowest
grain yield and Keunal 1 with the greatest grain weight had the highest grain yield. Mean value for grain yield was higher in the CNWB and CWB than NWB and NNWB.
And non-waxy barley group had higher grain yield than waxy barley groups. Starch yield was ranged in 2.9-4.5 ton/ha. Starch yield was calculated from grain yield and starch content. Keunal 1, non-waxy barley, was the highest in starch yield and Saechal was the lowest. Grain yield and starch yield varied significantly between the group means.
However, difference in grain weights among groups was not significant.
CNWB and CWB had higher starch yield, grain yield, and grain weight compared to NWB and NNWB.
Non-waxy barley had higher starch yield and grain yield than waxy barley.
Grain characteristics
Grain characteristics including protein, β-glucan, amylose, total starch and husk contents for barley cultivars are summarized in Table 3. Average of each group for grain characteristics is also compiled. Protein content was the lowest in Cheongho and the highest in Jaeanchal. Protein mean values of covered barley and naked barley group exhibited a similar value, but in the waxy and non-waxy group, waxy group had slightly higher value than non- waxy group.
β-Glucan content was 4.3-7.5%. The lowest β-glucan content was found in Cheongho and the highest content was in Saechal. Mean values for four groups, CNWB, CWB, NWB, and NNWB, were higher in waxy barley than those for non-waxy barley, which is in agreement with the report by Bhatty (1999) and Newman and Newman (1991). They reported that β-glucan content was
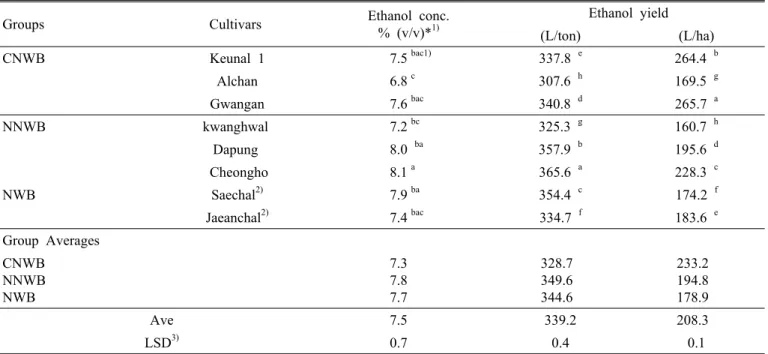
Table 4. Ethanol production of barley cultivars used in the experiment.
Groups Cultivars Ethanol conc.
% (v/v)*1)
Ethanol yield
(L/ton) (L/ha)
CNWB Keunal 1 7.5 bac1) 337.8 e 264.4 b
Alchan 6.8 c 307.6 h 169.5 g
Gwangan 7.6 bac 340.8 d 265.7 a
NNWB kwanghwal 7.2 bc 325.3 g 160.7 h
Dapung 8.0 ba 357.9 b 195.6 d
Cheongho 8.1 a 365.6 a 228.3 c
NWB Saechal2) 7.9 ba 354.4 c 174.2 f
Jaeanchal2) 7.4 bac 334.7 f 183.6 e
Group Averages CNWB
NNWB NWB
7.3 7.8 7.7
328.7 349.6 344.6
233.2 194.8 178.9
Ave 7.5 339.2 208.3
LSD3) 0.7 0.4 0.1
1) The different superscripts in the same column mean significantly different at p<0.05
2) Waxy barley cultivar
3) Least significant difference at 5% level of significance.
CNWB; covered non-waxy barley, CWB; covered waxy barley, NNWB; naked non-waxy barley, NWB; naked waxy barley.
significantly higher in waxy barley cultivars than non- waxy barley cultivars.
Baik et al. (2008) reported that waxy starch genotypes contain higher contents of protein and β-glucan than genotypes with regular starch composition. Izydorczyk et al. (2005) observed significant differences in β-glucan content among barley types with various starch amylose contents.
The amylose content of barley starch varies from 0% in zero amylose waxy to 5% in waxy, 20-30% in normal and up to 45% in high-amylose barley (Newman et al., 1989).
In this study, Dapung, non-waxy barley, had the highest amylose content and Chal, waxy barley, had the lowest value. Genetic variations for starch type in wheat and barley existed. And selection of high amylose wheat or barley may be disadvantageous in ethanol production because they would require greater heat input for gelatinization and solubilization and increased amylose would decreases ethanol conversion efficiency (Wu et al., 2006b).
Husk content ranged in 5.3-14.0% with the lowest in Jaeanchal and the highest in Chal. The naked barley group
had the lower husk content than covered barley group.
And the husk content was not significantly different in non-waxy barley group and waxy barley group. Barley hulls are very abrasive and can cause expensive wear and tear on grain handling and milling equipment. Removing the hull and other nonstarch components of the kernel before fermentation for ethanol would greatly improve the production process. Hull-less varieties lose their hull during harvesting. They have more starch and protein but less fiber than hulled varieties. Hull-less barley solves the
“hull” problem.
Starch is the predominant storage carbohydrate in plants and the second most abundant biopolymer on earth, after cellulose. Starch is a mixture of glucose polymers, amylose and amylopectin. Starch content ranged from 49.7% to 65.3%. Variation in starch content was apparent among tested cultivars. The highest content was in Kwanghwal and the lowest was in Chal. Group average of starch content was higher in naked barley group compared with covered barley group and non-waxy group had higher starch content than waxy group. Baik et al. (2008)
Table 5. Correlation analysis of grain and agronomic characteristics.
Protein Husk β-glucan Amylose Starch
yield Yield Test weight
Grain weight
Ethanol
% (v/v)
Ethanol yield(L/ton)
Ethanol yield(L/ha) Starch -0.507* -0.720**** -0.648** 0.530** 0.212 -0.201 0.707*** -0.213 0.412 * 0.415 * -0.185 Protein 0.233 0.463* -0.535** -0.608** -0.406* -0.114 -0.124 -0.392 -0.392 -0.556*
Husk 0.385* -0.193 -0.161 0.151 -0.700*** 0.109 -0.641** -0.645 ** 0.057 β-glucan -0.675*** -0.369* -0.095 -0.348 0.366 0.040 0.038 -0.032 Amylose 0.516* 0.300 0.140 -0.044 0.130 0.129 0.329 Starch yield 0.913**** -0.259 0.372* 0.246 0.244 0.899****
Yield -0.566** 0.467* 0.079 0.076 0.914****
Test weight -0.565** 0.433 * 0.435 * -0.589**
Grain weight 0.089 0.087 0.652**
reported that waxy barley types contain lower starch content than other barley types. β-glucan, amylose, husk, and starch contents significantly differed in different genotype barley cultivars.
Ethanol yield
We tested the ability of barley to produce ethanol and their relative agronomic properties. Ethanol data were determined by fermentation of all cultivars. Ethanol concentration (%, v/v) ranged from 6.8% to 8.1% (Table 4).
Ethanol yield per ton was 307.6-365.6 L/ton. Cheongho which had high starch content, low protein, and low husk content, had the highest ethanol yield (L/ton). Ethanol yield (L/ha) was calculated from ethanol yield (L/ton) and grain yield, and it was the highest in Kwangan which also had the highest grain yield. Group mean of ethanol concentration was highest in NNWB. Although NNWB had the highest ethanol concentration, CNWB which had the highest grain yield, had the most ethanol yield (L/ha).
In this study, ethanol yield was higher in cultivar with high starch content and low nonstarch content: protein, β -glucan, and husk. Barley cultivar with small grain weight and high test weight had high starch content and ethanol concentration. However, because it had low grain yield, it had low ethanol yield (L/ha). This result indicates that grain yield is an important characteristic for producing bio-ethanol.
Wu et al. (2006b) reported that as amylose content increases, ethanol conversion efficiency decreases. However, in this study, non-waxy barley with high amylose showed higher ethanol yield than waxy barley with low amylose.
Wang et al. (1997) and Lacerenza et al. (2008) reported that the ideal small grain is naked barley because it is the highest yielding small grain crop. But, barley with low starch content of 50-55% has lower ethanol yield compared to corn, which has 72% starch content. Therefore, many researchers are trying to create new barley varieties with high starch content.
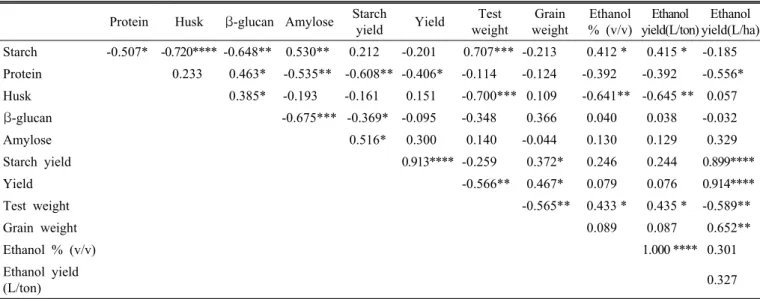
Correlation analysis of grain and agronomic characteristics
Correlation among grain, agronomic characteristics and ethanol production are summarized in Table 5. Protein content was negatively correlated with amylose (r=-0.535, p<0.01), starch yield (r=-0.608, p<0.01), and grain yield (r=-0.406, p<0.05). β-glucan content was negatively correlated with amylose content (r=-0.675, p<0.0001), and starch yield (r=-0.369, p<0.05). Husk content was negatively correlated with test weight (r=-0.700, p<0.001), ethanol concentration (r=-0.641, p<0.01), and ethanol yield (r=-0.645, p<0.001). Starch content was negatively correlated with protein (r=-0.507, p<0.05), husk content (r=-0.720, p<0.0001), β-glucan (r=-0.648, p<0.01) and positively correlated with amylose (r=0.530, p<0.01), test weight (r=0.707, p<0.001).
Starch yield had strong positive correlation with grain yield (r=0.913, p<0.0001) and negative correlation with protein content (r=-0.608, p<0.01). Ethanol concentration%
(v/v) was positively correlated (r=0.412, p<0.1) with starch content, and negatively correlated (r=-0.641, p<0.05) with husk content. Ethanol yield (L/ha) was strongly correlated with starch yield (r=0.899, p<0.0001) and grain yield (r=0.914, p<0.0001).
Lacerenza et al., (2008) reported that starch content of barley is diverse and it is a significant factor in determining ethanol yields. However, according to this study, grain yields and agronomic properties are also important factors together with starch content.
A negative correlation between grain N content and ethanol yield has previously been reported (Daniel et al., 2008; Swanston et al., 2005, 2007). Kevin Hicks (2005) reported that high starch content is needed to produce ethanol.
To date, there has been little effort in breeding barley varieties specifically for biofuel or potable alcohol use.
Since starch is the principal grain component providing sugars for fermentation, it seems logical to assume that barley varieties that produce grain with high starch content and thus relatively low protein content would be the ideal type for alcohol production (Daniel et al., 2008). The results indicate that cultivars for ethanol production should be chosen with an emphasis on genetics and agronomics practices that maximize agronomic yield and ethanol production value. According to this research, non-waxy barley cultivar which had low protein, β-glucan, husk content, and had high starch content and grain yield, is the optimum cultivar for ethanol production. This work may be useful in choosing the barley variety suitable as a bioethanol producing source.
REFERENCES
Baik B. K. and E. U. Steven. 2008. Barley for food:
characteristics, improvement and renewed interest. J. Cereal Sci. 48 : 233-242.
Bhatty R. S. 1999. Potential of hull-less barley. Cereal Chem.
76 : 589-599.
Daniel R. K., M. O. V. Tamara, M. W. Richard, J. S. Stuart, C. A. Reginald, M. B. James, and S. B. Roger. 2008.
Effects of variety and fertilizer nitrogen on alcohol yield, grain yield, starch and protein content, and protein composition of winter wheat. J. Cereal Sci. 48 : 46-57.
Edney M. J., B. G. Rossnagel, Y. Endo, S. Ozawa, and M.
Brophy. 2002. Pearling quality of Canadian barley varieties and their potential uses as rice extenders. J. Cereal Sci. 36 : 295-305.
Izydorczyk M. S., L. L. Lagassé, D. W. Hatcher, J. E. Dexter, and B. G. Rossnagel. 2005. The enrichment of asian noodles with fiber-rich fractions derived from roller milling of hull-less barley. J. Sci. Food Agric. 85 : 2094-2104.
Juliano B. O. 1985. Criteria and test for rice grain qualities, in: rice Chemistry and Technology, second (ed.), AACC, St Paul, MN.
Kevin H. 2005. New varieties and techniques make barley better for fuel and food. Agricultural Research July, 53,7 : 20-21.
Lacerenza J. A., J. M. Martin, L. E. Talbert, S. P. Lanning, and M. J. Giroux. 2008. Relationship of ethanol yield to agronomic and seed quality characteristics of small grains.
Cereal Chem. 85 : 322-328.
Mccleary, B. V. and D. C. Mugford. 1992. Interlaboratory evaluation of β-glucan analysis methods. In the changing role of oats in human and animal nutrition. Proceedings of the fourth international Oat conference, Australia. Oct 19-23.
Mccleary, B. V. and R. Codd. 1991. Measurement of (1-3) (1-4)-β-D-glucan in barley and oats: a streamlined enzymic procedure. J of the Sci. of Food and Agric. 55: 303-312.
Mccleary, B. V., V. Solah, and T. S. Gibson. 1994. Quantitative measurement of total starch in cereal flours and products.
J. Cereal. Sci. 20 : 51-58.
Mccleary, B. V., V. Solah, and D. C. Mugford. 1997.
Measurement of total starch in cereal products by amyloglucosidase-α-amylase method: Collaborative study.
J. AOAC Int. 80 : 571-579.
Newman R. K., C. W. Newman, and H. Graham. 1989. The hypocholesterolemic function of barley β-glucans. Cereal Foods world 34 : 883-885.
Newman R. K. and C. W. Newman. 1991. Barley as a food grain. Cereal Foods World 36 : 800-805.
Nilan R. A. and S. E. Ullrich. 1993. Barley: taxonomy, origin, distribution, production, genetics, and breeding, in: Macgregor, A.W., bhatty, R.S.(eds), barley chemistry and technology.
AACC. ST. Paul. pp. 1-30.
Pascale C. 2008. Bioethanol from agricultural waste residues.
Environmental Progress 27 : 51-57.
Swanston J. S., A. C. Newton, J. M. Brosnan, A. Fotheringham, and E. Glasgow. 2005. Determining the spirit yield of wheat varieties and variety mixtures. J. Cereal Sci. 42 : 127-134.
Swanston J. S., P. L. Smith, T. L. Gillespie, J. M. Brosnan,
T. A. Bringhurst, and R. C. Agu. 2007. Associations between grain characteristics and alcohol yield among soft wheat varieties. J. of the Sci. of Food and Agric. 87 : 676-683.
Tomas K. C., A. Dhas, B. G. Rossnagel, and W. M. Ingledew.
1995. Production of fuel alcohol from hull-less barley by very high gravity technology. Cereal Chem. 72 : 360-364.
Wang S., H. W. Ingledew, K. C. Thomas, K. Sosulski, and F. W. Sosulski. 1999. Optimization of fermentation temperature and mash specific gravity for fuel alcohol production.
Cereal Chem. 16 : 82-86.
Wu X., D. Wang, S. R. Bean, and J. P. Wilson. 2006. Ethanol production from pearl millet using saccharomyces cerevisiae.
Cereal Chem. 83 : 127-131.