보 문
Succession of bacterial community structure during the early stage of biofilm development in the Antarctic marine environment
Yung Mi Lee
1,2, Kyung Hee Cho
1, Kyuin Hwang
1, Eun Hye Kim
1, Mincheol Kim
3, Soon Gyu Hong
1*, and Hong Kum Lee
1*
1
Division of Polar Life Sciences, Korea Polar Research Institute, Incheon 21990, Republic of Korea
2
School of Biological Sciences, College of Natural Science, Seoul National University, Seoul 08826, Republic of Korea
3
Arctic Research Center, Korea Polar Research Institute, Incheon 21990, Republic of Korea
남극 해양에서 생물막 생성 초기 단계의 세균 군집 구조 변화
이영미
1,2・ 조경희
1・ 황규인
1・ 김은혜
1・ 김민철
3・ 홍순규
1* ・ 이홍금
1*
1
극지연구소 극지생명과학연구부,
2서울대학교 생명과학대학,
3극지연구소 북극환경자원연구센터
(Received February 11, 2016; Revised March 11, 2016; Accepted March 11, 2016)
ABSTRACT: Compared to planktonic bacterial populations, biofilms have distinct bacterial community structures and play important ecological roles in various aquatic environments. Despite their ecological importance in nature, bacterial community structure and its succession during biofilm development in the Antarctic marine environment have not been elucidated. In this study, the succession of bacterial community, particularly during the early stage of biofilm development, in the Antarctic marine environment was investigated by pyrosequencing of the 16S rRNA gene. Overall bacterial distribution in biofilms differed considerably from surrounding seawater.
Relative abundance of Gammaproteobacteria and Bacteroidetes which accounted for 78.9–88.3% of bacterial community changed drastically during biofilm succession. Gammaproteobacteria became more abundant with proceeding succession (75.7% on day 4) and decreased to 46.1% on day 7. The relative abundance of Bacteroidetes showed opposite trend to Gammaproteobacteria, decreasing from the early days to the intermediate days and becoming more abundant in the later days. There were striking differences in the composition of major OTUs ( ≥ 1%) among samples during the early stages of biofilm formation. Gammaproteobacterial species increased until day 4, while members of Bacteroidetes, the most dominant group on day 1, decreased until day 4 and then increased again. Interestingly, Pseudoalteromonas prydzensis was predominant, accounting for up to 67.4% of the biofilm bacterial community and indicating its important roles in the biofilm development.
Key words: Bacteroidetes, Pseudoalteromonas, Antarctica, biofilm succession, bacterial community, pyrosequencing
*For correspondence. (H.K. Lee) E-mail: [email protected];
Tel.: +82-32-760-5569; Fax: +82-32-760-5509 (S.G Hong) E-mail: [email protected];
Tel.: +82-32-760-5580; Fax: +82-32-760-5597
A biofilm is an assemblage of microbial cells attached to a surface and encapsulated within a self-produced extracellular polymeric matrix (Donlan, 2002). Planktonic and motile bacteria transit to an aggregated biofilm on the surface by successional processes (Watnick and Kolter, 2000). Adsorption of dissolved organic molecules and primary colonization of free-living bacteria on the surface trigger the accumulation of bacteria through growth and reproduction, which modifies the characteristics of
the surface and renders it suitable for subsequent colonization by secondary microorganisms (Dang and Lovell, 2000). The primary biofilm community is formed through specific and/or nonspecific interaction between initial colonizer and planktonic bacteria and different pioneer microorganisms contribute to biofilm formation in different environments (Dang and Lovell, 2000; Lee et al., 2008). Biofilm maturation proceeds by synergistic and/or competitive interactions among colonized species, as well as through recruitment of new species and/or loss of colonized species (Dang and Lovell, 2000).
Microbial biofilms are ubiquitous in aquatic environments
(Sekar et al., 2002) and formed on a wide variety of surfaces, including medical or industrial devices, pipelines, water filtration systems, and body surfaces of marine organisms in natural aquatic systems (Gillan et al., 1998; Dang and Lovell, 2000;
Armstrong et al., 2001). Biofilms are a protective mode of growth that allows microorganisms to survive in hostile or oligotrophic environments by increasing access to nutrients, allowing co- metabolic interactions with neighboring microorganisms, and protecting against toxins and antibiotics (Costerton et al., 1999;
Dang and Lovell, 2000). In addition, biofilms play a key role in primary production, biodegradation of organic matter and environmental pollutants, and nutrient recycling in nature (Dang and Lovell, 2000). On the other hand, biofilms can be detrimental to the surfaces of man-made structures such as ships and bridges in aquatic environments (Gaylarde and Morton, 1999; Dang and Lovell, 2000; Flemming, 2002). Due to such profound importance of biofilms in ecology and industry, many studies have been performed on the bacterial communities, developmental processes, and physiology of biofilms in various aquatic environments, and methods to control biofilm formation have been developed (Gaylarde and Morton, 1999; Dang and Lovell, 2000; Armstrong et al., 2001; Molin and Tolker-Nielsen, 2003; Webster et al., 2006; Webster and Negri, 2006; Jones et al., 2007; Egan et al., 2008; Lee et al., 2008).
Antarctic marine environments that experience seasonal advance and retreat of pack ice are usually characterized by low temperature (usually -1.8 –6°C) and extreme seasonal variations in irradiance and day length (Sakshaug and Slagstad, 1991;
Delille, 1996). Biofilm formation may help microorganisms adapt to the harsh Antarctic marine environment by increasing resistance to such environmental stresses and contributing to nutrient cycling. However, few studies had been performed focusing on microbial community dynamics during the biofilm formation in the different types of surfaces in Antarctic marine environments (Maki et al., 1990; Webster et al., 2006; Webster and Negri, 2006). In addition, investigating the composition and diversity of early microbial colonizers during biofilm formation in natural marine environments of Antarctica is challenging due to the practical problem of conducting experiment in cold environments. Previous studies on microbial community changes during biofilm development had been performed in natural environments of temperate areas by using fingerprinting
techniques (Moss et al., 2006; Jones et al., 2007; Lee et al., 2008; Pohlon et al., 2010; Salta et al., 2013), which suffer from a low taxonomic resolution. Thus, application of next-generation sequencing technology that allows the better characterization of the unseen realm is required for the analysis of unexplored bacterial community of biofilm formed in Antarctic marine environments.
In this respect, the objectives of this study were to investigate i) the differences in the bacterial communities between free- living bacteria and attached bacteria, and ii) the pioneering species and bacterial diversity during the early stage of biofilm establishment by using pyrosequencing technology.
Materials and Methods
Sample collection and processing
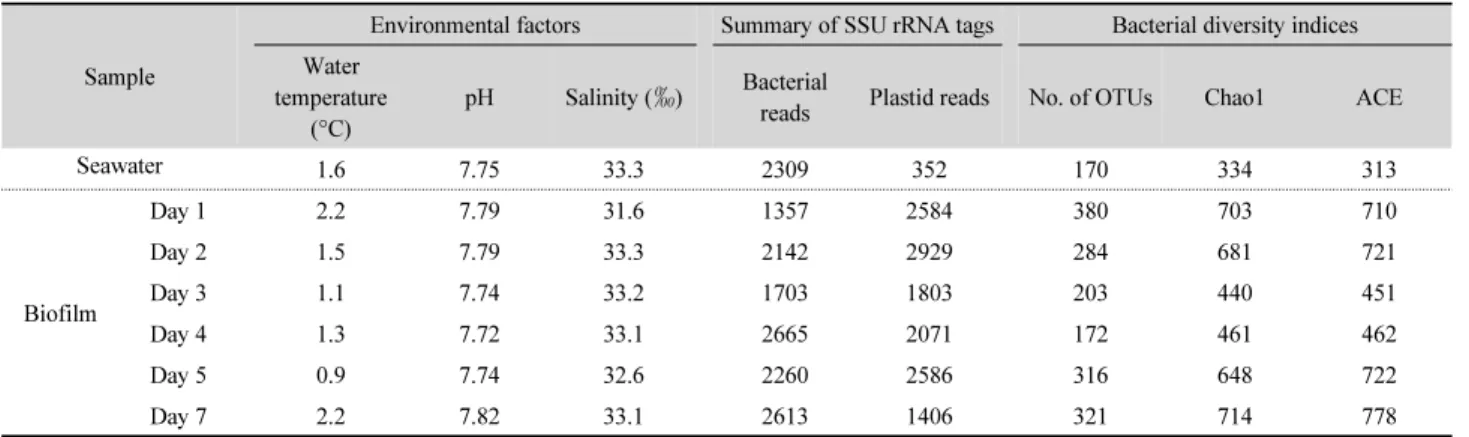
Acryl plates (200 mm × 300 mm × 3 mm) were cleaned with dish-cleaner, washed with sterilized water, and then submerged in seawater at a depth of approximately 30–60 cm vertically in the coastal area near King Sejong Station, King George Island, Antarctica (62°13'20.67''S, 58°47'11.32''W) from January 15 – 21, 2007. A subset of acryl plates (40 plates at day 1 and 20 plates each day from days 2–7) was retrieved at intervals of 24 h, rinsed with 0.2-µm-filtered seawater, and harvested by scraping with a razor blade. Two-liters of seawater were collected on January 13, 2007 and microorganisms present in this sample were concentrated using 0.2-µm Sterivex filters (Millipore) to compare bacterial community with biofilm samples. Harvested samples were transported to the laboratory in Korea at -20°C and preserved at -80°C until genomic DNA extraction. Environmental conditions of seawater during the experiment are presented in Table 1. Water temperature ranged from 0.9 to 2.2°C, pH ranged from 7.72 to 7.92, and the salinity was 31.6 –33.6‰ during biofilm formation (Table 1).
Genomic DNA extraction and PCR amplification
Total genomic DNA was extracted from the seawater and
biofilm samples using a modified CTAB method (Stewart and
Via, 1993) as follows. A biofilm sample (0.5 ml) or filtered
seawater membrane was placed in 0.7 ml of extraction buffer
Table 1. Description of sampling site and SSU rRNA tag characteristics
Sample
Environmental factors Summary of SSU rRNA tags Bacterial diversity indices Water
temperature (°C)
pH Salinity ( ‰) Bacterial
reads Plastid reads No. of OTUs Chao1 ACE
Seawater 1.6 7.75 33.3 2309 352 170 334 313
Biofilm
Day 1 2.2 7.79 31.6 1357 2584 380 703 710
Day 2 1.5 7.79 33.3 2142 2929 284 681 721
Day 3 1.1 7.74 33.2 1703 1803 203 440 451
Day 4 1.3 7.72 33.1 2665 2071 172 461 462
Day 5 0.9 7.74 32.6 2260 2586 316 648 722
Day 7 2.2 7.82 33.1 2613 1406 321 714 778
* Bacterial diversity indices of Chao1 and ACE were calculated for 1,357 resampled bacterial sequences from each sample.
(2% [w/v] CTAB, 1.42 M NaCl, 20 mM EDTA, 100 mM Tris-HCl; pH 8.0, 1% (w/v) Polyphenolpyrollidine-40) with 0.2 g of glass beads and incubated at 37°C for 15 min. Lysozyme (0.4 ml of a 5 mg/ml solution) was added and incubated at 37°C for 15 min, then the mixture was shaken at 140 rpm for 1 h.
Following addition of 20 µl of proteinase K (20 mg/ml) and 200 µl of 10% (w/v) sodium dodecyl sulfate, mixtures were incubated at 65°C for 1 h. Samples were centrifuged at 14,000 × g for 10 min at 4°C, and then the upper phase was transferred to a fresh microcentrifuge tube. Following phenol:chloroform:isoamyl alcohol (25:24:1) extraction, DNA was recovered by precipitation with 0.6 volumes of isopropanol. The quality of genomic DNA was assessed using agarose gel electrophoresis.
To amplify bacterial 16S rDNA sequences, primers 27F (5 ′- TGCTGCCTCCCGTAGGAGT-3′) (Lane, 1991) and 338R (5′- AGAGTTTGATCCTGGCTCAG-3′) (Field et al., 1997) with barcodes and adapter were used. PCR was carried out in 100-µl reaction mixtures containing 10× PCR reaction buffer, 160 µM dNTPs, 0.5 µM of each primer, approximately 10 ng of gDNA, and 2.5 units of Taq DNA polymerase (In-Sung Science). The PCR procedure included an initial denaturation step at 95°C for 5 min, 25 cycles of amplification (95°C for 0.5 min, 57°C for 0.5 min, and 72°C for 0.5 min), and a final extension step at 72°C for 7 min. Each sample was amplified in triplicate and pooled. PCR products were purified using a LaboPass purification kit (Cosmogenetech).
Pyrosequencing and sequence analysis
Sequencing of 16S rDNA amplicons was performed by
Macrogen using a 454 GS-FLX sequencer (Roche). Pre-processing was conducted using PyroTrimmer (Oh et al., 2012). Sequences were processed to remove primer, linker, and barcode sequences. The 3′ ends of sequences with low quality values were trimmed when average quality scores for a 5-bp window size were lower than 30. Sequences with ambiguous nucleotides or shorter than 180 bp were discarded. Chimeric reads were detected and discarded using the de novo chimera detection algorithm UCHIME (Edgar et al., 2011). Sequence clustering was performed by CLUSTOM (Hwang et al., 2013), with a 97%
similarity cutoff. Taxonomic assignment was conducted for representative sequences of each cluster by EzTaxon-e database search (Kim et al., 2012). Sequences that were assigned to the plastid or unassigned to any domain were excluded based on the results of EzTaxon-e database search for bacterial community analyses. Low quality result for day 6 sample was excluded for the further analysis.
Statistical analysis
Diversity indices, including operational taxonomic unit (OTU)
richness, Chao1, and ACE indices, were calculated from 100
sets of randomly subsampled 1,357 sequences, which is the
lowest number of reads among samples. Rarefaction curves
were analyzed using the MOTHUR program (v. 1.33.2) at a
genetic distance of 3% (Schloss et al., 2009). Relatedness
among samples was assessed by principal coordinates analysis
(PCoA) using the weighted algorithm of Fast UniFrac (Hamady
et al., 2009). Phylogenetic tree for fast UniFrac analysis was
prepared by aligning sequences against pre-aligned SILVA
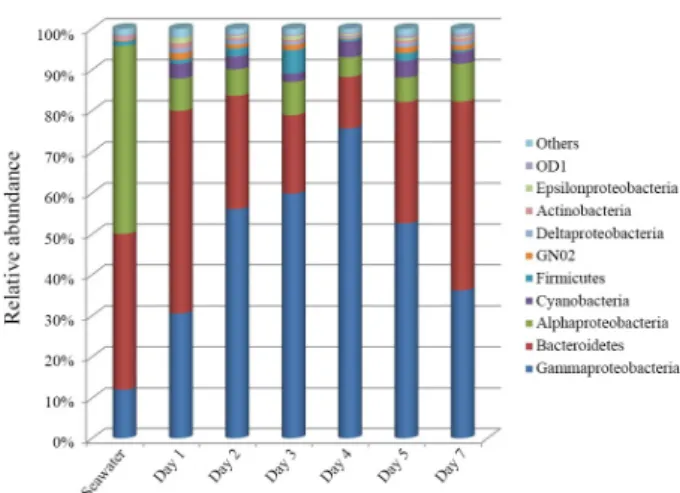
Fig. 1. Bacterial community composition at the phylum or proteobacterial class level. Others include Betaproteobacteria, Fusobacteria, Acidobacteria, Lentisphaerae, Chloroflexi, TM7, Tenericutes, Planctomycetes, TM6, Proteobacteria_uc, Chlorobi, Fibrobacteres, Armatimonadetes, Verruco- microbia, Caldithrix_p, Gemmatimonadetes, SAR406, Spirochaetes, GN04, SR1, DQ404828_p, DQ499300_p, WS3, 4P001694_p, OP3, Deinococcus- Thermus, and EF092200_p.
reference sequences in MOTHUR and phylogenetic tree reconstruction using a neighbor-joining algorithm with Jukes &
Cantor model (Jukes and Cantor, 1969) in the MEGA 6 program (Tamura et al., 2013). OTU abundance data were prepared by logarithmic transformation of percent abundance + 1 and used for weighted Fast UniFrac analysis. Patterns of major OTU (>
1%) increase and decrease were assessed by Pearson correlation coefficients between time lapse and relative abundance using the R software package (www.r-project.org).
Nucleotide sequence accession numbers
Sequences obtained by pyrosequencing technology have been deposited in the Short Read Archive of the National Center for Biotechnology Information under accession numbers from SAMN03265448 to SAMN03265454.
Results
Bacterial community structure
Clustering of sequences from six biofilm samples and one seawater sample produced 1,217 bacterial OTUs, with 538 singleton OTUs. Fifty-four OTUs were shared among all biofilm samples. Among them, 29 OTUs were also shared with the seawater sample.
Among the 2,661 sequence reads from control seawater, 2,309 sequences (86.8%) were from bacteria and the remainder (13.2%) was from eukaryotic plastids (Table 1). Bacterial sequences were clustered into 170 OTUs and were assigned to 18 major bacterial taxonomic groups. Alphaproteobacteria, Bacteroidetes, and Gammaproteobacteria were the predominant taxonomic groups, accounting for 45.8%, 38.0%, and 12.0% of the bacterial community, respectively (Fig. 1).
The number of sequence reads from biofilm samples ranged between 3,506 and 5,071 (Table 1). Among them, bacterial sequences accounted for 34.4 –65.0% of the total number of sequences obtained and they were assigned to 38 major taxonomic groups of bacteria. The most abundant taxonomic groups were Gammaproteobacteria (30.6–75.7%), Bacteroidetes (12.6 –49.4%), Alphaproteobacteria (4.8–9.2%), Cyanobacteria (2.1 –4.1%), Firmicutes (0.5–5.7%), GN02 (0.2–1.7%), Delta-
proteobacteria (0.5–1.1%), Actinobacteria (0.3–1.3%), Epsilon- proteobacteria (0.3–1.4%), and OD1 (0.1–0.7%) (Fig. 1).
Relative abundance of Gammaproteobacteria increased from 30.6% on day 1 to 75.7% on day 4 and then decreased to 36.2%
(Fig. 1). Bacteroidetes accounted for 49.4% of the day 1 biofilm sample, but decreased to 12.6% on day 4, and then increased to 46.1% on day 7. Abundance of Alphaproteobacteria ranged between 4.8% and 9.2% and showed no significant change during biofilm development. Abundance of Cyanobacteria ranged between 2.1% and 4.1%. Actinobacteria showed the highest relative abundance on day 1, accounting for 1.3% and then decreased to 0.3% on day 4. The relative abundance of Firmicutes was highest on day 3, accounting for 5.7% of the bacterial community. The other major taxonomic groups, which accounted for less than 1% of the total number of bacterial sequences, included Lentisphaerae, Chloroflexi, TM7, Tenericutes, Planctomycetes, TM6, Chlorobi, Fibrobacteres, Armatimonadetes, Verrucomicrobia, Caldithrix_p, Gemmatimonadetes, SAR406, Spirochaetes, GN04, SR1, DQ404828_p, DQ499300_p, WS3, 4P001694_p, OP3, Deinococcus-Thermus, and EF092200_p.
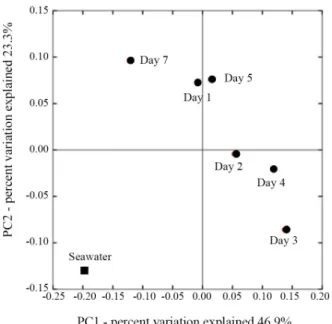
PCoA results, based on weighted UniFrac distances between
OTUs, showed a succession of bacterial populations during early
stage of biofilm formation and the bacterial community of
seawater was clearly distinguished from those of biofilms (Fig. 2).
Fig. 2. Principal coordinates analysis (PCoA) of bacterial communities by weighted Fast UniFrac analysis. Filled square indicates seawater sample and filled circles indicate biofilm samples. The proportion of variance explained by ordination axes is represented on each axis.
Fig. 3. Number of OTUs of each bacterial phylum or proteobacterial class.
Others include Betaproteobacteria, Fusobacteria, Acidobacteria, Lenti- sphaerae, Chloroflexi, TM7, Tenericutes, Planctomycetes, TM6, Proteo- bacteria_uc, Chlorobi, Fibrobacteres, Armatimonadetes, Verrucomicrobia, Caldithrix_p, Gemmatimonadetes, SAR406, Spirochaetes, GN04, SR1, DQ404828_p, DQ499300_p, WS3, 4P001694_p, OP3, Deinococcus- Thermus, and EF092200_p.
OTU diversity change during biofilm development Rarefaction curves and diversity indices (Chao1 and ACE) calculated from 1,357 resampled sequence reads for each sample at 97% similarity levels revealed that the biofilm samples showed a higher level of bacterial diversity than seawater (Table 1, Fig. 3, and Supplementary data Fig. S1). Bacterial OTU richness on day 1 was 703 and 710, as represented by Chao1 and ACE indices, respectively, which was almost twice of that of seawater. During biofilm formation, Chao1 and ACE values decreased until day 3 and then increased again.
The number of OTUs in the biofilm ranged from 172 to 380 (Table 1 and Fig. 3). In terms of OTU richness, the phylum Bacteroidetes was the largest group, followed by the classes Gammaproteobacteria and Alphaproteobacteria (Fig. 3). The number of OTUs affiliated with Bacteroidetes and Gamma- proteobacteria decreased until day 4, and then increased again (Fig. 3). The number of OTUs affiliated with Bacteroidetes decreased from 193 on day 1 to 96 on day 3 and then increased to 250 on day 7 (Fig. 3). Similarly, the number of OTUs affiliated with Gammaproteobacteria decreased from 85 on day 1 to 49 on day 3. The decrease of Bacteroidetes OTU numbers paralleled the decrease in their relative abundance in the bacterial community. However, the relative abundance of
Gammaproteobacteria was negatively correlated with OTU number, which may indicate the presence of major OTUs of Gammaproteobacteria that accounts for the high proportion in the biofilm bacterial community (Figs. 1 and 3).
Compositional change of major OTUs
Thirty-six major OTUs with 1% or higher relative abundance in at least one biofilm sample were selected to investigate the dynamics of bacterial community composition. Sequence similarities between major OTUs and their closely related type strains ranged from 83.8% to 100% (Table 2). Major OTUs were affiliated with Bacteroidetes, Cyanobacteria, Firmicutes, Gammaproteobacteria, and Alphaproteobacteria.
Correlation between abundance of major OTUs and sampling time was analyzed by Pearson correlation analysis.
Negative values indicate that the OTUs are early colonizers and positive values indicate that they are late colonizer during biofilm development. The most evident pioneer species were those that are related to Polaribacter filamentus (96.5% sequence similarity), Psychrobacter okhotskensis (100%), and Halomonas sulfidaeris (100%) (Pearson correlation, r = -0.93, r = -0.84, r = -0.82, respectively and all P < 0.05) (Table 2). The other early colonizers mostly belonged to Bacteroidetes and Proteobacteria.
The predominant late colonizers included OTUs related to
Tenacibaculum dicentrarchi (96.5% sequence similarity),
Table 2. Heat map and taxonomic affiliation of major OTUs of biofilm. Major OTUs with 1% or higher compositions at least in one biofilm sample were selected. The color gradient from white to black indicates the lowest to highest relative abundance values
OTU ID
Day
Average
ǂPearson correlation coefficients
Closest known species
§1 2 3 4 5 7 Phylum Species name Accession no. Similarity
(%) OTU 41 2.10 2.09 1.17 0.82 0.90 0.38 1.25 -0.93* Bacteroidetes Polaribacterfilamentus U73726 96.5 OTU 22 1.11 1.31 1.22 0.60 0.80 0.46 0.92 -0.84* Gammaproteobacteria Psychrobacterokhotskensis AB094794 100.0 OTU 14 1.69 2.99 2.00 0.68 0.62 0.04 1.34 -0.82* Gammaproteobacteria Halomonas sulfidaeris AF212204 100.0 OTU 51 1.33 0.61 0.41 0.11 0.31 0.11 0.48 -0.81 Alphaproteobacteira Pelagibacterubique CP000084 98.6 OTU 87 1.62 0.51 0.35 0.30 0.18 0.04 0.50 -0.80 Cyanobacteria Synechococcus rubescens AF317076 83.8 OTU 40 3.39 0.93 0.65 0.34 0.39 0.23 0.99 -0.74 Bacteroidetes Polaribacter irgensii AAOG01000005 96.0 OTU 26 1.92 3.03 2.58 1.01 1.33 0.96 1.81 -0.71 Bacteroidetes Ulvibacter litoralis AY243096 91.8 OTU 91 1.69 0.22 0.36 0.23 0.18 0.04 0.45 -0.70 Gammaproteobacteria Pseudomonas sabulinigri EU143352 100.0 OTU 48 1.33 3.50 2.47 0.64 0.66 0.19 1.46 -0.68 Gammaproteobacteria Pseudoalteromonastranslucida AY040230 100.0 OTU 58 0.52 1.31 1.29 0.30 0.27 0.04 0.62 -0.65 Bacteroidetes Mesonia algae AF536383 99.6
OTU 366 7.44 0.09 0.00 0.00 0.00 0.00 1.26 -0.61 Bacteroidetes Flavobacterium degerlachei AJ557886 99.6 OTU 402 1.11 0.00 0.00 0.00 0.00 0.00 0.18 -0.60 Gammaproteobacteria Pseudomonas abietaniphila AJ011504 100.0 OTU 279 1.55 0.00 0.00 0.00 0.09 0.00 0.27 -0.59 Gammaproteobacteria Shewanellaarctica GU564402 100.0 OTU 62 0.88 1.21 1.76 0.60 0.53 0.54 0.92 -0.55 Alphaproteobacteira Erythrobacter citreus AF118020 100.0 OTU 80 0.37 0.05 1.06 0.08 0.09 0.04 0.28 -0.35 Gammaproteobacteria Psychrosphaera saromensis AB545807 100.0 OTU 49 0.66 1.54 0.29 0.38 1.55 0.19 0.77 -0.26 Firmicutes Lactobacillus delbrueckii AY050172 99.6 OTU 7 1.77 1.49 0.47 0.41 2.04 1.00 1.20 -0.19 Gammaproteobacteria Colwellia demingiae U85845 100.0 OTU 373 0.00 0.00 4.99 0.00 0.00 0.00 0.83 -0.15 Firmicutes Bacillus muralis AJ628748 100.0 OTU 109 0.00 0.33 1.23 0.15 0.09 0.15 0.33 -0.14 Gammaproteobacteria Oceaniserpentilla haliotis AM747817 97.8 OTU 86 0.96 1.59 0.70 1.80 1.06 1.07 1.20 -0.03 Gammaproteobacteria Marinobacter vinifirmus DQ235263 99.6 OTU 13 1.95 2.05 1.25 0.45 1.07 2.42 1.53 0.02 Bacteroidetes Polaribacter irgensii AAOG01000005 97.8 OTU 1 5.53 33.74 44.16 67.43 38.89 26.71 36.08 0.29 Gammaproteobacteria Pseudoalteromonas prydzensis U85855 100.0 OTU 15 0.96 0.56 0.06 0.11 0.84 1.22 0.63 0.33 Gammaproteobacteria Cocleimonas flava AB495251 94.5 OTU 11 0.44 0.40 1.58 0.43 0.52 1.40 0.80 0.44 Alphaproteobacteira Octadecabacter jejudonensis KF515220 98.7 OTU 8 1.77 1.35 0.41 1.20 2.17 2.60 1.58 0.56 Bacteroidetes Lewinella persica ARDG01000103 84.5 OTU 4 1.55 1.46 1.53 1.85 1.31 2.30 1.67 0.63 Alphaproteobacteira Loktanella tamlensis DQ533556 97.4 OTU 29 0.81 2.00 1.59 3.08 3.41 2.31 2.20 0.65 Cyanobacteria Synechococcus elongatus CP000100 92.9 OTU 38 0.22 0.51 0.18 0.34 1.24 0.80 0.55 0.65 Bacteroidetes Aquimarina addita HM475137 96.1 OTU 57 0.07 0.05 0.00 0.04 0.04 1.10 0.22 0.74 Bacteroidetes Polaribacter irgensii AAOG01000005 97.5 OTU 45 0.00 0.09 0.47 0.11 0.13 2.10 0.49 0.77 Bacteroidetes Dokdonia genika AB198086 97.9 OTU 12 0.66 0.61 0.59 0.45 1.55 1.76 0.94 0.80 Bacteroidetes Lewinella cohaerens ARBR01000027 85.1 OTU 31 0.15 0.33 0.00 0.08 0.77 3.31 0.77 0.81 Bacteroidetes Polaribacter irgensii AAOG01000005 98.7 OTU 215 0.00 0.00 0.00 0.08 0.22 2.10 0.40 0.81 Bacteroidetes Bizionia paragorgiae AY651070 93.9 OTU 39 0.07 0.19 0.00 0.08 0.49 1.11 0.32 0.85* Bacteroidetes Tenacibaculum dicentrarchi FN545354 96.5 OTU 35 0.15 0.33 0.23 0.15 1.24 3.14 0.87 0.86* Bacteroidetes Algibacter mikhailovii AM491809 92.3 OTU 20 0.15 0.09 0.18 0.23 0.45 1.04 0.36 0.90* Bacteroidetes Polaribacter butkevichii AY189722 95.7
§