SRAP 분석에 의한 중국 재배삼의 유전적 다양성
Young Hua Xu*·Hui Jin**·김영창***·방경환***·차선우***†·Lian Xue Zhang*† 중국길림농업대학교, 중국길림인삼연구원, 농촌진흥청 국립원예특작과학원
Genetic Diversity and Genetic Structures in Ginseng Landraces (Cultivars) by SRAP Analysis
Yong Hua Xu
*, Hui Jin
**, Young Chang Kim
***, Kyong Hwan Bang
***, Seon Woo Cha
***†, Lian Xue Zhang
*†*College of Chinese Medicinal Materials, Jilin Agricultural University,Changchun 130118 P.R. China.
**
Jilin Institute of Ginseng Research, Tonghua, Jilin134001 P.R. China.
*** Department of Herbal Crop Research, NIHHS, RDA, Eumseong 369-873, Korea.
ABSTRACT : We investigated genetic diversity among and within the populations of cultivated ginseng (Panax ginseng C. A. Meyer ) using SRAP profiles. A total of 24 ginseng plants were sampled from the three populations (two from China, one from Korea). Since all these populations are previously shown closely related to each other assister groups, we used Panax quinquefolium L. and wild ginseng as a reference species, which is not "within the sister group". All individu- als from the three populations were screened with a total of 36 primer pairs with 26 primers generated from 328 SRAP bands of DNA gels. The mean gene diversity (H
E) was estimated to be 0.057 within populations (range 0.032-0.067), and 0.086 at the species level. The genetic differentiation (Gst = 0.31) indicates that genetic variation apportioned 30% among populations and 70% within populations. Generally, the result of this study indicates that ginseng contains high molecu- lar variation in its populations.
Key Words : Ginseng, SRAP, Genetic Variance
INTRODUCTION
Ginseng ( Panax ginseng C. A. Meyer) has been grown as a medicinal herb in several countries including China and Korea. Dried root of ginseng has been applied as a tonic, prophylactic and anti-aging agent in many Asian countries including China, Japan and Korea (Carlson, 1986;
Cheung et al ., 1994). Ginseng is becoming one of the best plant for medicinal herbs and is widely cultured in the Northeast of China. With the development of market demand, quality of ginseng needs to be improved and elite cultivars are urgently required for ginseng production.
Because of many biological complexities such as natural heterozygote and cross-incompatibility, the analysis of the genetic relationships among inbred lines is of interest not only for germplasm conservation, but also for breeding
purposes.
Ginseng is one of the most economically important medicinal plant in the world (Carlson, 1986; Cheung et al ., 1994; Ngan et al ., 1999), but there are fewer reports on genetic variations and relationship in ginsengs (Zhuravlev et al ., 1998; Ma et al ., 1999, Seo et al ., 2003, In et al ., 2005). Genetic structure among and within a population depends on the life history of a species (Fisher and Matthies, 1998; Fisher et al ., 2000). Thus, the knowledge of the genetic structure allows us to infer the past history of a species. At the same time, genetic variations represent a starting point of further evolution and an important prerequisite for the prediction of evolutionary responses.
Sequence-related amplified polymorphism (SRAP) (Li and Quiros, 2001), which preferentially amplifies open reading frames (ORFs), was employed and the observed polymor-
†
Corresponding author: (Phone) +82-43-871-5530 (E-mail) [email protected] or (Phone) +86-431-8453-2952 (E-mail) [email protected]
Received 2010 March 12 / 1st Revised 2010 April 26 / 2nd Revised 2010 June 7 / 3rd Revised 2010 June 11 / Accepted 2010 June 14
phism fundamentally originated in the variation of the length of these introns, promoters and spacers both among individuals and among species. SRAP had been applied extensively in genetic linkage map construction (Sun et al ., 2007), genetic diversity analysis, and comparison. The aim of the present study is to analyze the variability of ginseng inbred lines to provide precision genetic information for the future breeding program.
MATERIALS AND METHODS
1. Plant Materials
We collected 24 ginseng accessions from two populations of cultivated ginseng grown in northeastern china and a population from Korea and used a North Korea ginseng, a wild ginseng and an American ginseng ( Panax quinquefolium L.) as reference individuals (Table 1).
2. DNA Extraction and SRAP Analysis
The total genomic DNA was extracted from young leaves
or dried ginseng roots by the CTAB method as described by Doyle and Doyle (1987). 10 ng/ul DNA templates were made using TE (10 mM Tris–HCl, 0.1 mM EDTA, pH 8.0).
All SRAP primer combinations were initially screened using a group of ten samples (Table 2). The sixteen primer pairs that produced scorable polymorphic bands were used to amplify the rest of the accessions. Each of 15 mL reaction consisted of 1.33 mM of primers, 200 mM of each dNTP, 1.5 ㎖ of 10 × PCR Buffer, 2 mM of MgCl2, 0.8 ㎎ / ㎖ Bovine serum albumin, 5.8 ㎖ ddH
2O, 1 unit of Taq polymerase and 20 ng of template. DNA Thermal Cycler (ABI2720, USA) was used and cycling parameters included 2 min of denaturing at 94 ℃ , five cycles of three steps: 1 min of denaturing at 94 ℃ , 1 min of annealing at 35 ℃ and 1 min of elongation at 72 ℃ In the following 35 cycles the annealing temperature was increased to 50 ℃ , and for extension, one cycle 5 min at 72 ℃ . PCR amplification products were separated by electrophoresis using 6%
denaturing polyacrylamide gels and were visualized following silver staining method as described by Bassam et al ., (1991).
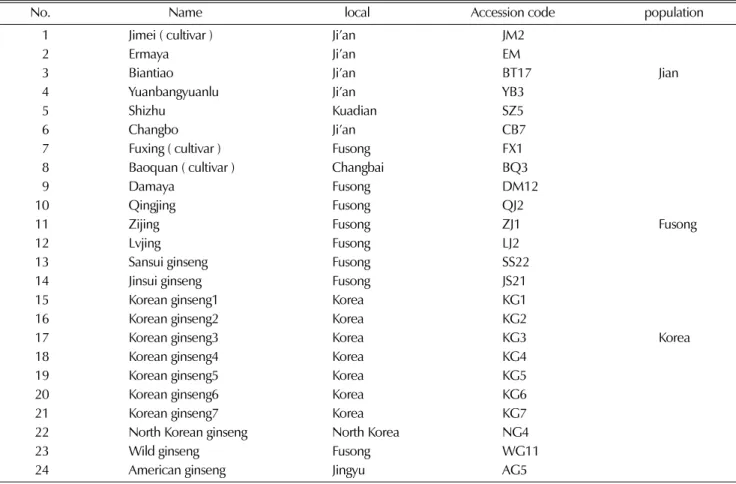
Table 1.
Plant material used in this study.
No. Name local Accession code population
1 Jimei ( cultivar ) Ji’an JM2
2 Ermaya Ji’an EM
3 Biantiao Ji’an BT17 Jian
4 Yuanbangyuanlu Ji’an YB3
5 Shizhu Kuadian SZ5
6 Changbo Ji’an CB7
7 Fuxing ( cultivar ) Fusong FX1
8 Baoquan ( cultivar ) Changbai BQ3
9 Damaya Fusong DM12
10 Qingjing Fusong QJ2
11 Zijing Fusong ZJ1 Fusong
12 Lvjing Fusong LJ2
13 Sansui ginseng Fusong SS22
14 Jinsui ginseng Fusong JS21
15 Korean ginseng1 Korea KG1
16 Korean ginseng2 Korea KG2
17 Korean ginseng3 Korea KG3 Korea
18 Korean ginseng4 Korea KG4
19 Korean ginseng5 Korea KG5
20 Korean ginseng6 Korea KG6
21 Korean ginseng7 Korea KG7
22 North Korean ginseng North Korea NG4
23 Wild ginseng Fusong WG11
24 American ginseng Jingyu AG5
3. Data Analysis
Each band was scored as present (1) or absent (0) and data were analyzed with the Numerical Taxonomy Multivariate Analysis System (NTSYS-pc) software package (Rohlf, 1998). A similarity matrix was constructed based on Dice’s coefficient which considers only one to one matches between two taxa for similarity. The similarity matrix was used to construct a dendrogram using the unweighted pair group method arithmetic average (UPGMA) to determine genetic relationships among the germplasm studied.
Genetic diversity analyzed using POPGENE 1.32 software (Francis and Yang, 2000). The following genetic diversity parameters were determined: 1) the number of polymorphic loci ( A ) and the percentage of polymorphic loci ( P ); 2) the average number of alleles per loci ( Na ); 3) the effective number of alleles per loci ( Ne ); 4) gene diversity ( H ) and Shannon’s information index ( I ); 5) Nei’s genetic distances ( D ) and genetic identity ( IN ); and 6) the coefficient of gene differentiation amongst populations within species was calculated using Nei’s gene diversity method. The formula was GST = DST / HT , HT = Hs + DST , where HT is the total gene diversity, Hs is the gene diversity within population and DST is the gene diversity between populations. Gene flow was determined as Nm = 0.5(1 − GST ) / GST . Analysis of Molecular Variance was carried out on the SRAP data
using the WinAMOVA 1.55 program (Excoffier, 1992).
RESULTS
1. Polymorphism of SRAP amplified bands by different primer combinations
On the basis of preliminary testing, 16 sets of primers, which steadily produced well-defined and scorable amplifi- cation products, showed polymorphisms in all 24 genotypes.
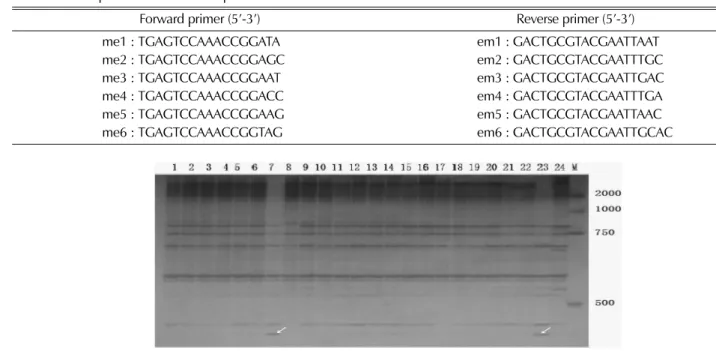
Fig. 1 shows the amplification profile of primer combination Me5/Em3, which showed a special band differed Fuxing and wild ginsneg from the another material used in the wild ginseng from another material used in the experiment. A total of 348 bands were observed among which 201were polymorphic (57.75%), ranging between 11 (Me5/Em2 and Me/Em1) and 29 (Me1/Em6) per primer combination, with an average of 21.75 bands per primer set.
2. Phylogenetic analysis
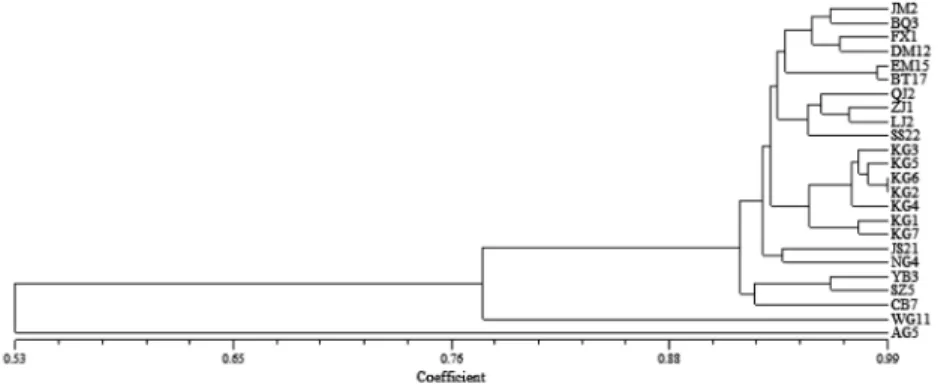
A dendrogram based on the Jaccard similarity coefficients of the 24 accessions was constructed (Fig. 2). The cluster from SRAP analysis grouped the 24 samples into 4 major groups at a similarity index value of 0.92. The first group consisted of 19 accessions mainly from China and Korea.
The landraces Changbo, Yuanbangyuanlu and Shizhu formed
Fig. 1.
SRAP Banding pattern of primer M5E3. 1-24, 24 ginseng accessions. Polyacrylamide gel was used for gel images having the DNA size marker ‘M’ ( DL2000 marker).
Table 2.
SRAP primer used in this experiment.
Forward primer (5’-3’) Reverse primer (5’-3’)
me1 : TGAGTCCAAACCGGATA em1 : GACTGCGTACGAATTAAT
me2 : TGAGTCCAAACCGGAGC em2 : GACTGCGTACGAATTTGC
me3 : TGAGTCCAAACCGGAAT em3 : GACTGCGTACGAATTGAC
me4 : TGAGTCCAAACCGGACC em4 : GACTGCGTACGAATTTGA
me5 : TGAGTCCAAACCGGAAG em5 : GACTGCGTACGAATTAAC
me6 : TGAGTCCAAACCGGTAG em6 : GACTGCGTACGAATTGCAC
the second group and the group third and forth included American ginseng and wild ginseng, respectively. The relationships observed in the UPGMA analysis are mirrored in the PCA (Fig. 3): about 80.45% of the total variation was described by the first three PCA and the genetic diversity structure was shown generally in line with the geographical structure of the species at small geographical scale. It is noticeable that PCA axis 1 explained 72.14% of the variation and clearly separates out China and Korean populations from sampling sites.
3. Population genetic diversity, differentiation ( GST ), and gene flow ( Nm )
The Table 3 showed that the highest Nei’s gene diversity index ( H ) was observed in Jian population ( H = 0.0726), and
the genetic diversity index of Fusong and Korea populations were 0.0668 and 0.0326, respectively. The Nei’s gene diversity index ( H
T)was 0.0863 at species level, and the average Nei’s gene diversity index was H
S= 0.0573 within the population. Genetic differentiation coefficient between populations ( GST ) was 0.3410. The genetic variation between populations accounted for 34.1% of total variations. Shannon’s information index in Ji’an population ( I = 0.1051) was higher than in Fusong ( I =0.0980) and Korea ( I =0.0485); Shannon’s information index at species level was 0.1358, and the average index value within population was 0.0838. The gene flow Nm was 0.9662 according to the genetic differentiation coefficient between populations ( GST = 0.3410).
In agreement with the analysis from Nei’s diversity statistics, AMOVA analysis showed significant (p < 0.01) variation among populations (30%), which was lower than the within population (70 %) genetic variation (Table 4).
4. Genetic identity and genetic distance between populations
To quantitatively assess genetic differentiation between populations, Nei’s genetic identity I N and genetic distance D were calculated (Table 5). Population genetic identity ranged from 0.9474-0.9692 and the genetic distance varied from 0.0313to 0.0541. This indicates that the similarity degree
Fig. 3.
Principal component analysis based on SRAP patterns in cultivated ginseng, 1-22, 22 cultivated ginseng in Table 1.
Fig. 2.
Dendrogram of 24 ginseng accessions clustered based on SRAP Marker.
Table 3.
Summary of genetic variations for populations.
Population Sample size Na Ne H I
Specie level 21 1.3284 1.1368 0.0863 0.1358
Jian 86 1.1791 1.1325 0.0726 0.1051
Fusong 88 1.1791 1.1201 0.0668 0.0980
Korea 87 1.0945 1.0583 0.0326 0.0485
Populations Observed number of alleles (Na) Effective number of alleles (Ne)
Nei’s gene diversity (H) Shannon’s information index (I)
was higher between populations and the genetic distance was smaller. The similarity degree between Jian and Fusong was the highest and the genetic identity was 0.9692; the genetic distance (0.0541) between Ji’an and Korea was the largest, genetic differentiation was the highest.
DISCUSSION
SRAP has been proved to be a method with a high resolution for detection of genetic variations among and within populations of ginsengs. With 16 primer pairs, we could differentiate 24 SRAP-phenotypes among 24 plants studied. In the present study, SRAP revealed low genetic diversity ( H
T= 0.175) in ginsengs. On one hand, ginseng depends on self-pollination to propagate. This mode of reproduction lacks genetic recombination and thus results in low level of genetic diversity. On the other hand, long-term artificial selection can also reduce the genetic diversity.
When people select landraces, they usually focus on the forms with high economic values, for example, special root shape and high yield, etc. As a result, substantial genetic variation from ancestral gene pool is lost during domesti- cation.
A phenogram representing varieties relatedness, based on the analysis of SRAP loci, showed four major clusters separated at 92% similarity. No clear separation according
to their geographical origins was observed. American ginseng and ginsengs spanned the two extremes in the dendrogram at a similarity index value of 0.52.
The genetic structure of plant populations reflects the interactions of various factors, including the long-term evolutionary history of the species (shifts in distribution, habitat fragmentation, and population isolation), genetic drift, mating system, gene flow and selection (Schaal et al ., 1998). In the present study, there was high level of genetic differentiation ( G
ST= 0.341) among populations. The result is concordant with the reported by Kim and Cho (2003).
This could be attributed to random genetic drift and differential selection pressure (by the environment). According to Slatkin (1981, 1985), Caccone (1985) and Waples (1987) Nm values can be grouped into three categories: high ( Nm
> 1.000), intermediate, (0.250 – 0.990), and low (0.000 – 0.249). In this study, the relatively high genetic differentia- tion and intermediate level of gene flow ( Nm = 0.962) detected strongly indicate that genetic drift has greatly affected the genetic composition of individual populations.
The lower gene flow among populations could be attributed to geographical, social or cultural isolation/barrier inbreeding mode and limited use of ginseng seeds purchased from one location for cultivation in another place. Inbreeding mode usually reduces gene exchange (gene flow) both between different individuals and populations, leading to significant differentiation between populations (Slatkin, 1987).
Information on current levels of genetic diversity of germplasm at gene bank is essential for designing appropriate strategies for future conservation. According to the results of the present study, the high genetic differentiation among the populations suggests that all the populations should be well represented by more samples ex situ . Furthermore, the high genetic diversity within some populations (Jian, Fusong and Korea) indicate that the most effective strategy for
Table 5.
Nei’s unbiased measures of genetic identity and genetic distance.
Pop Jian Fusong Korea
Jian *** 0.9692 0.9474
Fusong 0.0313 *** 0.9563
Korea 0.0541 0.0447 ***
Nei’s genetic identity (above diagonal) and genetic distance (below diagonal).
Table 4.