ISSN 0367-6315 (Print) / ISSN 2288-2162 (Online) Korean J. Soil Sci. Fert. 46(6), 575-578 (2013) http://dx.doi.org/10.7745/KJSSF.2013.46.6.575
Assessment of Methane (CH 4 ) Emissions from Rice Paddy and Crop Residues Burning in 2011 with the IPCC Guideline Methodology
Eun Jung Choi, Jong Sik Lee*, Hyun Cheol Jeong, Gun Yeob Kim, and Kyu Ho So National Academy of Agricultural Science, RDA, Suwon, 441-707, Korea
(Received: November 13 2013, Accepted: November 28 2013)
Rice cultivation in the paddy field and the burning of crop residues have been identified as the important sources of methane emission in agricultural sector. This study aimed at assessment of the methane emission from croplands in the year of 2011 with the IPCC guideline methodology. Methane from rice cultivation was emitted 6,813 CO
2-eq Gg in 2011. According to the water management, methane emission amounts by continuously flooded and intermittently flooded were 1,499 and 5,314 CO
2-eq Gg, respectively. Methane emission by crop residues burning was highest in red pepper and followed by rice straw, pulses and barely in 2011. Methane emission by field burning was very little compared with rice cultivation.
Key words: Methane (CH
4), Crop residues, Rice paddy, Field burning
CH
4emission amounts by continuously flooded and intermittently flooded in the rice paddy field.
Year Water management
Total Continuously flooded Intermittently flooded
--- Gg CO
2-eq ---
2009 1,676 5,451 7,127
2010 1,438 5,359 6,797
2011 1,385 5,130 6,515
Mean (2011) 1,499 5,314 6,813
Short communication
1)
*Corresponding author : Phone: +82312900242, Fax: +82312900206, E-mail: [email protected]
§
Acknowledgement: This study was carried out with the cooperative research program (PJ0089862013), Rural Development Administration,
Republic of Korea.
Assessment of Methane (CH
4) Emissions from Rice Paddy and Crop Residues Burning in 2011 with the IPCC Guideline Methodology
576
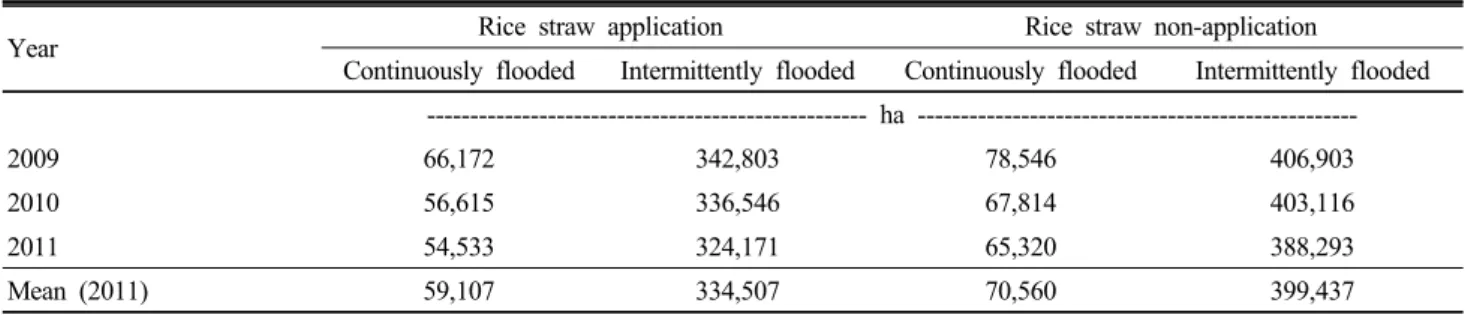
Table 1. The cultivation area based on water management and rice straw application method in the rice paddy.
Year Rice straw application Rice straw non-application
Continuously flooded Intermittently flooded Continuously flooded Intermittently flooded --- ha ---
2009 66,172 342,803 78,546 406,903
2010 56,615 336,546 67,814 403,116
2011 54,533 324,171 65,320 388,293
Mean (2011) 59,107 334,507 70,560 399,437
Table 2. Emission factor and Scaling factors for CH
4emission amounts.
EF
1)SFw
2)SFo
2)--- kg ha
-1day
-1---
2.37 0.6 2.5
1) EF: Emission factor
2) SF: Scaling factor, SFw: Scaling factors for water regime during the cultivation period, SFo: Scaling factors for both type and organic amendments applied
Introduction
주요 온실가스 중 하나인 메탄은 농업부문에서 벼 재배, 가축 장내 발효, 분뇨처리 및 작물잔사 소각 과정 등에서 발 생하며 (IPCC, 1996), 전세계 메탄배출량의 89%가 아시아 지역에서 배출된다 (Yan et al., 2003). 2010년 우리나라 농 업부문에서 발생한 메탄 배출량은 약 6.1 백만 톤 CO2-eq으 로 농업부문 메탄 배출량의 53%를 차지하고, 우리나라 메탄 총 배출량의 약 21.7%를 차지하는 양이다 (NIR, 2012). 벼 재배에 의한 메탄은 담수된 논에서 유기물이 혐기적으로 분 해되는 과정에서 발생하므로 (Naser et al., 2007) 메탄배 출의 주요 요인은 유기물 시용 유뮤와 작기 중 물 관리 방법 에 크게 좌우된다 (Khalil and Shearer, 2006). Braatz et al. (1991)은 벼 논에서의 메탄배출은 작기 전 물 관리 방법 과 벼 품종 및 토성에 따라서도 영향을 받는다고 하였다.
이번 연구에서는 2011년 우리나라 경종부문에서 발생하 는 메탄 배출량을 IPCC 가이드라인의 방법론과 국가 온실가 스 산정・보고・검증 지침에 따라 벼 재배 논에서의 배출과 작 물잔사 소각 과정에서의 배출로 구분하여 산정하였다. (IPCC 1996, GPG 2000, IPCC 2006). 우리나라의 경우 배출량 산 정을 시작한 1990년 이후 벼 재배 면적의 감소와 함께 메탄 배출량은 지속적으로 감소하고 있으며, 작물 잔사 소각에 의한 메탄 배출량은 농업부문 전체 배출량의 1% 미만으로 큰 영향을 미치지 않는 것으로 분석되었다 (Jeong, et al., 2010).
본 연구는 경종부문에서 발생하는 메탄 배출량을 산정하 고 국가 공식 배출량을 평가하고자 수행하였다.
Materials and Methods
1996 및 2006 IPCC 가이드라인의 배출량 산정 방법론에
따라 벼 재배 논에서의 메탄 배출량은 기본 계수 (Emission factor)에 보정계수 (Scaling factor)를 곱하고 여기에 벼 재 배 면적과 재배일수를 곱하여 산정하였다.
활동자료 (Activity data)
메탄 배출량 산정을 위한 벼 재배면적은 농림축산식품부 농림통계연보 (MIFAFF, 2012) 의 통계자료를 이용하였다. 벼 작기 중 물 관리 방법 및 유 기물 시용 유무에 대한 통계자료는 2011년부터 통계청에서 공식 조사가 이루어졌다. 따라서 통계 조사 이전의 활동자 료는 국가 인벤토리 산정 전문가 보고자표에 근거하였고, 2010년과 2011년의 경우는 통계청 조사 자료를 적용하였다.작기 중 물 관리 방법인 상시담수와 간단관개 비율은 14.4 : 85.6을 적용하였고, 유기물 시용과 무시용 비율은 45.5 : 54.5를 적용하였다 (Table 1). 벼 재배일수는 농업기술연구 소 시험연구사업보고서 (1992∼1997)를 활용하여 우리나라 에서 재배되는 벼 품종별 재배일수를 재배면적으로 가중 평 균하여 138일로 하였다.
농경지 토양에서 작물잔사 소각에 따른 메탄 배출량은 볏짚, 맥류, 밀, 두류, 고추, 마늘, 참깨, 양파 등 8개 작물 대상으로 하였고, 작물별 생산량은 농림축산식품부 농림통 계연보 (MIFAFF, 2012)의 통계자료를 이용하였다. 작물별 잔사 소각률은 2011년 통계청 조사 자료와 전문가 판단을 이용하였고 잔사/곡식 비율은 GPG 2000의 기본값과 국립 농업과학원의 ‘기후변화협약 관련 농업분야 탄소 흡수원 연 구’ 보고서 자료를 활용하였다.
배출계수 (Emission factor) 및 보정계수 (Scaling factor)
Table 2는 메탄 배출량 산정 시 적용한 배출계수 및 보정계 수를 나타낸다. 메탄 기본 배출계수 (EF)는 Park and Yun (2002) 의 연구 결과인 2.37 kg ha-1 day-1를 적용하였다. 물 관리 방Eun Jung Choi, Jong Sik Lee, Hyun Cheol Jeong, Gun Yeob Kim, and Kyu Ho So 577
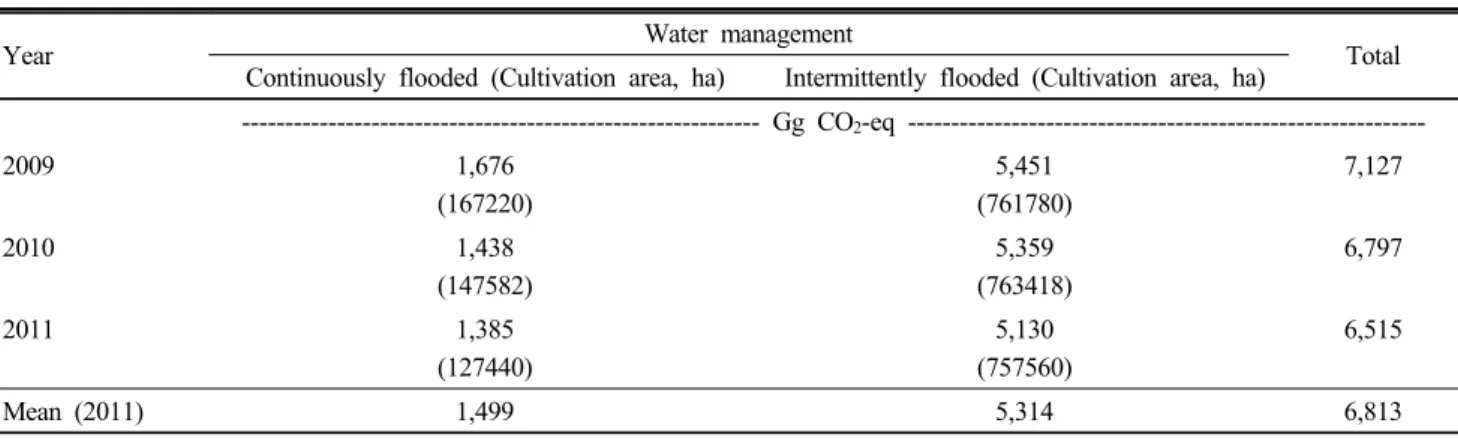
Table 3. CH
4emission amounts by continuously flooded and intermittently flooded in the rice paddy field.
Year Water management
Total Continuously flooded (Cultivation area, ha) Intermittently flooded (Cultivation area, ha)
--- Gg CO
2-eq ---
2009 1,676
(167220)
5,451 (761780)
7,127
2010 1,438
(147582)
5,359 (763418)
6,797
2011 1,385
(127440)
5,130 (757560)
6,515
Mean (2011) 1,499 5,314 6,813
Table 4. The CH
4emission amounts by field burning of crop residues.
Year Crop residues
Total
Rice Barely Wheat Pulses Red pepper Galic Sesame Onion
--- tonne CO
2-eq ---
2009 162 72 27 117 1,253 50 36 3 7,127
2010 141 39 55 90 1,110 38 35 3 6,797
2011 139 36 62 107 938 42 26 3 6,515
Mean (2011) 147 49 48 105 1,100 43 32 3 6,813
법에 따른 보정계수 (SFw)는 2006 IPCC 가이드라인의 기본 계수를 적용하였고, 유기물 시용량에 따른 보정계수 (SFo) 는 GPG 2000에 우리나라 유기물 표준 시비량인 6톤 ha-1을 기준으로 적용하였다.
메탄 배출량 계산
벼 재배 논에서의 메탄 배출량은 1996 IPCC 가이드라인, GPG 2000 및 2006 IPCC 가이드라 인의 방법론 및 국가 온실가스 산정・보고・검증 지침에 준하 여 산정하였다. 메탄 배출량은 식 1과 같이 기본 배출계수 에 각각의 보정계수를 곱하여 일 배출량을 산출하고, 여기 에 우리나라 논 재배면적, 재배일수 등을 곱하여 계산하였 다 (식 2). 2011년 메탄 배출량은 전전년도 (2009년), 전년 도 (2010년), 당해연도 (2011년)의 3년 값을 평균하였다.EF1= EFc x SFw x SFo (1) EFc : 기본배출계수
SFw : 벼 재배기간 중 물관리 계수 SFo : 유기물 시용 계수
CH4Rice = A x t x EF1 x 10-6 (Gg CH4 yr-1) (2) A : 재배면적 (ha · yr-1),t : 재배일수 (days)
작물잔사 소각에 의한 메탄 배출량은 작물별 생산량에 잔사/곡식 비율, 건물률, 소각률 (소각비율 조사 값 적용), 산화율 (작물별 산화되는 부분 값 적용), 탄소 함량, 가스
배출률 (CH4과 N2O의 가스 배출률), 메탄전환계수를 곱하 여 산정하였다. 벼 재배 메탄 배출량과 같이 2011년 잔사소 각에 의한 메탄 배출량은 전전년도 (2009년), 전년도 (2010 년), 당해연도 (2011년)의 3년 값을 평균하였다. 메탄 배출량 을 CO2로 환산하기 위한 지구온난화지수 (Global Warming Potential)는 21을 적용하였다.
Results and Discussion
벼 재배 논에서의 메탄 배출량
Table 3은 상시담수 및 간단관개에 따른 우리나라 벼 논에서의 메탄 배출량을 나 타낸다. 2009년부터 메탄 배출량은 벼 재배면적 감소에 따라 지속적으로 감소하여, 2011년 (3년 평균) 메탄 배출량은 6,813 Gg CO2-eq이었다. 물관리 방법에 따른 메탄 배출량 은 상시담수 논에서 1,499 Gg CO2-eq, 간단관개에서 5,314 Gg CO2-eq이었다. 간단관개의 재배 면적이 상시담수 재배면적 보다 6배 많았음에도 불구하고 배출량은 약 3.5배 높았는 데, 이는 물 관리 보정계수 0.6을 적용하였기 때문인 것으 로 분석되었다. 2011년 벼 재배에 의한 메탄 배출은 가축분 뇨 처리나 장내 발효에 의한 배출량보다 높은 것으로 농업부 문에서 주요 배출원 중 하나인 것을 알 수 있었다 (NIR, 2012).2011년 우리나라 농경지에서 수확한 작물 생산량은 벼가 가장 높았고 (2011년 3년 평균 4,600,158톤), 양파가 그 뒤 를 이었다 (2011년 3년 평균 1,304,856톤). 고추는 벼 생산 량보다 약 13배나 적었지만 (2011년 3년 평균 346,683톤),
Assessment of Methane (CH
4) Emissions from Rice Paddy and Crop Residues Burning in 2011 with the IPCC Guideline Methodology
578
관목인 고추대의 특성상 가장 높은 소각률 (0.631)을 나타내 었다.
작물별 메탄 배출량을 보면 고추 작물잔사 소각 시 가장 높은 배출량을 나타냈으며, 그 다음이 볏짚, 두류의 작물잔 사 소각 시 배출량이 많은 것으로 분석되었다. 고추 잔사 소 각 시 배출량이 높은 이유는 고추 생산량은 벼보다 훨씬 낮 았지만 잔사/곡실 비율이 다른 작물에 비해 높고, 작물 잔 사를 농경지에서 소각하는 비율도 63%로 다른 작물 (벼는 1%, 양파는 5%)에 비해 높은 것으로 분석되었다. 양파 작물 소각 시 가장 적은 메탄 배출량을 보였으며, 이는 건물률과 소각률이 다른 작물에 비해 상대적으로 낮았기 때문인 것으 로 분석되었다. 작물 잔사 소각에 의한 메탄 총 배출량은 경 종부문 메탄 배출량의 약 0.6%로 그 양은 미미하여 농업부 문 전체 배출량에는 큰 영향을 미치지 않았다.
Conclusions
1996 IPCC 가이드라인, GPG 2000 및 2006 IPCC 가이드 라인의 메탄 배출량 산정방법론에 준하여 우리나라 벼 논 및 작물잔사 소각 과정에서의 온실가스 배출량을 국가 단위에 서 산정하였다. 벼 논에서의 물 관리 방법 및 볏짚 시용 유・
무에 따른 메탄 배출량을 산정한 결과 총 배출량은 6,813 Gg CO2-eq으로 농업부문별 온실가스 배출량으로는 가장 많은 배출을 차지하였다. 작물잔사 소각에 의한 메탄 배출 은 고추 잔사 소각 시 가장 많은 배출을 보였으나 벼 재배에 의한 메탄배출에 비해 그 양은 미미하여 농업부문 전체 배 출량에는 큰 영향을 미치지 않았다.
국가 간 기후변화 협상에 대응하고 2020년 BAU (Business As Usual, 배출전망치) 대비 온실가스 감축 달성을 위해서 는 무엇보다도 신뢰도 높은 배출량 산정이 수반되어야 한 다. 따라서, 이번 결과를 통해 산정된 경종부문 메탄 배출량 은 국제 기준에 부합된 신뢰도 높은 산정량으로 국가 공식 인벤토리 승인 절차를 거쳐 2011년 경종부문 국가 공식 배 출량으로 승인・공표 될 예정이다.
References
Braatz, B. V. and K. B. Hogan. 1991. Sustainable rice productivity and methane reduction research plan. U.S.
Environmental Protection Agency, Officer of Air and Radiation.
Washington D.C. 61p.
IPCC. 1996. IPCC guidelines for national greenhouse gas inventories.
IPCC. 2000. Good Practice Guidance and uncertainty management in national greenhouse gas inventories.
IPCC. 2006. IPCC guidelines for national greenhouse gas inventories.
Jeong, H.C., G.Y. Kim, K.H. So, K.M. Shim, S.B. Lee and D.B.
Lee. 2010. Assessment on Greenhouse gas (CH4) Emissions in Korea Cropland sector from 1990 to 2008. Korean J. Soil Sci.
Fert. 43(6):911-916
Khalil M.A.K. and M.J. Shearer. 2006. Decreasing emissions of methane from rice agriculture. International Congress Series.
1293:33-41.
MIFAFF. 2012. Food, agricultural, forestry and fisheries statistical yearbook. Ministry for Food, Agriculture, Forestry and Fisheries. Seoul Korea.
Naser, H.M., Nagata, O., Tamura, S. and Hatano R. 2007.
Methane emissions from five paddy fields with different amounts of rice straw application in central Hokkaido, JAPAN. 53:95-101.
NIR. 2012. National Greenhouse Gas Inventory Report of Korea.
Greenhouse Gas Inventory and Research Center of Korea.
Park M.E. and S.H. Yun. 2002. Scientific basis for establishing country CH4 emission estimates for rice-based agriculture: A Korea (south) case study. Nutrient Cycling in Agroecosystems.
64:11-17.
Yan X. T. Ohara and H. Akimoto. 2003. Development of region-specific emission factors and estimation of methane from rice fields in the east, southeast and south asian countries.
Global Change Biology. 9:237-254.