A Study on Determinants of Chinese OFDI to Korea
Yun-hai Dai
Professor, Department Of International Trade, Namseoul University
중국 대 한국OFDI 결정요인의 실증분석
남서울대학교 글로벌무역학과 교수 대운해
Abstract OFDI is one of the key issues around the world in the development of economics, in 2013, Chinese President Xi JinPing proposed "One Belt One Road" initiative on conference of Asia-Africa international conference with its core policy as (Outward Foreign Direct Investment).With the steady development of China's "One Belt One Road", further advancement of Korea-China FTA, and rapid expansion of close economic relations between two countries, China is bound to increase OFDI to Korea. The paper empirically studied its determinants of Chinese OFDI to Korea, with PANELDATA data introduced combining time series with cross-section, result shows GRDP, HV, YNTL, FWYS, XFZS are all verified as determinants of Chinese OFDI to Korea, while, several suggestions are proposed for Korea to attract Chinese OFDI.
Key Words : OFDI, Korea, China, Determinants, Empirical analysis, One Belt One Road
요 약 OFDI는 전 세계 국가의 경제 발전에 있어 주요한 이슈 중의 하나이다. 2013년 중국 국가주석 시진핑은 아시아 -아프리카 국제회의를 참석하여 일대일로를 제안하였다. 그중에서 OFDI (Outward Foreign Direct Investment)는 일대일로의 핵심적 정책이다. 중국 일대일로 정책의 발전, 한중FTA의 심화 및 양국 긴밀한 경제관계의 급속한 발전에 따라서 중국은 한국에 대한 OFDI를 확대해야 할것이다. 본 연구에서는 중국이 한국에 대한 OFDI를 바탕으로 시계열 과 횡단면 두 가지 차원을 결합한PANEL의 데이터를 사용하여 OFDI의 결정적 요인을 확인하고자 한다. 실증분석 결 과GRDP, HV, YNTL, FWYS, XFZS 등은 중국이 한국에 대한 OFDI의 결정적 요인으로 입증하였다. 또한 실증분석 결과를 바탕으로 한국이 중국의 OFDI를 유치에 대한 시사점을 제공하였다.
주제어 : OFDI, 한국, 중국, 결정요인, 실증분석, 일대일로
2019-RE00760,Funding for this paper was provided by Namseoul University year 2019.
*Corresponding Author : Yun-hai Dai([email protected]) Received February 20, 2020
Accepted May 20, 2020 Revised April 23, 2020
Published May 28, 2020
1. Introduction
Since reform and opening up in 1978, China has achieved rapid development in economy, its significant result of foreign investment attraction makes it always gathering attention of the world.
During that period, although China also invest abroad, but they cooperation with main policy is to attract and utilize foreign investment for almost 20 years since 1978. Therefore, impact on economic growth and determinants of China's attraction of foreign investment have become
popular research fields, where, there are a large number of scholars paid attention to study of Korean direct investment in China(S. J. Kang &
H. S. Lee,2007;J. S. Ko,2013;S. W. Kim, 2012;
Y. H. Dai, 2016)[1-4]. It was not until 2001 that China's 15th Five-Year Plan put forward with the outbound investment strategy to start its outbound foreign investment. And for the next 10 years China has continued to maintain outbound foreign investment, especially in 2013 the proposition of "One Belt One Road" makes foreign investment become its core policy, with steady progressing for more than 6 years, China has gradually increased the speed and intensity of outbound foreign investment. Since the establishment of diplomatic relations between China and Korea in 1992, the relations especially economics relations between two countries have developed rapidly, there are economic complementary in many aspects between Korea and China, therefore, research on determinants of Chinese OFDI to Korea in this context has great practical significance for strengthening economic cooperation between two countries.
2. literature review
J. J. Li, J. Y. Qiu & B. He(2019) studied the impact of institutional distance and cultural distance on China's foreign direct investment based on 2003-2017 data of China's foreign direct investment to 94 countries around the world[5]. J. X. Zhu (2019) expounded the development opportunities of China's foreign direct investment against countries along route of "One Belt One Road" initiative, summarized its current status and characteristics, analyzed its faced dilemma and risks, and found out differences existing interest claims and cognitive concepts in those countries, imbalance spatial distribution of investment, unstable environment of regional investment, and intensification of
competitive caused by strategic of major powers, finally, strategic choice for China's outbound foreign direct investment[6]. J. S. Ko, Y. Wang &
X. Li. (2018) pointed out trend and restrictions of mutual direct investment among China, Japan and Korea showed purpose of mutual trade and investment was mutual benefit and win-win, and inevitably, the promotional process will encounter various restrictions. Analysis of foreign direct investment regulation restriction index of China, Japan and Korea shows China has the highest restriction level of foreign direct investment, Korea is in middle and Japan is lowest. There are certain differences exist in China, Japan and Korea, and these differences are important factors for trade cooperation and the construction of free trade area[7]. By analyzed trend and characteristics, Y. M. Shao &
X. G. Yang (2017) put forward that China's foreign direct investment has now entered a new development platform in recent years[8].
The paper empirically studied its determinants of Chinese OFDI to Korea, with PANELDATA[9-10]( B. H. Altagi, 2005 and 2008 ) data introduced combining time series with cross-section, result shows GDP per capita(GRDP), foreign exchange rate(HV), internet utilization rate (YNTL), service industry count (FWYS), consumption index per capita (XFZS) are all verified as determinants of Chinese OFDI to Korea, while, several suggestions are proposed for Korea to attract Chinese OFDI.
3. Analytical model
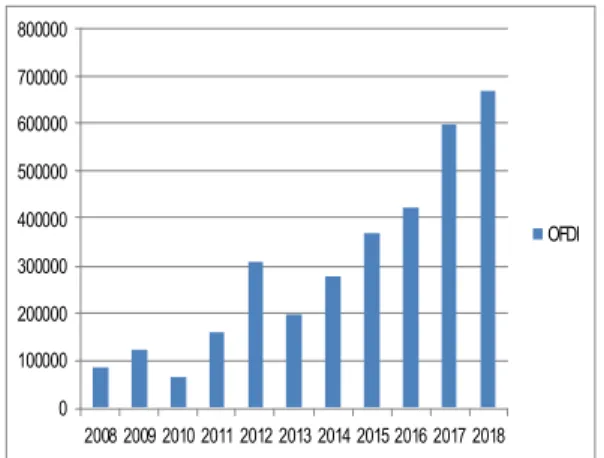
Since the establishment of China's foreign investment statistics system in 2008, Chinese OFDI to Korea has generally increased, especially after proposing "One Belt One Road" in 2013. In view of the close economic relations between China and Korea, and with China's growing GDP, China is bound to increase direct investment in
0 100000 200000 300000 400000 500000 600000 700000 800000
2008 2009 2010 2011 2012 2013 2014 2015 2016 2017 2018 OFDI
Fig. 1. China's investment to Korea
(Unit: 10, 000 USD, Data source: China National Bureau of Statistics)
Korea on benefit of geographical advantage.
Based on formor research, Based on former research, (Y. H. Dai, 2016) factors affecting target countries for foreign investment attraction are mainly market factors such as market scale and infrastructure; political factors such as tariffs, import quotas ans investment preferential policies; economic factors such as interest rates of invested capital, growth rate of personal income of GDP, changes in employment status and international fiscal deficits; cultural factors such as common language, religion, taxation;
cost factors such as raw materials, labor prices;
location attractiveness such as total regional imports and exports; industrial cluster degree such as number of regional enterprises;
innovation ability such as population proportion of college talents, patents count, intensity of research institutes[11]. So this paper uses Korean GDP per capita (GRDP), trade dependence (MYYD), basic infrastructure transaction road mileage, foreign exchange rate (HV), knowledge and technique patents count (ZL), infrastructure transport road miles (DL), service industry count (FWYS), internet utilization rate (YNTL), consumption index per capita (XFZS) as explanatory variable of determinants of China's OFDI to Korea, data used in this paper is original from historical data of Korean statistical office,
and interpreted variable OFDI uses data from national bureau of statistics of China (2008-2018), taking into account effects of economic lag, this paper uses T-1 year.
Research empirical analysis methods for determinants of OFDI mainly include Poisson Regression methodology used by B. S. Han & M.
K. Seo (2005) [12], logit empirical analysis method adopted by S. J. Kang & H. S. Lee (2007)[1], OLS regression analysis from S. W. Kim (2012) [3], TOBIT regression analysis methodology proposed by H. G. Kang (2014) [13] and SAR empirical analysis method adopted by Y. G. Yan (2014) [14], GMHD empirical analysis from Y. H. Dai (2016) [15], and GLS empirical analysis method introduced by Z. X. Jin (2019) [16]. This paper will constitute a panel data structure with time series as longitudinal section and side by side factors as cross section, with data original from 8 factors with time span as 11 years that include Korean GDP per capita (GRDP), trade dependence (MYYD), basic infrastructure transaction road mileage, foreign exchange rate (HV), knowledge and technique patents count (ZL), infrastructure transport road miles (DL), service industry count (FWYS), internet utilization rate (YNTL), consumption index per capita (XFZS), where, panel data is a kind of data type that combines section data with time series data, it has two dimensions of time series and section, when data is arranged in two dimensions, it could be arranged on a plane, different from one dimension arranged in a line, it can control OLS bias of unobservable economic variables and provide more information, more changes, more degrees of freedom and higher estimation efficiency(M. Abellano, 2003 ; G. Christian , P. B.
Phillips & J. Yu, 2007) [17, 18].
Model is built as follows:
LnFDI=β0it+β1lnGDPit+β2lnWAGEit+β 3lnSBIit+β4lnTIECit+β5lnKTLit+β6lnCLit+ε it,(i=1,2,…N,t=1,2,…,T)
Where, β0 is a constant, β1、β2…βn are partial regression coefficients of dependent variable corresponding to each independent variable and represent ratio of changing of one dependent variable caused by one independent variable under the condition that all other independent variables are unchanged. ε is random error.
4. Empirical analysis
Preliminary analysis of empirical data is performed by SPSS18.0, technical statistics of statistical data selected in this paper from 2008 to 2018 are as follows Table 1.
Variablles Minimum Maximum Mean Std. Deviation
OFDI 63725 671011 297577.09 202978.63
HV 91.31081 106.64536 98.809626 3.8293303
DL 104236 110714 106874.27 2128.775
GRDP 2254 3682 2875.73 434.107
MYYD 88.789840 131.86795 101.26392 12.761791
ZL 163523 213694 193115.18 19099.182
YNTL 80.1 91.4 84.555 4.1551
FWYS 2349747 2921816 2630802.3 201219.52
XFZS 85.18 104.58 96.1355 6.35165
Table 1. Descriptive Statistics(2008-2018)
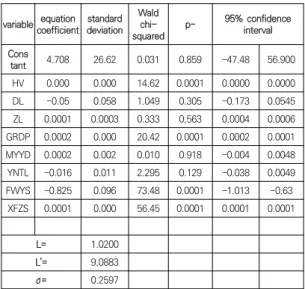
DPS7.05 is adopted to perform regression analysis. input explanatory variables are Korean GDP per capita (GRDP), trade dependence (MYYD), basic infrastructure transaction road mileage, foreign exchange rate (HV), knowledge and technique patents count (ZL), infrastructure transport road miles (DL), service industry count (FWYS), internet utilization rate (YNTL), consumption index per capita (XFZS); interpreted variable is OFDI, empirical results obtained is shown in Table 2.
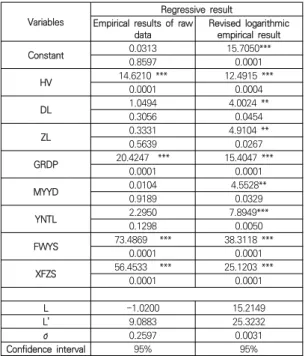
Make logarithm of explanatory and interpreted variables separately and perform TOBIT regression analysis then, logarithmic empirical results are shown in Table 3, and Table 4 is final empirical result summarized from Table 2 and 3.
variable equation coefficient standard deviation
Wald
squared chi- p- 95% confidence interval Constant 4.708 26.62 0.031 0.859 -47.48 56.900
HV 0.000 0.000 14.62 0.0001 0.0000 0.0000 DL -0.05 0.058 1.049 0.305 -0.173 0.0545 ZL 0.0001 0.0003 0.333 0.563 0.0004 0.0006 GRDP 0.0002 0.000 20.42 0.0001 0.0002 0.0001 MYYD 0.0002 0.002 0.010 0.918 -0.004 0.0048 YNTL -0.016 0.011 2.295 0.129 -0.038 0.0049 FWYS -0.825 0.096 73.48 0.0001 -1.013 -0.63 XFZS 0.0001 0.000 56.45 0.0001 0.0001 0.0001
L= 1.0200
L'= 9.0883
σ= 0.2597
Table 2. Empirical results from raw data
ablevari equation coefficient standard
deviation Wald
squared chi- p- 95% confidence interval Constant -36.2 9.158 15.70 0.0001 -54.2480 -18.3449
HV -0.04 0.013 12.49 0.0004 -0.07 0.021 DL -0.16 0.083 4.002 0.0454 -0.33 0.003 ZL 0.885 0.399 4.910 0.0267 0.102 1.668 GRDP -0.46 0.119 15.40 0.0001 -0.70 -0.23 MYYD -0.34 0.161 4.552 0.0329 -0.66 -0.02
YNTL -0.05 0.018 7.894 0.0050 -0.08 0.015 FWYS -1.25 0.203 38.31 0.0001 -1.65 0.860 XFZS 3.127 0.624 25.12 0.0001 1.904 4.351
L= 15.21
L'= 25.32
σ= 0.003
Table 3. Revised logarithmic empirical results
Empirical result shows from 2008 to 2018, use 1% significance level as inspection standard, explanatory variable foreign exchange rate (HV), GDP per capita (GRDP), service industry count (FWYS), consumption index per capita (XFZS) passed inspection, and knowledge and technique patents count (ZL), infrastructure transport road miles (DL), trade dependence (MYYD), internet utilization rate (YNTL) failed to pass inspection.
After eliminating heteroscedasticity by logarithm, result shows foreign exchange rate (HV), GDP per
capita (GRDP), internet utilization rate (YNTL), service industry count (FWYS), consumption index per capita (XFZS) passed inspection under 1% significance level and knowledge and technique patents count (ZL), infrastructure transport road miles (DL), trade dependence (MYYD) passed under 5% significance level.
Variables Regressive result
Empirical results of raw
data Revised logarithmic empirical result
Constant 0.0313 15.7050***
0.8597 0.0001
HV 14.6210 *** 12.4915 ***
0.0001 0.0004
DL 1.0494 4.0024 **
0.3056 0.0454
ZL 0.3331 4.9104 **
0.5639 0.0267
GRDP 20.4247 *** 15.4047 ***
0.0001 0.0001
MYYD 0.0104 4.5528**
0.9189 0.0329
YNTL 2.2950 7.8949***
0.1298 0.0050
FWYS 73.4869 *** 38.3118 ***
0.0001 0.0001
XFZS 56.4533 *** 25.1203 ***
0.0001 0.0001
L -1.0200 15.2149
L' 9.0883 25.3232
σ 0.2597 0.0031
Confidence interval 95% 95%
where: **P<0.05 ***P<0.01
Table 4. Final empirical result (2008-2018)
5. Conclusion
GDP per capita and consumption level can represent comprehensive level of economic development and consumption potential of a region, and are one of effective indicators to measure investment locations. Basic infrastructure represents construction level of a region, developed infrastructure means convenient circulation and low transportation costs, it has always been key points for consideration of investment. Trade dependence represents level of foreign trade and market openness of a region, and can directly reflect the attractiveness of
foreign investment. The greater proportion of foreign trade the better reflection of favorable factors for foreign investment such as good environment, service policy and excellent location, and therefore being indicators of investment choice.
Level of service industry, count of knowledge and technical patents, utilization rate of Internet can reflect the level of social development, comprehensive innovation capabilities, convenient degree and efficiency of communications, and service level of government and other public sectors. With the development of knowledge economy, corporations are paying more and more attention to innovation and technique research, thence a lot of scientific and technological talents are required; high public service level and modern communication efficiency can enable enterprises to enter quickly, operate effectively and protect intellectual property rights, so these factors are important indicators for investment measurement(Y. H. Dai, 2016) [4]. Therefore, the empirical results obtained by this paper validate current existing theoretical knowledge and strengthen the understanding of determinants of China's OFDI to Korea.
In consideration of above empirical analysis and results, with the progressive development of China's economy, advancement of "One Belt One Road" and official implementation of China-Korea FTA, China is bound to increase OFDI to Korea, in order to attract more China's OFDI and Korea is suggested to do as following:
Firstly, participate in China's "One Belt One Road" initiative actively, promote construction of Asian Infrastructure Investment Bank, deeply strengthen development of Korea-China FTA, continue to maintain close economic relations with China and maintain trade and cooperation between two countries.
Secondly, continue to increase the .construction of domestic infrastructure, especially the level of modern communication means such as construction level of 5G, and keep improving
developing level of domestic service, economy and society.
Thirdly, increase emphasis on knowledge and technological innovation, focus on intellectual property protection, strengthen currency swap between two countries, and make more effort to reduce investment costs due to the usage of third-party currencies to better attracting China's direct investment.
The empirical research in this paper supports the academic theoretical hypothesis that modern technological communication technology is also one of the determinants of OFDI, enriching the theoretical research literatures on determinants of OFDI, which is the main contribution of this paper to relevant academic theories. Empirical analysis on determinants of China's OFDI to Korea only selected part of factors by this paper, occurrence of economic phenomena is always the result of various factors, and studies in academic perspectives often differ from practice.
Conclusion obtained is only related to results of empirical analysis performed by this paper.
Considering that empirical analysis asks high requirement for data number and accuracy, due to statistical errors in collection process, data may have certain deviations based on different statistical status, statistical method and different operators. The panel data used for regression by this paper is limited to its number, that is, more thorough research is needed in the future.
REFERENCES
[1] S. J. Kang & H. S. Lee. (2007). The determinants of location choice of South Korean FDI in China. Japan and the World Economy, 19(4), 441-460.
DOI:10.1016/j.japwor.2006.06.004
[2] J. S. Ko. (2013). A Study on Changing Trend of Korean company's FDI in China. The Comparative Economic Review, 20(2), 1-19.
UCI : G704-000828.2013.20.2.002
[3] S. W. Kim. (2012). Impact of Korean’s FDI on the Regional Economic Development in China: A Panel
Data Study. CS, 43, 359-386.
UCI : G704-001822.2012..43.010
[4] Y. H. Dai. (2016). Empirical Analysis of Knowledge Innovation and Technology Study On Korea’s FDI in China. Korean Association For Chinese Studies, 54, 325-339.
DOI: 10.14378/KACS.2016.54.54.17
[5] J. J Li, J. Y. Qiu & B. He. (2019). Cultural Distance, Institutional Distance and Outward Foreign Direct Investment - An Empirical Study Based on Chinaʼs OFDI to Countries along the “Belt and Road”. Wuhan University Journal(Philosophy & Social Science), 01, 120-134.
DOI:10.14086/j.cnki.wujss.2020.01.010
[6] J. X. Zhu. (2019). China's OFDI Under the Belt and Road" Initiative. Journal of Shenyang University(Social Science), 21(06), 691-695+715.
DOI:10.16103/j.cnki.21-1582/c.2019.06.038
[7] J. S. Ko, Y. Wang & X. Li. (2018). A Comparative Study on the Outward Foreign Direct Investment Trend and Regulation Level among China. Japan and Korea,
Japan and Korea. Economic Review, 06, 105-115.
DOI:10.16528/j.cnki.22-1054/f.201806105
[8] Y. M. Shao & X. G. Yang. (2017). China's Foreign Outward Direct Investment in Recent Years:
Characteristics and Policy Suggestions. Science &
Technology for Development, 13(11), 888-896.
[9] B. H. Altagi. (2005). Econometric Analysis of Panel Data.2nd ed. New York:John Wiley and Sons Press.
[10] B. H. Altagi. (2008). Econometrics.4th ed.Berlin Heidelberg: s—nger-verlag.
[11] Y. H. Dai. (2017). An Empirical Analysis on the Inducement Efficiency of FDI in China. The Korean Association of Northeast Asia Studies, 22(2), 285-298.
UCI : G704-001822.2016..54.007
[12] B. S. Han & M. K. Seo. (2005). An Empirical Study on the Determinants of Knowledge Creation for MNCs in Korea. Journal of Business Research, 20(3), 133-159.
DOI: 10.21739/IBR.2006.06.10.1.69
[13] H. G. Kang. (2014). Determinants of Korean FDI in China using the Spatial Effects. International Commerce and Information Review, 16(4), 385-408.
DOI:10.15798/kaici.16.4.201409.375
[14] Y. G. Yan. (2014). Location Choice of FDI: Market Potential, Geographic Agglomeration and the Same Country of Origin. Finance & Trade Economics, 09, 103-113.
DOI : 10.19795/j.cnki.cn11-1166/f.2014.09.012 [15] Y. H. Dai. (2016). FDI Introduce Efficiency Evaluation
Based On GMDH and DEA in China : A Study about FDI efficiency between Korea and China’s majoy cities. The Journal of Northeast Asia Research (NEA), 31(2), 127-143.
DOI : 10.18013/jnar.2016.31.2.006
[16] Z. X. Jin. (2019). Impact Factors of Korea Manufacturing Industry FDI Into China . Beijing university of technology Master thesis.
[17] M. Abellano.(2003). Panel Data Econometrics.
Oxford:Oxford.University Press.
[18] G. Christian, P. B. Phillips & J. Yu. (2007). Indirect inference for dynamic panel models. Journal of Econometrics, 157(1), 68-77.
DOI:10.1016/j.jeconom.2009.10.024
대 운 해(Yun-hai Dai) [정회원]
․ Aug, 2011 : Master of Economics and Trade, Paichai University of Korea
․ Jun, 2014 : Ph.D. of Economics and Trade, Paichai University of Korea
․ March, 2015 ∼ Present : Foreign Professor, department of International Trade, South Seoul University
․ Area of Interest : International economics and commerce trade, International investment and economic efficiency, Innovation and development model of regional economy
․ E-Mail : [email protected]