2017, 28
(5)
,1043–1053
초위성체 마커를 이용한 산양의 분자유전학적 고찰 †
ᄉ
ᅥ주희
1
·이윤석2
· 전광주3
· 공홍식4
1한경대학교 미래융합기술대학원 유전체정보전공·234한경대학교 유전정보연구소
ᄌ ᅥ
ᆸᄉ ᅮ 2017ᄂ ᅧ ᆫ 5ᄋ ᅯ ᆯ 10ᄋ ᅵ ᆯ, ᄉ ᅮᄌ ᅥ ᆼ 2017ᄂ ᅧ ᆫ 9ᄋ ᅯ ᆯ 6ᄋ ᅵ ᆯ, ᄀ ᅦᄌ ᅢ ᄒ ᅪ ᆨᄌ ᅥ ᆼ 2017ᄂ ᅧ ᆫ 9ᄋ ᅯ ᆯ 7ᄋ ᅵ ᆯ
요 약
ᄇ
ᅩ ᆫ ᄋ ᅧ ᆫᄀ ᅮᄂ ᅳ ᆫ ᄉ ᅡ ᆫᄋ ᅣ ᆼ 7 ᄑ ᅮ ᆷᄌ ᅩ ᆼᄋ ᅳ ᆯ ᄃ ᅢᄉ ᅡ ᆼᄋ ᅳᄅ ᅩ (Saanen (88), Laoshan (67), Toggenburg (32), Alpine (12), Anglonubian (9), Jamnapari (7), Black Bengal (4)) 13ᄌ ᅩ ᆼ ᄋ ᅴ ᄎ ᅩᄋ ᅱᄉ ᅥ ᆼᄎ ᅦ ᄆ ᅡᄏ ᅥ (microsatellite marker)ᄅ ᅳ ᆯ ᄒ ᅪ ᆯᄋ ᅭ ᆼ ᄒ ᅡᄋ ᅧ ᄋ ᅲᄌ ᅥ ᆫᄌ ᅥ ᆨ ᄃ ᅡᄒ ᅧ ᆼᄉ ᅥ ᆼ ᄇ ᅮ ᆫᄉ ᅥ ᆨᄋ ᅳ ᆯ ᄉ ᅵ ᆯᄉ ᅵᄒ ᅡᄋ ᅧ ᆻᄃ ᅡ. ᄃ ᅢᄅ ᅵ ᆸᄋ ᅲᄌ ᅥ ᆫᄌ ᅡ ᄉ ᅮᄂ ᅳ ᆫ 4ᄀ ᅢ (INRA005) ᄇ ᅮᄐ ᅥ 18ᄀ ᅢ (SRCRSP23)ᄁ ᅡᄌ ᅵ ᄒ ᅪ ᆨ ᄋ ᅵ ᆫᄃ ᅬᄋ ᅥ ᆻᄋ ᅳᄆ ᅧ, ᄀ ᅪ ᆫᄎ ᅳ ᆨ ᄋ ᅵᄒ ᅧ ᆼᄌ ᅥ ᆸᄒ ᅡ ᆸᄋ ᅲ ᆯ (H
obs)ᄀ ᅪ ᄀ ᅵᄃ ᅢᄋ ᅵᄒ ᅧ ᆼᄌ ᅥ ᆸᄒ ᅡ ᆸᄋ ᅲ ᆯ (H
exp) ᄀ ᅳᄅ ᅵᄀ ᅩ ᄃ ᅡᄒ ᅧ ᆼᄉ ᅥ ᆼ ᄌ ᅥ
ᆼᄇ ᅩᄌ ᅵᄉ ᅮ (P IC) ᄀ ᅡ ᆹᄋ ᅳ ᆫ ᄀ ᅡ ᆨᄀ ᅡ ᆨ 0.482 ∼ 0.786, 0.476 ∼ 0.923 ᄀ ᅳᄅ ᅵᄀ ᅩ 0.392 ∼ 0.915ᄅ ᅩ ᄂ ᅡᄐ ᅡᄂ ᅡ ᆻᄃ ᅡ. ᄑ ᅮ ᆷᄌ ᅩ ᆼ ᄇ ᅧ
ᆯ ᄋ ᅲᄌ ᅥ ᆫᄌ ᅥ ᆨ ᄀ ᅥᄅ ᅵᄅ ᅳ ᆯ ᄒ ᅪ ᆨ ᄋ ᅵ ᆫᄒ ᅡᄀ ᅵ ᄋ ᅱᄒ ᅡᄋ ᅧ ᄉ ᅵ ᆯᄉ ᅵᄒ ᅡ ᆫ ᄌ ᅮᄉ ᅥ ᆼᄇ ᅮ ᆫᄇ ᅮ ᆫᄉ ᅥ ᆨ (PCoA) ᄀ ᅧ ᆯᄀ ᅪᄂ ᅳ ᆫ ᄋ ᅭᄋ ᅵ ᆫᄃ ᅢᄋ ᅳ ᆼᄇ ᅮ ᆫᄉ ᅥ ᆨ (FCA) ᄇ ᅮ ᆫᄉ ᅥ ᆨᄀ ᅪ ᄋ
ᅲᄉ ᅡᄒ ᅡ ᆫ ᄀ ᅧ ᆯᄀ ᅪᄅ ᅳ ᆯ ᄇ ᅩᄋ ᅧ ᆻᄋ ᅳᄆ ᅧ, ᄃ ᅩ ᆼᄋ ᅵ ᆯᄀ ᅢᄎ ᅦᄎ ᅮ ᆯᄒ ᅧ ᆫᄇ ᅵ ᆫᄃ ᅩᄂ ᅳ ᆫ 2.47 × 10
−15ᄋ ᅳᄅ ᅩ ᄒ ᅪ ᆨ ᄋ ᅵ ᆫᄃ ᅬᄋ ᅥ ᆻᄃ ᅡ. ᄄ ᅡᄅ ᅡᄉ ᅥ ᄇ ᅩ ᆫ ᄋ ᅧ ᆫᄀ ᅮ ᄀ ᅧ ᆯᄀ ᅪ ᄂ
ᅳ ᆫ ᄉ ᅡ ᆫᄋ ᅣ ᆼ ᄑ ᅮ ᆷᄌ ᅩ ᆼ ᄀ ᅢᄅ ᅣ ᆼ ᄆ ᅵ ᆾ ᄇ ᅩᄌ ᅩ ᆫ ᄋ ᅦ ᄋ ᅵ ᆻᄋ ᅥ ᄀ ᅵᄎ ᅩᄌ ᅡᄅ ᅭᄅ ᅩᄊ ᅥ ᄋ ᅲᄋ ᅭ ᆼ ᄒ ᅡ ᆫ ᄌ ᅡᄅ ᅭᄅ ᅩ ᄒ ᅪ ᆯᄋ ᅭ ᆼ ᄀ ᅡᄂ ᅳ ᆼ ᄒ ᅡ ᆯ ᄀ ᅥ ᆺᄋ ᅳᄅ ᅩ ᄉ ᅡᄅ ᅭ ᄃ ᅬ ᆫ ᄃ ᅡ.
ᄌ
ᅮᄋ ᅭᄋ ᅭ ᆼ ᄋ ᅥ: ᄉ ᅡ ᆫᄋ ᅣ ᆼᄑ ᅮ ᆷᄌ ᅩ ᆼ, ᄋ ᅲᄌ ᅥ ᆫᄌ ᅥ ᆨ ᄃ ᅡᄒ ᅧ ᆼᄉ ᅥ ᆼ, ᄎ ᅩᄋ ᅱᄉ ᅥ ᆼᄎ ᅦ ᄆ ᅡᄏ ᅥ.
1. 서론
2000년대 들어서 산양 (Naemorhedus caudatus raddeanus)에 대한관심은전 세계적으로 증가하고 이
ᆻ는 추세이다. 이는산양이 생산하는산양유 (goat milk)의 영양학적 가치가 우유 (bovine milk) 보 ᄃ
ᅡ 인간의 모유 (Human milk)의 성분 및 조성과 유사한 특성을 보인다는연구결과에 따라 주목을 받 ᄀ
ᅦ 되었다 (Kim 등, 2014; Jung 등, 2016; Haenlein 2004; Raynal-Liutovac 등, 2005; Albenzio와 Santillo, 2011; Yangilar, 2013). 선행연구조사 결과에 따르면, 2010년 기준으로 산양유와관련된유제 ᄑ
ᅮ
ᆷ을 소비하는 인구는 약 1억 9천만명에 도달하였으며, 또한 개발도상국 및 선진국가에서 시장규모 확 ᄃ
ᅢ와 함께 경제적 중요성이 부각되었다고 보고하였다 (Jung 등, 2016; Haenlein 2004; Albenzio 등, 2016; Faostat, 2012; Talpur 등, 2009).
ᄄ
ᅩ한 우리나라의 경우, 2011년 미증유의 구제역 사태 이후 축종을다양화할 필요성이 대두되면서 젖 ᄉ
ᅩ (Holstein) 위주의 낙농산업에서 질병에 강한 품종으로 바꾸거나, 자넨종 (Saanen)과 같은 유산양 ᄆ
ᅩ
ᆨ장을 육성하는것이 바람직하다는주장이 제기되었다 (Kim 등, 2014). 이러한 산양으로부터 생산되 느
ᆫ유제품시장의 지속가능한 성장을위해서는산양 품종에 대한 명확한 유전적 배경을바탕으로 장기 ᄌ
ᅥᆨ인 개량 기반이 구축되어야 할 것이다. 그러나 아직까지 산양 품종에 대한 유전적 특성을파악하는뚜
†
ᄇ ᅩ ᆫ ᄋ ᅧ ᆫᄀ ᅮᄂ ᅳ ᆫ ᄒ ᅡ ᆫᄀ ᅧ ᆼᄃ ᅢᄒ ᅡ ᆨᄀ ᅭ 2016ᄂ ᅧ ᆫᄃ ᅩ ᄒ ᅡ ᆨᄉ ᅮ ᆯᄋ ᅧ ᆫᄀ ᅮᄌ ᅩᄉ ᅥ ᆼᄇ ᅵᄋ ᅴ ᄌ ᅵᄋ ᅯ ᆫ ᄋ ᅦ ᄋ ᅴᄒ ᅡ ᆫ ᄀ ᅥ ᆺᄋ ᅵ ᆷ.
1
(17579) ᄀ ᅧ ᆼᄀ ᅵᄃ ᅩ ᄋ ᅡ ᆫᄉ ᅥ ᆼᄉ ᅵ ᄉ ᅥ ᆨᄌ ᅥ ᆼᄃ ᅩ ᆼ ᄌ ᅮ ᆼ ᄋ ᅡ ᆼᄅ ᅩ 327 ᄒ ᅡ ᆫᄀ ᅧ ᆼᄃ ᅢᄒ ᅡ ᆨᄀ ᅭ ᄎ ᅮ ᆨ ᄉ ᅡ ᆫᄀ ᅵᄉ ᅮ ᆯ ᄌ ᅵᄋ ᅯ ᆫ ᄉ ᅦ ᆫᄐ ᅥ 203ᄒ ᅩ, ᄃ ᅢᄒ ᅡ ᆨᄋ ᅯ ᆫᄉ ᅢ ᆼ.
2
(17579) ᄀ ᅧ ᆼᄀ ᅵᄃ ᅩ ᄋ ᅡ ᆫᄉ ᅥ ᆼᄉ ᅵ ᄉ ᅥ ᆨᄌ ᅥ ᆼᄃ ᅩ ᆼ ᄌ ᅮ ᆼ ᄋ ᅡ ᆼᄅ ᅩ 327 ᄒ ᅡ ᆫᄀ ᅧ ᆼᄃ ᅢᄒ ᅡ ᆨᄀ ᅭ ᄒ ᅡ ᆫᄀ ᅧ ᆼᄃ ᅢᄒ ᅡ ᆨᄀ ᅭ ᄉ ᅢ ᆼᄆ ᅧ ᆼᄀ ᅩ ᆼ ᄒ ᅡ ᆨᄀ ᅪ, ᄌ ᅩᄀ ᅭᄉ ᅮ.
3
(17579) ᄀ ᅧ ᆼᄀ ᅵᄃ ᅩ ᄋ ᅡ ᆫᄉ ᅥ ᆼᄉ ᅵ ᄉ ᅥ ᆨᄌ ᅥ ᆼᄃ ᅩ ᆼ ᄌ ᅮ ᆼ ᄋ ᅡ ᆼᄅ ᅩ 327 ᄒ ᅡ ᆫᄀ ᅧ ᆼᄃ ᅢᄒ ᅡ ᆨᄀ ᅭ ᄒ ᅡ ᆫᄀ ᅧ ᆼᄃ ᅢᄒ ᅡ ᆨᄀ ᅭ ᄉ ᅢ ᆼᄆ ᅧ ᆼᄀ ᅩ ᆼ ᄒ ᅡ ᆨᄀ ᅪ, ᄀ ᅭᄉ ᅮ.
4
ᄀ ᅭᄉ ᅵ ᆫᄌ ᅥᄌ ᅡ: (17579) ᄀ ᅧ ᆼᄀ ᅵᄃ ᅩ ᄋ ᅡ ᆫᄉ ᅥ ᆼᄉ ᅵ ᄉ ᅥ ᆨᄌ ᅥ ᆼᄃ ᅩ ᆼ ᄌ ᅮ ᆼ ᄋ ᅡ ᆼᄅ ᅩ 327 ᄒ ᅡ ᆫᄀ ᅧ ᆼᄃ ᅢᄒ ᅡ ᆨᄀ ᅭ, ᄒ ᅡ ᆫᄀ ᅧ ᆼᄃ ᅢᄒ ᅡ ᆨᄀ ᅭ ᄉ ᅢ ᆼᄆ ᅧ ᆼᄀ ᅩ ᆼ ᄒ ᅡ ᆨᄀ ᅪ, ᄇ ᅮᄀ ᅭᄉ ᅮ.
E-mail: [email protected]
려
ᆺ한 연구는이루어지고 있지 않은 실정이다. 따라서 다양한 산양 품종을대상으로 생명공학 기술을활 ᄋ
ᅭ
ᆼ하여 품종의 유전적 특성 및 다형성 분석을 통해 산양 품종의 유전자원으로써의 가치 제고와 보존 및 ᄋ
ᅲ
ᆨ종개량에관한 연구 진행이 이루어져야 할 것으로 생각된다.
ᄎ
ᅩ위성체 (Microsatellit)는 다른 마커와 비교하여 유전변이가 높아 집단 간의 관계 및 분포, 근친 저
ᆼ도 파악에 대한 접근이 용이하여 1990년대 중반부터 재래가축의 유전적 다양성, 유래와 계통, 유전 ᄌ
ᅥ
ᆨ 특성 및 보존 등의 목적으로 널리 이용되기 시작하였다 (Shi 등, 2010; Lee 등,2007 Blott 등, 1999;
Ciampolini 등, 1995; Loftus 등, 1999; Martin-Burriel 등, 1999; Moazami-Goudarzi 등, 1997; Peelman ᄃ
ᅳᆼ, 1998; Ruane, 1999; Schmid 등, 1999). 따라서 본연구는초위성체 마커를이용하여 대표적인 자넨 ᄌ
ᅩᆼ (Saanen)을포함하여 8 품종간의 유전적 거리 분석 및 품종별 다형성 분석 등의 계통유전학적 분석 ᄋ
ᅳᆯ 실시하여 다양한 산양 품종을 중요한 가축유전자원으로써 인식하고 타 품종간의 유전적 차별화와 순 ᄉ
ᅮ성을보존하고 능력을개량하는데 있어 기초 자료로활용하고자 실시하였다.
2. 재료 및 방법
2.1. 공시재료 ᄇ
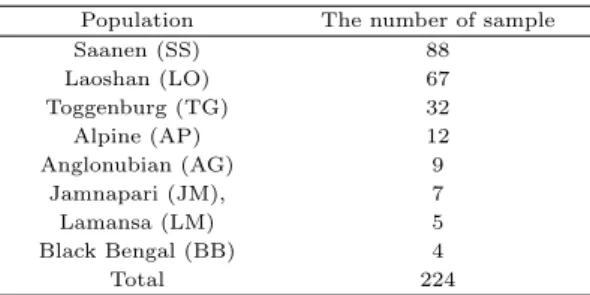
ᅩᆫ 연구에서 초위성체 마커 분석을 위해 사용된 공시재료는 태국의 가축개발부 농장 3곳 (Tea-Pa, Pangchong, Yala 농장)에서 사육되고 Saanen (88), Laoshan (67), Toggenburg (32), Alpine (12), Anglonubian (9), Jamnapari (7), Lamansa (5), Black Bengal (4)의 genomic DNA를 이용하였다 (Table 2.1).
Table 2.1 The number of sample in the study Population The number of sample
Saanen (SS) 88
Laoshan (LO) 67
Toggenburg (TG) 32
Alpine (AP) 12
Anglonubian (AG) 9
Jamnapari (JM), 7
Lamansa (LM) 5
Black Bengal (BB) 4
Total 224
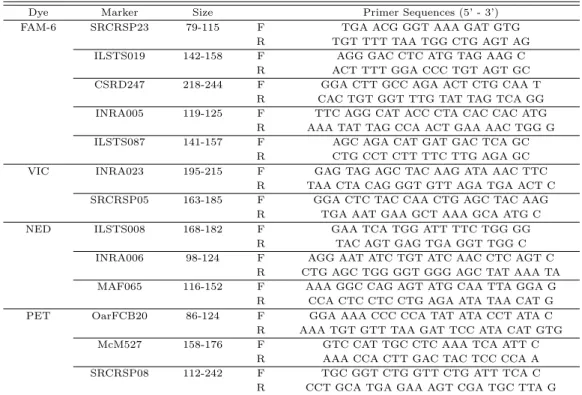
2.2. 초위성체 마커 정보 보
ᆫ연구에서 사용한 초위성체 마커는 국제동물유전학회 (International society for animal genetics;
ISAG)에서 권고하는 13개 goat marker를이용하였다 (Table 2.2).
2.3. PCR 조성 및 방법
PCR 반응액의 조성은 Genomic DNA (20 - 50 ng/μl) 1 μl, 시발체 (Primer)는 Forward 와 Re- verse각각 0.5 μl, Hot start Taq DNA 중합효소 (polymerase) (Genetbio, Korea) 0.2 μl, 10x Buffer 1.8 μl, dNTP 1.5 μl 를 첨가한 후, 반응액을 총 15 μl로 조성하여 GeneAmp PCR system 9700 (applied biosystems, USA) 을 이용하여 PCR을 진행하였다. PCR 조건은 95℃에서 10 분간 Pre- denaturation을 실시한 후 95℃에서 30 초, 58℃에서 30 초, 72℃에서 30 초를 1 cycle로 하여 30 cycle 시
ᆯ시하였다. 그 후 72℃에서 30 분 extension후 4℃에서 종료하였다.
Table 2.2 Primer information for 13 Microsatellite markers in study
Dye Marker Size Primer Sequences (5’ - 3’)
FAM-6 SRCRSP23 79-115 F TGA ACG GGT AAA GAT GTG
R TGT TTT TAA TGG CTG AGT AG
ILSTS019 142-158 F AGG GAC CTC ATG TAG AAG C
R ACT TTT GGA CCC TGT AGT GC
CSRD247 218-244 F GGA CTT GCC AGA ACT CTG CAA T
R CAC TGT GGT TTG TAT TAG TCA GG
INRA005 119-125 F TTC AGG CAT ACC CTA CAC CAC ATG
R AAA TAT TAG CCA ACT GAA AAC TGG G
ILSTS087 141-157 F AGC AGA CAT GAT GAC TCA GC
R CTG CCT CTT TTC TTG AGA GC
VIC INRA023 195-215 F GAG TAG AGC TAC AAG ATA AAC TTC
R TAA CTA CAG GGT GTT AGA TGA ACT C
SRCRSP05 163-185 F GGA CTC TAC CAA CTG AGC TAC AAG
R TGA AAT GAA GCT AAA GCA ATG C
NED ILSTS008 168-182 F GAA TCA TGG ATT TTC TGG GG
R TAC AGT GAG TGA GGT TGG C
INRA006 98-124 F AGG AAT ATC TGT ATC AAC CTC AGT C
R CTG AGC TGG GGT GGG AGC TAT AAA TA
MAF065 116-152 F AAA GGC CAG AGT ATG CAA TTA GGA G
R CCA CTC CTC CTG AGA ATA TAA CAT G
PET OarFCB20 86-124 F GGA AAA CCC CCA TAT ATA CCT ATA C
R AAA TGT GTT TAA GAT TCC ATA CAT GTG
McM527 158-176 F GTC CAT TGC CTC AAA TCA ATT C
R AAA CCA CTT GAC TAC TCC CCA A
SRCRSP08 112-242 F TGC GGT CTG GTT CTG ATT TCA C
R CCT GCA TGA GAA AGT CGA TGC TTA G
2.4. 초위성체 유전자형 분석
PCR 증폭산물은결과에 따라 Hi-DiTMformamide를 이용하여 10 ∼ 100배로 희석한 다음, 희석된 PCR 증폭산물은다시 한번 Hi-DiTM formamide와 GeneScanTM -500LIZTM size standard로 희석 ᄒ
ᅡ여 Genetic Analyzer 3130xl (applied biosystem, USA)를이용하여 모세관 전기영동을 실시한 후, GeneMapper version 4.1 (applied biosystems, USA)을이용하여 각 초위성체 마커에 대한 대립유전자 ᄋ
ᅴ 크기를결정하였다. 결정된대립유전자들은개체별로 Microsoft Excel (Microsoft, USA)을이용하 ᄋ
ᅧ 자료를취합하고 이를 통해 통계분석에 적용하였다.
2.5. 자료의 통계분석방법 ᄃ
ᅢ립유전자의 수 (No. of allele), 기대이형접합율 (expected heterozygosity; Hexp),관측이형접합율 (observed heterozygosity; Hobs),다형성정보지수 (Polymorphism information content; P IC)를계산 ᄒ
ᅡ기 위해 MS Toolkit software (Park, 2001)를이용하였다. 초위성체 마커 좌위별 동형질성 (homozy- gosity; H0),이형질성 (heterozygosity; hi)는다음과 같이 표시한다.
H0=X
Pi2hi= 1 − H0. (2.1) Pi는초위성체 마커의 각각의 대립유전자 빈도이다. 또한 분석된모든초위성체 마커들의 평균이형질 서
ᆼ (H)는다음과 같이 산출하였다.
H =X
H−i/r. (2.2)
Hi는 i번째 초위성체 마커의 이형질성이며 r은 분석대상 초위성체 마커 수이다. 각각의 집단에 다형성 저
ᆼ보지수 (P IC : Polymorphism information content)는다음과 같다.
P IC = 1 −
K
X
i=1
Pi2
!
−
K−1
X
i=1 K
X
j=1
2Pi2Pj2, (2.3)
ᄋ
ᅧ기서 Pi, Pj는각각 i번째 j번째 대립 유전자가 나타나는확률이며, n은대립 유전자의 개수이다.
ᄀ ᅡ
ᆨ 좌위별 집단간 또는 집단내의 다형에 의한 집단간의 상이성 정도를 파악하기 위해 Wright (1951)에 의해 제시된 F-statistics 값을 이용하고자 Weir와 Cockerham (1984)에 의해 고안된 방법 ᄋ
ᅦ 의해 계산하였다 (Table 3.1).
ᄇ
ᅮ권부정율은부모에 대한 정보가 전혀 없는경우 (NE-1P), 한쪽부모를알고 있을때 다른한 쪽의 ᄇ
ᅮ권부정율 (NE-2P)의 경우, 양친과 자손을모두 알고 있는경우 (NE-PP)의 부권부정율,비혈연 집 ᄃ
ᅡᆫ 내에서 동일 유전자형을보유할 수 있는 동일 개체 출현율 (NE-1)과 두 형매 사이에서 동일한 유전 ᄌ
ᅡ형을보유할 수 있는형매 내 동일개체 출현율 (SI),비혈연 집단 내에서 동일 유전자형을보유할 수 이
ᆻ는 동일 개체 출현율 (NE-1)과 두 형매 사이에서 동일한 유전자형을 보유할 수 있는형매 내 동일개 ᄎ
ᅦ 출현율 (NE-SI)을 Cervus ver 3.0 (Marshall 등, 1998)프로그램을이용하여 산출하였다.
지
ᆸ단 간 유전적 상관관계를 확인하기 위해서 각 마커별 대립유전자 빈도를 이용하여 주성분분석 (principal components analysis; PCoA) 및 요인대응분석 (factorial components analysis; FCA)을각 ᄀ
ᅡ
ᆨ GenAlEx 6.4 (Peakall and Smouse, 2006)와 Genetix (Belkhir 등, 2004)를이용하여 분석하였다.
3. 결과 및 고찰
3.1. 초위성체 마커의 다형성 보
ᆫ 연구는태국의 가축개발부 농장 3곳 (Tea-Pa, Pangchong, Yala 농장)으로부터 제공받은 8 품종 ᄋ
ᅳᆯ대상으로 13종의 초위성체 마커를활용하여 품종간의 유전적 다양성을 분석하였다. 전체 공시재료 르
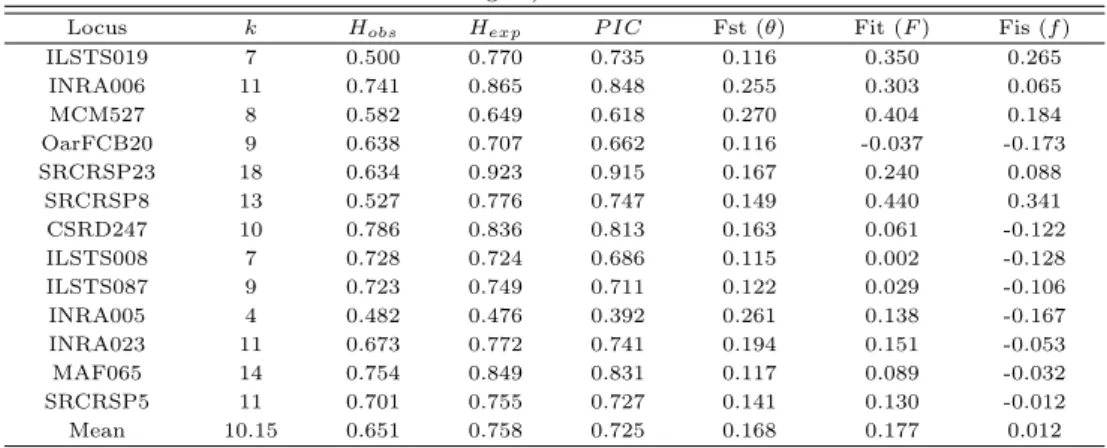
ᆯ대상으로 13종의 초위성체 마커에 대한 대립유전자 수 (No. of Allele), 관측이형접합율 (observed heterozygosity; Hobs), 기대이형접합율 (expected heterozygosity; Hexp), 다형성정보지수 (polymor- phism information content; P IC), F-통계량 (Fit(F ), Fst (θ) 및 Fis (f ))을계산하여 Table 3.1에 제 ᄉ
ᅵ하였다.
ᄌ
ᅥᆫ체집단을대상으로 13종의 초위성체 마커를 분석한 결과 4개 (INRA005)부터 18개 (SRCRSP23)까 ᄌ
ᅵ 평균 10.15개의 대립유전자가확인되었다. Botstein 등 (1980)은초위성체 마커의 다형성 정도를판 ᄃ
ᅡᆫ하는 기준은 기대이형접합율 (Hexp) 값이 0.6 이상이고, 다형성정보지수 (P IC)의 값이 0.5 이상인 ᄆ
ᅡ커는 다형성이 높은마커라고 보고한 바 있다 (Albenzio and Santillo, 2011). 본연구 결과 13종의 ᄎ
ᅩ위성체 마커의 Hexp값은 0.476 (INRA005)에서 0.923 (SRCRSP23)까지 평균 0.758으로확인되었으 ᄆ
ᅧ, P IC 값의 경우 0.392 (INRA005)에서 0.915 (SRCRSP23)으로, 평균 0.725로확인되었다. 따라서 ᄇ
ᅩᆫ연구에 이용된 INRA005 (Hexp;0.476, P IC;0.392)마커를제외한 12종의 초위성체 마커는산양 품 ᄌ
ᅩ
ᆼ의 다형성 분석 연구에 있어활용가치가 높은것으로 사료된다.
ᄀ ᅡ
ᆨ 초위성체 마커의 유전적 고정에 따른 근친 정도와 집단간의 차별성 여부를 확인하기 위하여 F- statistics 분석 결과를산출하였다 (Table 3). F-statistics 분석은이형접합체 감소 정도를나타내는척 ᄃ
ᅩ로써 집단 내 유전적 고정 정도에 따른근친 정도 (Fis(f)), 전체집단에 대한 유전적 고정 정도 (Fit (F )),서로 다른 집단 내에 개체들간 이형접합체 감소 정도 (Fst (θ))를나타낸다. 본연구를 통해 초위 서
ᆼ체 마커별 Fis (f )값은평균 0.012로확인되었으며, -0.053 (INRA023)에서 0.341 (SRCRSP8) 사이 ᄋ
ᅦ 나타났으며, (Fit (F ))와 (Fst (θ))는평균 0.177, 0.168로 각각 산출되었다.
Table 3.1 The statistical analysis of No. of Allele (k), heterozygosity (H
obsand H
exp), polymorphism information content (P IC), F-statistics value using selected 13 microsatellite markers among the Goral (daily
goat) breeds
Locus k H
obsH
expP IC Fst (θ) Fit (F ) Fis (f )
ILSTS019 7 0.500 0.770 0.735 0.116 0.350 0.265
INRA006 11 0.741 0.865 0.848 0.255 0.303 0.065
MCM527 8 0.582 0.649 0.618 0.270 0.404 0.184
OarFCB20 9 0.638 0.707 0.662 0.116 -0.037 -0.173
SRCRSP23 18 0.634 0.923 0.915 0.167 0.240 0.088
SRCRSP8 13 0.527 0.776 0.747 0.149 0.440 0.341
CSRD247 10 0.786 0.836 0.813 0.163 0.061 -0.122
ILSTS008 7 0.728 0.724 0.686 0.115 0.002 -0.128
ILSTS087 9 0.723 0.749 0.711 0.122 0.029 -0.106
INRA005 4 0.482 0.476 0.392 0.261 0.138 -0.167
INRA023 11 0.673 0.772 0.741 0.194 0.151 -0.053
MAF065 14 0.754 0.849 0.831 0.117 0.089 -0.032
SRCRSP5 11 0.701 0.755 0.727 0.141 0.130 -0.012
Mean 10.15 0.651 0.758 0.725 0.168 0.177 0.012
3.2. 부정 부권율 및 동일 개체 출현율 ᄀ
ᅡ
ᆨ 마커의 부권부정율은부모에 대한 정보가 전혀 없는경우 (NE-1P), 한쪽부모를알고 있을때 다 ᄅ
ᅳ
ᆫ한 쪽의 부권부정율 (NE-2P)의 경우, 양친과 자손을 모두 알 고 있는경우 (NE-PP)의 부권부정 유
ᆯ,비혈연 집단 내에서 동일 유전자형을보유할 수 있는 동일 개체 출현율 (NE-1)과 두 형매 사이에서 ᄃ
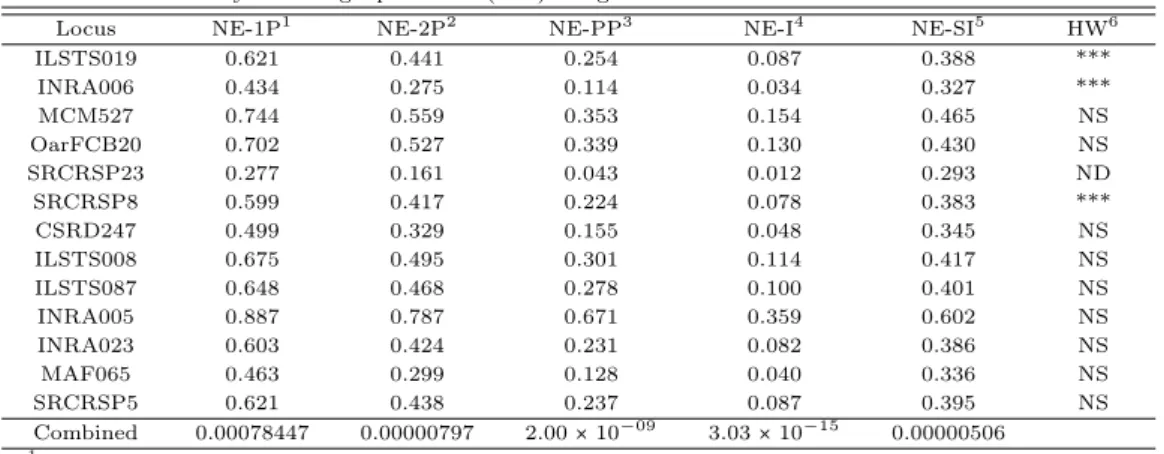
ᅩᆼ일한 유전자형을보유할 수 있는형매 내 동일개체 출현율 (NE-SI)을계산하여 Table 3.2에 제시하였 ᄃ
ᅡ.
SRCRSP23 마커는 부정 부권율과 동일개체 출현율에서 가장 낮은 수치 (NE-1P; 0.227, NE-2P;
0.161, NE-PP; 0.043, NE-1; 0.012, NE-SI; 0.293)를 나타냈으며, INRA005 마커는 가장 높은 수치 ᄅ
ᅳᆯ나타냈다 (NE-1P; 0887, NE-2P; 0787, NE-PP; 0.671).
13종의 초위성체 마커를 사용하여 부권 부정율 및 동일 개체 출현율을 확인 한 결과, NE-1P;
0.00078447, NE-2P; 0.00000797, NE-PP; 2.00× 10−09, NE-1; 3.03× 10⁻¹⁵, NE-SI; 0.00000506으로 화
ᆨ인되었다. 이러한 결과는샘플 집단의 크기에 의해 나타난 것으로 사료되며 집단의 크기가 커질수록 ᄒ
ᅭ과적인 결과를얻을수 있을것으로 생각된다.
ᄄ
ᅡ라서 본연구에 이용된 13종의 초위성체 마커를활용하여 가계도 분석과 동일성 분석을 실시할 경 ᄋ
ᅮ, 마커의 신뢰도가 충분할 것으로 사료된다.
Table 3.2 Average non-exclusion probability for one candidate parent (NE-1P), Average non-exclusion probability for one candidate parent given the genotype of a known parent of the opposite sex (NE-2P), Average
non-exclusion probability for a candidate parent pair (NE-PP) Average non-exclusion probability for identity of two unrelated individuals (NE-I), Average non-exclusion probability for identity of two siblings (NE-SI) and
Hardy-Weinberg equilibrium (HW) using selected 13 microsatellite markers
Locus NE-1P
1NE-2P
2NE-PP
3NE-I
4NE-SI
5HW
6ILSTS019 0.621 0.441 0.254 0.087 0.388 ***
INRA006 0.434 0.275 0.114 0.034 0.327 ***
MCM527 0.744 0.559 0.353 0.154 0.465 NS
OarFCB20 0.702 0.527 0.339 0.130 0.430 NS
SRCRSP23 0.277 0.161 0.043 0.012 0.293 ND
SRCRSP8 0.599 0.417 0.224 0.078 0.383 ***
CSRD247 0.499 0.329 0.155 0.048 0.345 NS
ILSTS008 0.675 0.495 0.301 0.114 0.417 NS
ILSTS087 0.648 0.468 0.278 0.100 0.401 NS
INRA005 0.887 0.787 0.671 0.359 0.602 NS
INRA023 0.603 0.424 0.231 0.082 0.386 NS
MAF065 0.463 0.299 0.128 0.040 0.336 NS
SRCRSP5 0.621 0.438 0.237 0.087 0.395 NS
Combined 0.00078447 0.00000797 2.00 × 10
−093.03 × 10
−150.00000506
1
NE-1P: non-exclusion probability for one candidate parent.
2
NE-2P: non-exclusion probability for one candidate parent given the genotype of a known parent of the opposite sex.
3
NE-PP: non-exclusion probability for a candidate parent pair.
4
NE-I: non-exclusion probability for identity of two unrelated individuals.
5
NE-SI: non-exclusion probability for identity of two siblings.
6
HW: Significance of deviation from Hardy-Weinberg equilibrium. Key: NS = not significant,
* = significant at the 5% level, ** = significant at the 1% level, *** = significant at the 0.1% level, ND = not done. These significance levels include a Bonferroni correction if the Bonferroni correction option was selected.
3.3. 집단간의 유전거리 및 유연관계 보
ᆫ연구에활용된 8 품종의 산양 집단의 유전적 유연관계를확인하기 위하여 집단간의 유전적 거리에 ᄌ
ᅮ성분분석 (principal coordinates analysis; PCoA) 및 요인대응분석 (factorial components analysis;
FCA)을 실시하여 Figure 3.1, Figure 3.2에 각각 제시하였다.
PCoA 분석 결과 제 1성분의 분산치는 22.43%,제 2성분의 분산치는 19.62%로확인되었으며, 이 변 ᄉ
ᅮ들에 의해서는 SS 품종과 LO 품종그리고 TG 품종은서로 군집을형성하는것을확인 할 수 있었다 (Figure 3.1 (b), 3.1 (c), 3.1 (d)). 그 외 다른 품종들은 집단의 크기가 작아 군집형성을이루지 못한 것 ᄋ
ᅳ로확인되었다. 이 또한 집단의 크기를고려하여 추가 분석이 이루어진다면 각 집단의 군집이 형성될 거
ᆺ으로 사료된다.
ᄋ
ᅭ인대응분석 결과 총 분산치는 62.31% (Axe 1(23.55%), Axe 2 (22.74%), Axe 3 (16.02%))로확인 되었다. 3차원도표 작성 결과, 각각의 품종이 서로 다른 군집을형성하는것을확인 할 수 있었다.
보
ᆫ연구는산양 8품종을대상으로 13종의 초위성체 마커의 다형성 분석, 부정 부권율 및 동일 개체 출 ᄒ
ᅧᆫ율을계산하였다. 이러한 결과는 본연구에 이용된13종의 초위성체 마커가 산양 품종을대상으로 다 혀
ᆼ성 분석, 가계도 분석 및 동일성 분석에 있어 충분한활용가치가 있는마커라고 사료된다. 또한 산양 8품종간의 유전적 거리를계산하여 계통유전학적 분석을 실시한 결과, 3 품종 (SS, LO그리고 TG)의 겨
ᆼ우 각 품종별 군집을형성하는것을확인 할 수 있었다. 그러나 특정 품종의 유전적 고정보다는전체
ᄌ
ᅥᆨ으로 다형성을갖고 있는것으로확인되었다. 이러한 결과는산양 품종에 대한 다양한 개량 방향 설정 ᄋ
ᅦ 있어 효과적일 것으로 사료된다. 가축유전자원으로써 다형성 보존은앞으로 많은연구자들이 지켜야 ᄒ
ᅡᆯ 중요한 과제라고 사료된다. 따라서 본연구는산양 품종을 중요한 가축유전자원으로써 인식하고 타 ᄑ
ᅮ
ᆷ종과의 유전적 차별화 및 순수성 보존, 추가적으로 능력을개량하는데 있어 기초 자료로활용가능할 거
ᆺ으로 사료된다.
(a) PCoA with total breeds
(b) The highlight of only SS breeds
(c) The highlight of only LO breeds
(d) The highlight of only TG breeds.
Figure 3.1 Principal coordinates analysis (PCoA) of allele frequencies from 13 microsatellite loci typed in 8 population using the GenAlEx, SS: Saanen, LO: Laoshan, TG: Toggenburg, AP: Alpine, AG: Anglonubian, JM:
Jamnapari, LM: Lamansa, BB: Black Bengal
Figure 3.2 Factorial components analysis (FCA) of allele frequencies from cattle microsatellite loci genotypes calculated using GENETIX, SS: Saanen, LO: Laoshan, TG: Toggenburg, AP: Alpine, AG: Anglonubian, JM:
Jamnapari, LM: Lamansa, BB: Black Bengal
References
Albenzio, M. and Santillo, A. (2011). Biochemical characteristics of ewe and goat milk: Effect on the quality of dairy products. Small Ruminant Research, 101, 33-40.
Belkhir, K., Borsa, P., Chikhi, L., Raufaste, N. and Bonhomme, F. (1996-2004). GENETIX 4.05, logiciel sous windows TM pour la genetique des populations, Laboratoire Genome, Populations, Interactions, CNRS UMR 5171, Universite de Montpellier II, Montpellier. France.
Blott, S. C., Williams, J. L. and Haley, C. S. (1999). Discriminating among cattle breeds using genetic markers. Heredity, 82, 613-619.
Faostat, F. (2012). Dispon´ ivel em: http://faostat.fao.org, Acesso em, 14.
Ciampolini, R., Moazami-Goudarzi, K., Vaiman, D., Dillmann, C., Mazzanti, E. and Foulley, J. L. (1995).
Individual multilocus genotypes using microsatellite polymorphisms to permit the analysis of the genetic variability within and between Italian beef cattle breeds. Journal of Animal Science, 73, 3259-3268.
Haenlein, G. (2004). Goat milk in human nutrition. Small Ruminant Research, 51, 55-163.
Jung, T. H., Hwang, H. J., Yun, S. S., Lee, W. J., Kim, J. W., Shin, K. O., and Han, K. S. (2016). The Commercial Value of Goat Milk in Food Industry. Journal of Milk Science and Biotechnology, 34, 173-180.
Kim, H. H., Park, Y. S. and Yoon, S. S. (2014). Major Components of Caprine Milk and Its Significance for Human Nutrition. Korean Journal of Food Science and Technology, 46, 121-126.
Lee, J. Y., Bae, J. H. and Yeo, J. S. (2007). Bootstrapping and DNA marker Mining of BMS941 microsatel- lite Locus in Hanwoo chromosome 17. Journal of the Korean Data & Information Science Society, 18, 1103-1113.
Loftus, R. T., Ertugrul, O., Harba, A. H., El-Barody, M. A. A., MacHugh, D. E., Park, S. D. E. and Bradley, D. G. (1999). A microsatellite survey of cattle from a centre of origin: The Near East.
Molecular Ecology, 8, 2015-2022.
Marshall, T., Slate, C. J., Kruuk, L. E. and Pemberton, J. M. (1998). Statistical confidence for likelihood- based paternity inference in natural populations. Molecular Ecology, 7, 639-655.
Martin-Burriel, I., Garcia-Muro, E. and Zaragoza, P. (1999). Genetic diversity analysis of six Spanish native cattle breeds using microsatellites. Animal Genetics, 30, 177-182.
Moazami-Goudarzi, K, Laloe, D., Furet, J. P. and Grosclaude, F. (1997). Analysis of genetic relationships between 10 cattle breeds with 17 microsatellites. Animal Genetics, 28, 338-345.
Park, S. D. E. (2001). Trypanotolerance in West African cattle and the population genetic effects of selec- tion, Ph.D. Thesis, University of Dublin.
Peelman, L. J., Mortiaux, F., Van Zeveren, A., Dansercoer, A., Mommens, G., Coopman, F., Bouquet, Y.,
Burny, A., Renaville, R. and Portetelle, D. (1998). Evaluation of the genetic variability of 23 bovine
microsatellite markers in four Belgian cattle breeds. Animal Genetics, 29, 161-167.
Raynal-Ljutovac, K., Gaborit, P. and Lauret, A. (2005). The relationship between quality criteria of goat milk, its technological properties and the quality of the final products. Small Ruminant Research, 60, 167-177.
Ruane, J. (1999). A critical review of the value of genetic distance studies in conservation of animal gentic resources. Journal of Animal Breeding and Genetics, 116, 317-323.
Schmid, M., Saitbekova, N., Gaillard, C. and Dolf. G. (1999). Genetic diversity in Swiss cattle breeds.
Journal of Animal Breeding and Genetics, 116, 1-8.
Talpur, F. N., Bhanger, M. and Memon, N. N. (2009). Milk fatty acid composition of indigenous goat and ewe breeds from Sindh. Pakistan Journal of Food Composition and Analysis , 22, 59-64.
Weir, B. S. and Cockerham, C. C. (1984). Estimating F-statistics for the analysis of population structure.
Evolution, 38, 358-1370.
Wright, S. (1951). The genetical structure of populaitons. Annals of Eugenics, 15, 323-354.
Yangilar, F. (2013). As a potentially functional food: goats’milk and products. Journal of Food and Nutrition Research, 1, 68-81.
Zheng, S., Lee, J. H., Lee, Y. S., Oh, D. Y. and Yeo, J. S. (2010). Analysis of genetic diversity and distances
in Asian cattle breeds using microsatellite markers. Journal of the Korean Data & Information Science
Society, 21, 798-802.
2017, 28
(5)
,1043–1053
Molecular genetic evaluation of gorals(naemorhedus caudatus raddeanus) genetic resources using
microsatellite markers †
Joo Hee Seo
1
· Yoonseok Lee2
· Gwang Joo Jeon3
· Hong Sik Kong4
1The Graduate School of Future Convergence Technology, Department of Genomic Informatics, Hankyong National University
234Genomic Informatics Center, Hankyong National University
Received 10 May 2017, revised 6 September 2017, accepted 7 September 2017
Abstract
In this study, genotyping was executed by using 13 microsatellite markers for ge- netic diversity of 224 Gorals (Saanen(88), Laoshan(67), Toggenburg(32), Alpine(12), Anglonubian(9), Jamnapari(7) and Black Bengal(4)). The number of alleles was ob- served 4 (INRA005) to 18 (SRCRSP23) each markers. Observed heterozygostiy (Hobs), expected heterozygosity (Hexp) and polymorphism information content (P IC) were ob- served 0.482 to 0.786, 0.476 to 0.923, and 0.392 to 0.915, respectively. Principal Com- ponents Analysis(PCoA) results were similar to the results of FCA. NE-I(on-exclusion probability for identity of two unrelated individuals) was estimated at 2.47×10⁻¹⁵. In conclusion, this study shows the useful data that be utilized as a basic data of Gorals breeding and development.
Keywords: Gorals, genetic diversity, Microsatellite marker.
†
This work was supported by a research grant from Hankyong National University in the year of 2016.
1
Graduate student, Department of Genomic Informatics, Hankyong National University, Anseong, 17579, Korea.
2
Assistant professor, Department of Biotechnology, Hankyong National University, Anseong, 17579, Korea.
3
Professor, Department of Biotechnology, Hankyong National University, Anseong, 17579, Korea.
4