Uthai Tanlamai*․Phannaphatr Savetpanuvong**․Wisit Kunarittipol***
Abstract
Usability and knowledge drawn from utilizing various ways of representing accounting data were examined. Classroom experiments were conducted to compare students’ assessment of financial data using table of numbers, 2-dimensional column graphs (2D), 3-dimensional column graphs (3D), and mixed reality visualization of true 3-dimensional graphs (MR). The results showed that in assessing the financial status and performance of a firm, Table of numbers and MR took longer than 2D and 3D graphs. The time spent on true 3D graphs using MR technology was about the same as Table of numbers. When compared the assessment scores of the firm’s financial status and performance between participants and experts, the difference was the least when participants used 2D graphs.
However, MR was seen as being a new way to provide data of greater complexity and was very useful for financial information.
Keywords:Financial Accounting Data Visualization, Mixed Reality, Usability of 3D Graphics with 3D Reality
1)
Received:2011. 12. 02. Final Acceptance:2012. 01. 27.
※ This research was supported by “Integrated Innovation Academic Center: IIAC” Chulalongkorn University Centenary Academic Development Project. We wish to thank the staff from the computer center at the Chulalongkorn Business School, Mr. Anirut Asawasakulsorn and Ms. Pakakaew Tepsuwan for their helps during the experiment and Mrs. Pornpipat Kaeokla for her help in arranging expert panel for the study. The comments and support from the members of the Business Visualization Research Group at Chulalongkorn University are greatly appreciated.
* Department of Accountancy, Chulalongkorn Business School, Chulalongkorn University, Bangkok 10330, Thailand, e-mail : [email protected]
** Technopreneurship and Innovation Management Program, Graduate School, Chulalongkorn University, Bangkok 10330, Thailand, e-mail : [email protected]
*** LarnGear Technology, Production Manager, 99/25 Software Park Building 12th Fl, Chaengwattana Rd, Nonthaburi 11120, Thailand, e-mail : [email protected]
1. Introduction
Users of financial data are used to see table of numbers and spreadsheet graphs. There are many studies examining the effective use of tables versus graphs, especially those being used as decision aids. Mixed results were reported. Some found tables to be more effec- tive than graphs; others found graphs to be better. Also, two dimensional (2D) and three dimensional (3D) graphs were often examined to see which type would outperform the other.
Some studies found 3D graphs to be associated with slower decision times and reliable per- formance decrements [Fischer, 2000, Carswell, 1991]. 3D rotational visuals were found to make the best prediction in terms of decision accu- racy by novice users who dealt with complex, multidimensional accounting data [Brath and Peters, 2005; Dull and Tegarden, 1999; Helweg- Larsen and Helweg-Larsen, 2007]. However, Kumar and Benbasat [2004] found 3D line graphs consistently outperformed their equivalent 2D graphs [Kumar and Benbasat, 2004]. The 2D and 3D graphs in the majority of previous stud- ies were static and the 3D graphs were 3D on a 2D plane. The question as to whether a true 3D graph representation would outperform the other types of data representations has yet to be explored.
Using Mixed Reality (MR) or Augmented Reality technology, a true 3D object can be created. Introduced by Paul Milgram [Milgram and Kishino, 1994] to combine real and virtual worlds through the use of computer technology, the concept of mixed reality has evolved and
changed rapidly to cover a wide range of appli- cations. MR technology being utilized in this study includes the use of computer hardware with a webcam and markers or barcode cards that will be detected by the systems and even- tually project the 3D images in the form of holo- gram look alike on a computer screen.
2. Financial Report Visualization
Spreadsheet graphs have been used exten- sively in financial reports. Previous studies found limited types of graphs being used in an- nual reports of public companies [Tanlamai and Tangsiri, 2010]. Financial data users appeared to have mixed learning outcomes from their ex- posure to spatial graphs or spatial tables and symbolic tables [Tanlamai and Soongswang, 2009; Tanlamai and Soongswang, 2011]. The study of whether tables or graphs can be more useful in presenting numerical data was dated back over five decades [Carter, 1947] and re- gained its momentum when spreadsheet soft- ware became part of normal business practices in the mid 1980s and 1990s [Remus, 1984; Coll and Coll, 1989; Coll and Coll, 1993]. Also, many studies focused on proper presentation of in- formation and the accuracy of information as seen by decision makers [Kirner and Kirner, 2006; Tufte, 2001].
In recent years, studies of graphic represen- tations still focused on decision making envi- ronment. Amer [Amer and Ravindran, 2010]
used the Latency-Correction theory that was offered by Changizi and colleagues to explain why 3D graphs (especially those being pro-
duced in traditional spreadsheet software) would create a cognitive illusion with a split-second of real world object deception [Amer and Ravin- dran, 2010; pp. 25-26]. The found that gridlines for 2D and 2D graphs could mitigate decision biases. Huysmans and associates [2011] studied the accuracy, answer time, and answer con- fidence of alternative representation formats, i.e., decision tables, decision trees, propositional rules, and oblique rules, in the classification of a new loan application [Huysmans et al., 2011].
They found decision tables to outperform other representation formats. By comparing tables with MR technology, Tanlamai and associates [2011] found MR to be easy and useful and re- quired shorter amount of time and more learn- ing gain than tables [Tanlamai et al., 2011].
3. Methodology
The objective of study is to examine the ac- ceptance and usability of different types of visu- alizations, including tables, two and three di- mensional graphs, and three dimensional graphs constructed by Mixed Reality technology.
3.1 User Experiment
As Chang et al. [2010] pointed out; quasi- experimental approach to collect data in small groups was a simple and effective method of learning-based evaluation. He also pointed out that “learning in visualization use is learning about the dataset being visualized” [Chang et al., 2010; p. 2]. The present study was a with- in-subject experimental design study. There were 3 hospital data sets being used in the
experiment. The four types of data representa- tion being included were Table (T), 2-dimen- sional column graphs (2D), 3-dimensional col- umn graphs (3D), and a true 3-dimensional graph using mixed reality visualization (MR).
The subjects were students in the second year and forth year who were studying in the Bachelor of Accountancy program in a large public university. The participants received class credit and a small souvenir for participation.
Booklets containing detailed instructions and questionnaires were created with distinct color coding for each condition. Participants were asked to record the beginning and ending time of each task.
In <Table 1>, there were 124 subjects par- ticipated in the experiment. Each subject was randomly assigned to four types of ques- tionnaire booklets (Q1-Q4). H0, H1 and H2 stood for three sets of hospital data, hospi- tal#0, hospital#1, and hospital#2. The affix af- ter each type of data representations, Table (T), 2D graphs (2D), 3D graphs and 3D in MR format (MR) denoted the dataset being exposed. Since Table was the most common way to show financial data, the same hospital data, T0, was used across all conditions.
Then each subject was asked to assess the data of the next hospital-either 2D1 or 2D2 graphs or 3D1 or 3D2 graphs. Finally, the subject was asked to assess the MR graphs, either MR1 or MR2. By swapping data sets as well as graphic representations, the pres- ent data collection was designed to reduce biases from serially exposure to the same dataset.
<Table 1> Subjects and Responses/Answers in Experiment-1 (Table versus 2D versus 3D graphs)
Questionnaire Table 2D 3D Mixed Reality
Representation T0 2D1 2D2 3D1 3D2 MR1 MR2 #Subjects
Q1 (T0-2D2-MR1) 30 30 30 30
Q2 (T0-2D1-MR2) 32 32 32 32
Q3 (T0-3D2-MR1) 30 30 30 30
Q4 (T0-3D1-MR2) 32 32 32 32
Sum 124 32 30 32 30 60 64 124
Number of Responses 124 62 62 124
Table Format
2 Dimensional Graph (2D)
3 Dimensional Graphs (3D)
3D Graph using Mixed Reality (3D-MR)
<Figure 1> Table, 2D Graph, 3D Graph, and MR Graph Visuals
Each questionnaire booklet starts with col- lecting demographic data and participant’s fa- miliarity with different accounting terms and MR technology. They then proceeded to assess hospital’s financial status (solvency) and per- formance using Table in an Excel file as their first task. The second task was to assess the next hospital data using either 2D or 3D format.
Before performing the third and last task, the participants were trained on the use of MR tool for 20 minutes. Then they were asked to assess another hospital’s data in MR format. Before and after each task, the subject was asked to record the beginning time and the ending time of each task. The last section of the questionnaire book- let contained post-test questions that were de- signed to capture user’s relative preference to- ward all three methods of data representation.
The experiment was done in a computer lab.
The experimental data were presented in four types of visual representations in an Excel file with different sheets containing Table, 2D or 3D and a link to MR program [Larngear Technol- ogy]. For MR interface, paper-based markers were used. Equal data items were given in table, 2D or 3D graphs and 3D with MR image pro- jection. As shown in <Figure 1>, every type of data representations was based on the same 10 years of five financial accounting items : Sales, Net profit, Total assets, Total Liability, Equities and only one financial ratio, ROE, being included.
Eight experts who had already received a master in accountancy or were in the final year of their master degree in accountancy were asked to participate in the same way as the student subjects. They were familiar with fi-
nancial statement analysis but none of them were financial analysts by profession. A few had worked in public accounting firms. None of these experts had any experience with MR before. Their ratings were used to compare with those rated by the participants. Absolute different scores (or congruence between partic- ipants’ rating and experts’ rating) were used as the knowledge drawn measures.
3.2 Study Constructs and Hypotheses
Built on previous study [Tanlamai and Tangsiri, 2010], the present study relied on participant’s self-reported assessment and used the same constructs as follows :
∙Cognitive processing measures (the amount of time spent and the complexity of in- formation).
∙Perception measures of each type of data representation (ease of use and usefulness).
∙Knowledge drawn from the data represen- tation measures (congruence between par- ticipants’ rating and experts’ rating on the financial status and performance of the ex- perimental data set).
Although previous study found that MR out- performed Table in terms of knowledge drawn (Ibid.), however, no evidence has been found to date that MR would also outperform 2D and 3D graphs representations. While graphs and dia- grams are used to amplify cognition and repre- sent complex information, no conclusive result of which type of representations would be eas- ier and more useful as well as required less or
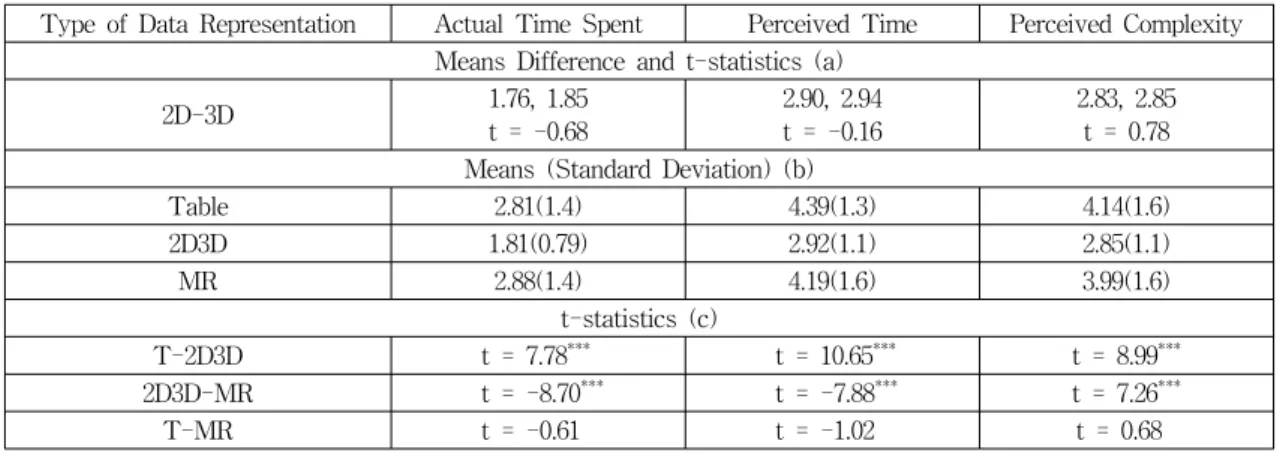
<Table 2> T-test on Means Difference of Actual Time Spent, Perceived Time Spent and Perceived Complexity Type of Data Representation Actual Time Spent Perceived Time Perceived Complexity
Means Difference and t-statistics (a)
2D-3D 1.76, 1.85
t = -0.68
2.90, 2.94 t = -0.16
2.83, 2.85 t = 0.78 Means (Standard Deviation) (b)
Table 2.81(1.4) 4.39(1.3) 4.14(1.6)
2D3D 1.81(0.79) 2.92(1.1) 2.85(1.1)
MR 2.88(1.4) 4.19(1.6) 3.99(1.6)
t-statistics (c)
T-2D3D t = 7.78*** t = 10.65*** t = 8.99***
2D3D-MR t = -8.70*** t = -7.88*** t = 7.26***
T-MR t = -0.61 t = -1.02 t = 0.68
Note) (a) Independent t-test with degree of freedom 1, 61.
(b) Number of observations for all types of representation = 124; 2D and 3D were combined.
(c) ***p < = .001, **p < = .01, *p < .05.
more amount of time to process by users of ac- counting data. These lead to the following null hypotheses :
H1 : There is no difference in the amount of time spent and level of complexity being perceived among different types of data representations.
H2 : Table, 2D, 3D and MR are equally useful and easy to use in assessing a firm’s fi- nancial status and performance.
H3 : There is no difference in the knowledge drawn from Table, 2D, 3D, or MR in the assessment of a firm’s financial status and performance.
4. Results
The majority of the respondents are female (82%) and were in the sophomore year (62%).
None of them had experience with Mixed Reality technology. About half (52%) indicated that they
had not assessed financial data before. This sec- tion included the analysis of cognitive process measures-actual amount of time, perception of time spent and perceived complexity of the way the data were presented. Ease of use and useful- ness of each type of data representations were reported next and followed by the analysis of the knowledge drawn from the use of each type of data representation to assess firm’s status and performance.
4.1 Cognitive Process
For cognitive and perception measures, partic- ipants rated Table to be more complex and re- quired more time to process than 2D, 3D, and MR representations. As shown in <Table 2>, there was no difference in the actual time spent, perceived time, and perceived complexity regard- ing the use of 2D and 3D. Therefore, data for 2D and 3D were combined for further analysis.
The four methods of representing financial ac- counting data had affected the participant’s in-
<Table 3> Perceived Ease of Use and Usefulness for Table, 2D, 3D and MR Representation
Means t-statistics
Perception Table
(N = 124) 2D (N = 62)
3D (N = 62)
MR (N = 124)
Table versus 2D3D
2D3D versus MR
Table versus MR Ease of Use 3.86(1.4) 5.59(1.1) 5.40(0.9) 4.64(1.6) -10.77*** 5.51*** 3.62***
Frustrating to Use 4.07(1.4) 2.69(1.1) 2.79(1.2) 3.79(1.6) 8.67*** -6.96*** -1.38 Complicate to Use 4.15(1.5) 2.71(1.2) 2.68(1.0) 3.81(1.6) 9.44*** -7.43*** -1.68 Useful format for showing data 4.99(1.2) 5.66(1.1) 5.40(1.1) 5.78(1.0) -4.23*** -2.39* 5.47***
Useful format for assessment 5.07(1.2) 5.59(1.2) 5.50(1.1) 5.76(1.1) -3.58*** -1.93 4.56***
Note) ***p < = .001, **p < = .01, *p < .05.
formation processing process differently. Sub- jects spent the lowest amount of time with 2D and 3D representations. Table and MR required about the same amount of time. Thus, the pair- wised differences of Table-2D3D (t-actual time = 7.78, t-perceived time = 10.65, t-complexity = 8.99) and 2D3D-MR (t-actual time = 8.70, t-perceived time = 7.88, t-complexity = 7.26) were at .001 levels of statistically significant. Similar signi- ficant results were found with perceived com- plexity. Except between Table and MR, Hypothe- sis 1 was not supported because there were some differences in the amount of time spent and level of complexity being perceived by other pairs.
4.2 Ease of Use and Usefulness
In terms of perceive ease of use and useful- ness, participants found 2D to be the easiest (Mean = 5.59), followed by 3D (Mean = 5.4), MR (Mean = 4.64), and finally Table (Mean = 3.86).
The most frustrate and complicate to use was Table and MR was perceived as the most use- ful format for showing data and performing assessment. There were differences in means of each pair of data representations : table and 2D3D, 2D3D and MR, and Table and MR. Thus, Hypothesis 2 was not supported.
4.3 Knowledge Drawn
In performing the tasks using data from three hospitals, the experts took longer times than the participants in almost all cases except that they spent less time than participants in the case of 2D and 3D. The means and standard deviations of knowledge drawn from spread- sheet table and MR are shown in <Table 4>.
When 2D and 3D were used, the participants rated the solvency and performance of H2 higher than H1 (2D : 5.50 > 4.37, 5.60 > 4.69; 3D : 5.00 > 4.41, 5.33 > 4.53). However, when MR was used, the ratings of participants and ex- perts were inconsistent. Thus, Hypothesis 3 was not supported.
To further analyze the knowledge drawn, congruency measures were calculated as the absolute differences between participant’s and expert’s rating scores. As shown in <Table 5>, the disparity ratings that was statistically sig- nificant were between Table of Numbers and 2D (T = 1.15, 2D = 1.59, t = -2.18, p = .033) and 3D with MR (2D = 1.59, MR = 1.01, t = 3.28, p = .002). Thus, the results showed participant dif- fered from experts in the 2D mode more than Tables of Numbers and Mixed Reality. The ex- tent of participant-expert rating difference was
<Table 4> Time Spent (minutes) on Each Task and Means (Std. Dev.) of the Firm’s Solvency and Performance Data
Representation
Actual Time Spent Solvency Performance
Subject Expert t-statistic Subject Expert t-statistic Subject Expert t-statistic Table-H0 2.81(1.38) 3.13 -2.62** 4.88(1.5) 6.00 -8.32*** 4.77(1.4) 5.63 -6.75***
2D-H1 2D-H2
1.72(0.89) 1.80(0.71)
2.00 1.00
-1.79 6.13***
4.37(1.5) 5.50(1.1)
6.00 7.00
-5.89***
-7.23***
4.69(1.3) 5.60(1.1)
6.00 7.00
-5.58***
-6.96**
3D-H1 3D-H2
1.91(0.82) 1.80(0.76)
2.50 1.50
-4.11***
2.16*
4.41(1.8) 5.00(1.3)
5.00 5.50
-1.84 -2.17*
4,53(1.4) 5.33(1.1)
5.50 4.50
-3.82***
4.06***
MR-H1 MR-H2
3.07(1.42) 2.72(1.33)
3.25 3.25
-0.99 -3.20**
4.92(1.4) 4.63(1.4)
5.50 6.00
-1.59 -7.63***
5.33(1.4) 5.64(1.2)
5.25 6.50
1.51 -10.99***
Note) ***p < = .001, **p < = .01, *p < .05.
<Table 5> Absolute Value : t-tests of the Congruency Rating of Table, 2D, 3D and MR
Paired Comparison T-2D T-3D T-MR 2D-3D 2D-MR 3D-MR
Congruence of solvency ratings
1.15, 1.59 -2.18, p = .033
1.43, 1.25 1.15
1.29, 1.13 1.19
1.59, 1.28 1.48
1.59, 1.01 3.28, p = .002
1.25, 1.25 0.00 Congruence of
performance ratings
1.11, 1.35 -1.39
1.30, 1.29 0.09
1.35, 1.29 0.56
1.35, 1.16 1.02
1.35, 1.19 0.94
1.29, 1.08 1.18 Note) ***p < = .001, **p < = .01, *p < .05.
First-line shows Mean for Data Rep 1-Mean for Data Rep 2; Second-line shows the t-test statistic and p-value if significant.
<Table 6> Percentage of Participant’s Selection
Responses T : 2D 2D : MR T : MR T : 3D 3D : MR T : MR
Ease of Use 10 : 90 61 : 39 26 : 74 15 : 85 61 : 39 26 : 74
Usefulness 42 : 58 15 : 85 26 : 74 37 : 63 21 : 79 35 : 65
Complexity 87 : 13 21 : 77 58 : 42 77 : 23 16 : 84 52 : 48
Faster to Use 5 : 95 58 : 40 27 : 73 11 : 89 58 : 42 26 : 74 Preference for Assessment 18 : 82 40 : 60 18 : 82 21 : 79 31 : 69 19 : 81
lower when MR and Table were employed. 2D graphs discriminated experts from participants.
4.4 Post-test Analysis
In the post-test questionnaire, participants were asked about their overall perception and preference between different modes of data presentation. The result in <Table 6> showed that 2D and 3D were easier to use than Table of numbers; MR was more useful than 2D and 3D. In terms of complexity, Table and MR were
perceived as more complex than graphs, thus, graphs were faster to use. Also 2D, 3D and MR graphs were preferred mode of presentation for financial assessment. These responses were shared by the experts with no conclusive results.
All in all, experts found 2D and 3D graphs to be easier to use, less complex, and faster to com- prehend than Table and MR. However, MR were chosen to outperform Table and in some cases 3D graphs. These experts had experiences in an- alyzing financial data. However, none of them is a financial analyst by profession.
5. Discussion and Conclusion
Accounting numbers and derived numbers (e.g., various financial ratios) represent the ab- straction of firm’s financial position and perfor- mance. The typical representations are in the form of tables of numbers and 2D and 3D graphs.
Recent MR technology allows a true 3D repre- sentation and flexible user interfaces. The pres- ent empirical study investigated the learning gain and usability of alternative representations - tables, 2D, 3D, and MR. The results showed that 2D was the most efficient modes of re- presentation. The respondents were able to make the assessment with less amount of time and complexity when 2D was used than when any other representations were used.
Knowledge drawn from MR appeared to be higher than those from tables, 2D, and 3D. By using MR, the congruence measures for firm’s assessment were lower than other modes of presentations. Participants who are accounting students were able to have a closer rating to that of the experts in almost all cases. By adding mix-reality layer to the 3D graphs, the present research found novice users to be able to com- prehend the abstractions of financial data faster and be able to assess the information closer to what an expert may have done. Unlike previous studies that compared table with graph [2], the MR graphs were seen as complex and difficult to use. Both tables and MR were rated as being useful but difficult to use. The added value of realism promised by AR and VR as found in Maad et al. [2008] was not embraced by subjects and experts in the present study. It was apparent
that subjects took the time to engage in the ac- tual rotation of 3D graphs and that hands-on ac- tivity resulted in perceived usage difficulty. It is possible that the innovativeness of technology may affect the present results. Despite the great potential of MR, 2D was still the preferred mode of representation. 3D was seen as being the same as 2D. However, since the study only used stu- dent subjects, future research should investigate whether the present conclusions also hold for real users like management, audit committee, fi- nancial analysts and investors.
References
[1] Amer, T. S. and Ravindran, S., “The effect of visual illusions on the graphical display of information”, Journal of Information Sys- tems, Vol. 24, No. 1, 2010, pp. 23-42.
[2] Benbasat, I. and Dexter, A. S., “An inves- tigation of the effectiveness of color and graphical information presentation under varying time constraints”, MIS Quarterly, Vol. 10, No. 1, 1986, pp. 59-84.
[3] Brath, R. and Peters, M., “Information Visu- alization for Business-Past and Future”, Information Management Magazine, (January).
Retrieved from http://www.information-mana gement.com/issues/20050101/1016489-1.html.
2005.
[4] Carswell, C. M., “Graphing in depth : Per- spectives on the use of three-dimensional graphs to represent lower-dimensional data”, Behavior and Information Technology, Vol.
10, No. 6, 1991, pp. 459-474.
[5] Carter, L. F., “An experimental evaluation
of information overload in a production en- vironment”, Journal of Applied Psychology, Vol. 31, 1947, pp. 640-650.
[6] Chang, Remco, Caroline Ziemkiewicz, Pyzh Roman, Joseph Kielman, William Ribarsky,
“Learning-Based Evaluation of Visual Analy- tic Systems”, UNCC Technical report # CVC-UNCC-10-08. Paper presented at the BELIV 2010, April 10-11, Atlanta, Georgia, USA. Access from http://viscenter.uncc.edu/
TechnicalReports.htm, 1 August 2010.
[7] Coll, R. A. and Coll, J. H., “Cognitive match interface design, a base concept for guiding the development of user friendly computer application packages”, Journal of Medical Systems, Vol. 13, No. 4, 1989, pp. 227-235.
[8] Coll, R. and Coll, J. H., “Tables and Graphs : A classification scheme for display presen- tation variables and a framework for re- search in this area”, Information Proce- ssing and Management, Vol. 29, No. 6, 1993, pp. 745-750.
[9] Dull, R. B. and Tegarden, D. P., “A Com- parison of three visual representations of complex multidimensional accounting infor- mation”, Journal of Information Systems, Vol. 13, No. 2, 1999, pp. 117-131.
[10] Fischer, M. H., “Do irrelevant depth cues affect the comprehension of bar graphs?”, Applied Cognitive Psychology, Vol. 14, No.
2, 2000, pp. 151-162.
[11] Helweg-Larsen, R. and Helweg-Larsen, E.,
“Business visualization : a new way to com- municate financial information”, Business Strategy Series, Vol. 8, No. 4, 2007, pp.
283-292.
[12] Huysmans, J., Dejaeger, K., Mues, C., Van- thienen, J., and Baesens, B., “An empirical evaluation of the comprehensibility of deci- sion table, tree and rule based predictive models”, Decision Support Systems, Vol.
51, 2011, pp. 141-154.
[13] Kirner, C. and Kirner, T. G., “A Data Visu- alization Virtual Environment Supported by Augmented Reality”, Paper presented at the IEEE International Conference on Systems, Man, and Cybernetics, October 8-11, 2006, Taipei, Taiwan.
[14] Kumar, N. and Benbasat, I., “The effect of relationship encoding, task types and com- plexity on information representation : An empirical evaluation of 2D and 3D line graphs”, MIS Quarterly, Vol. 28, No. 2, 2004, pp.
255-281.
[15] Larngear Technology, www.larngeartech.com.
[16] Maad, S., Garbaya, S., and Bouakaz, S., “From virtual to augmented reality in financial trading : a CYBERII application”, Journal of Enterprise Information Management, Vol.
21, No. 1, 2008, pp. 71-80.
[17] Milgram, P. and Kishino, A. F., “Taxonomy of Mixed Reality Visual Displays”, IEICE Transactions on Information and Systems, E77-D(12), 1994, pp. 1321-1329.
[18] Remus, W., “An empirical investigation of the impact of graphical and tabular data presentation on decision making”, Management Science, Vol. 30, No. 5, 1984, pp. 533-541.
[19] Tanlamai, U. and Soongswang, O., “Lear- ning from Balance Sheet Visualization”, Paper presented at the 2009 Annual Meeting- American Accounting Association, Aug 3-6,
2009, New York, New York, USA.
[20] Tanlamai, U. and Soongswang, O., “Lear- ning Financial Reports from Mixed Sym- bolic-Spatial Graphs”, Paper to be presen- ted at the eCASE and eTECH 2011, pp.
19-21 January, 2011, Tokyo, Japan.
[21] Tanlamai, U. and Tangsiri, K., “Business Information Visuals and User Learning : A Case of Companies Listed on the Stock Ex- change of Thailand”, Journal of Informa-
tion Technology Applications and Manage- ment, Vol. 17, No. 1, 2010, pp. 11-33.
[22] Tanlamai, U., Savetpanuvong, P., and Kuna- rittipol, W., “Mixed Reality Visualization of Financial Accounting Data”, Journal of In- formation Technology Applications and Mana- gement, Vol. 18, No. 1, 2011, pp. 1-14.
[23] Tufte, E. R., “The Visual Display of Quan- titative Information (2nd ed.)”, Cheshire, Connecticut : Graphics Press LLC, 2001.
Author Profile
Uthai Tanlamai
Uthai Tanlamai is a professor of information systems at Chulalongkorn University. She received her Ph.D. in Manage- ment Information Systems from the University of Illinois at Urbana-Champaign. Prior to joining the Faculty, she was a tenuredfaculty member at California State University at Fresno and taught at Bentley College in Waltham, Massachusetts for a year.
Most of her research interests deal with the beha- vior aspects of information systems implementa- tion. Her current research interests include risk management, ERP implementation, visualization of business reports, augmented reality of financial data.
Phannaphatr Savetpanuvong Phannaphatr Savetpanuvong received a Ph.D. in Techno- preneurship and Innovation Managementat Chulalongkorn University in Thailand. He has more than 14 years of experi- ence in transnational IT and management con- sulting firms, including Hewlett-Packard, Ericsson, Microsoft and IBM. His research focuses on ap- plying artificial intelligence techniques to manage innovation and strategic planning. He has pub- lished a number of articles in conference proceed- ings such as the 4th IEEE International Confer- ence in Management of Innovation and Technology;
the Strategic Management Society 29th Annual International Conference and the International Conference on e-Commerce, e-Administration, e-Society, e-Education, and e-Technology 2010 and 2011.
Wisit Kunarittipol
Wisit Kunarittipol is currently working for Larngear Techno- logy Company Limited spe- cializing in mixed reality de- velopment. He graduated from Chulalongkorn University with bachelor degree in engineering. He has extensive knowledge in three-dimensional imagery devel- opment and CAD software for more than 7 years.
His recent work includes science education kit, museum and tourism experience media.
이 논문은 2011년 12월 02일 접수하여 2012년 01월 27일 게재확정되었습니다.