웹 애플리케이션 성능 분석을 위한 대략적 시뮬레이션 모델
1)김 용 수*
Coarse grained Simulation Model for Web Application Performance Analysis
Yong‐Soo Kim*
요 약
웹은 1990년 Berners‐Lee가 웹 서버와 브라우져를 소개한 이후 우리 생활에 필수 불가결한 요소로 발전되고 있다. 웹의 성능은 사용자와 관리자의 관점이 조금 다를 수 있다. 즉 사용자는 빠른 응답시간에 관심이 있고 관리자 는 응답시간뿐만 아니라 처리율과 같은 시스템 메트릭에도 관심이 있다. 웹 애플리케이션의 성능은 인터넷의 전체 적인 운영환경을 구성하고 있는 여리가지의 요소에 관련되어 있으므로 예측하기가 쉽지 않다. 본 논문에서는 Buch and Pentkowski [1]가 측정한 성능 데이터와 Gunther [2]가 제시한 분석적 모델을 기초로 대략적 시뮬레이션 모델을 제시하였다. 시뮬레이션 모델은 특히 관심이 있는 응답시간과 처리율을 중심으로 구성하였으며 큐 길이 등 에 대한 결과도 추출하였다. 본 시뮬레이션 모델의 결과는 측정된 데이터와 거의 일치하였고 이를 이용하여 성능을 예측할 수 있음을 보였다.
Abstract
The web has been evolving as an indispensable part of our lives since Berners‐Lee introduced the first web sever and browser in 1990. From the web end‐user’s point of view, the response time is a matter of concern. Moreover the throughput is an important factor to consider for the system manager’s point as well.
It’s not easy to estimate the performance of a web application because it depends on various elements comprising the whole operational environment of the Internet from networking, client and server computing powers, DBMS and OS capabilities, to application itself. This paper suggests a coarse‐grained simulation model for web application performance estimation based on the data measured by Buch and Pentkowski [1]
and the analytical model proposed by Gunther [2]. The result of the simulation model almost coincides with the measured data and estimates the performance of a new environment.
▸ Keyword : 웹 애플리케이션 성능(web application performance), 시뮬레이션(simulation), ARENA, 성능 측정(performance measurement)
∙제1저자 : 김용수
∙접수일 : 2008. 8. 13, 심사일 : 2008. 11. 8, 심사완료일 : 2008. 11. 26.
* 경원대학교 IT대학 컴퓨터공학전공 교수
Ⅰ. Introduction
The web has been evolving as an indispensable part of our lives since Berners‐Lee introduced the first web sever and browser in 1990. From the end‐
user’s point of view, the response time is a matter of concern. Moreover the throughput is an important factor to consider for the system manager’s point as well. It’s not easy to estimate the performance of a web application because it depends on various elements comprising the whole operational environment of the Internet from networking, client and server computing powers, DBMS and OS capabilities, to application itself. This paper suggests a coarse‐grained simulation model of web application performance estimation based on the data measured by Buch and Pentkowski [1] and the analytical model proposed by Gunther [2]. Buch and Pentkowski [1] compares the performance of two distributed object technologies used in typical e-business middleware named Middleware-I and Middleware-II. This paper simulates Middleware-I about which Gunther [2] presents the analytical model. Because both middlewares follow the same 3-tier client-server model, the simulation model for Middleware-I can be applied to Middleware-II without modification. The response time and the throughput are focused in the simulation model.
The analytical model of the web performance was studied thoroughly by Menasce and Almeida [3], and backed up with queuing theory by Menasce et al. [4].
Ismail [5] showed the analytical queueing network model can be used to understand the behaviors of heterogeneous environment over Lab experiments.
Though these models suggest bases for the web performance, they do not reflect diverse and dynamic elements in the real world. The simulation gives us a great opportunity to understand the system incorporating the dynamic nature of the real world.
Though the more granular simulation model looks better, sometimes the fine‐grained model fails due to
the difficulty of reflecting the complex interrelationship of the comprising elements. Also obtaining performance information about a design must be fast in order to meet tight time-to-market constraints [6].
This paper suggests a simple coarse‐grained simulation model using ARENA [7] and shows the model presents the asymptotically same result as the measured data [1] and the analytically derived data [2]. ARENA is a general purpose simulation tool and someone says it’s not apt for simulating computer systems pointing out that its smallest time unit is a second. However as long as the tool supports accurate and concrete model, we can make use of it and adjust the time unit on the final result.
ARENA was successfully used for models dealing with subsecond time unit [8,9].
This paper proposes a simple coarse‐grained simulation model for a web application environment comprising a web server, an application server, and a DBMS server.
The remainder of this paper is organized as follows. In the next section, the analysis on the measured performance data and the theoretical background of the analytic model is presented. The suggested simulation model is described in Section III. Finally the simulation result and the conclusion are presented in Section IV and V respectively.
Ⅱ. Analysis on the Measured Data
The web application system (WAS) is depicted in Fig. 1 and the gathered performance data is summarized in Table 1.
그림 1. 웹 애플리케이션 시스템 모델 [2]
Fig. 1. Web Application System Model [2]
The system is comprised of three servers, a web server, an application server, and a DBMS server.
The simulation model is assumed to be closed where a client seamlessly issues a request as soon as it gets a response with zero think time.
N Xwas Rwas Uws Uas Udb
1 24 39 0.21 0.08 0.04
2 48 39 0.41 0.13 0.05
4 85 44 0.74 0.20 0.05
7 100 67 0.95 0.23 0.05
10 99 99 0.96 0.22 0.06
20 94 210 0.97 0.22 0.06
표 1. 시스템 그림 1.에 대해 측정된 성능 데이터 [1,2]
Table 1. Measured Performance Data for the System of Fig. 1 [1,2]
N : Number of clients Xwas : Throughput of the WAS
Rwas : Response time of the WAS in millisecond Uws : Utilization of the web server
Uas : Utilization of the application server Udb : Utilization of the DBMS server
Both Xwas and Rwas are system metrics reported from the client‐side and the utilization was obtained separately from performance monitors on each of the local servers [1,2]. Although more correct performance metrics can be obtained theoretically, the scheme is a very practical approach.
To feed the measured data to the model, service demand metric is needed. By applying the operational analysis, service time is derived from the utilization and throughput as follows [10]:
The throughput is defined as (1)
X = C / T ··· (1)
where C is the number of completions and T is the measurement period.
The mean service time is defined as (2)
S = B / C ··· (2)
where B is the total time the system was busy.
For the utilization is defined the ratio of busy time to the measurement period, the following (3) and (4) are derived.
U = B / T = (C / T) x (B / C) = XS ··· (3)
Hence, S = U / X ··· (4)
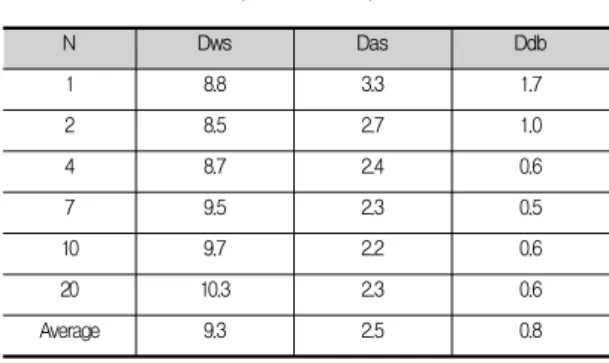
The service time is calculated using (4) and the utilization and throughput given in Table 1. Table 2 shows the driven result. In the coarse‐grained simulation model, the service demand, which is gotten by multiplying the number of visits to the service time, is not distinguished from the service time. The service time and the service demand will be used interchangeably in the paper.
The derived values in Buch and Pentkowski [1]
are a little different from the ones in the Table 2 and Gunther [2] looks to have typos.
N Dws Das Ddb
1 8.8 3.3 1.7
2 8.5 2.7 1.0
4 8.7 2.4 0.6
7 9.5 2.3 0.5
10 9.7 2.2 0.6
20 10.3 2.3 0.6
Average 9.3 2.5 0.8
표 2. 계산된 Service Demand (단위: millisecond) Table 2. Derived Service Demand
(unit: millisecond)
Dws : Service demand of the web server Das : Service demand of the application server Ddb : Service demand of DBMS server
2.1 Gunther’s analytical model I
To satisfy his analytical model, he assigned 12 dummy servers, each with a service demand of 2.2 ms. The dummy node must not interfere with the operation of the real servers and should not exceed the service demand of the bottleneck server. The analytic model using Perl successfully described the
measured data in Fig. 1.
2.2 Gunther’s analytical model II
Gunther tried to fine tune his model by applying statistical regression method to the web server load.
The service demand is given in Table 2 and by using statistics tool like EXCEL or SPSS, the service demand of varied number of clients are estimated.
This analytical model shows us more fine tuned results.
Ⅲ. Simulation Model
Though ARENA does not show explicitly how to represent the closed simulation model, we can describe it with a simple tweak. The input transaction is generated as usual and after finishing its mission it is reinserted immediately into the system to mimic the zero think time.
Three servers, web server, application server, and DBMS server, are provided in line as in Fig. 2 and the service demands in Table 2 are applied to the respective servers. In the paper the exponential distribution is used in the servers without loss of generality. Like in Gunther [2], the dummy server is assumed. But there is no need to adopt multiple servers to not make the dummies interfere with the main system. The service demand of the dummy is assumed 26.2 ms as in Gunther. The three main servers have always a sequence of “seize”, “delay”, and “release” processes in them. By having the dummy do only “delay” process, there needs just one dummy server and we can also make it not interfere with the system. Different from Gunther [2] where average service demands were used, the values directly derived from the measured data were used in the simulation to more closely reflect the actual system.
Because ARENA does not support sub‐second unit, a millisecond is treated as a second and the effect is offset in the final report. The simulation
was run 6 times with the number of clients of 1, 2, 4, 7, 10, and 20 in accordance with the measured data. Each simulation is repeated 5 times with 1,000,000 iterations in each repeat to get a statistically solid result.
Init Entry
DBMS Server Appl.
Server Web
Server Count
Fin?>
Dummy
Server Response
Response time Throughput
End
그림 2. ARENA를 이용한 시뮬레이션 다이어그램 Fig. 2. Simulation Panel Diagram using ARENA
ARENA simulation model is composed of connected modules and properties of the major modules for one client model are as follows:
Entry: Entity Type=client, Type=Constant, Value=1, Entries per Arrival=1, Max Arrival=1
Web Server: Action=Seize Delay Release, Expression=exp(8.8)
Appl. Server: Action=Seize Delay Release, Expression=exp(3.3)
DBMS Server: Action=Seize Delay Release, Expression=exp(1.7)
Dummy Server: Action=Delay, Value=26.2
Response: accumulates response time Throughput: calculates throughput
Response time: calculates average response time
Ⅳ. Results
First of all, the model nicely simulated the real
system and the comparison of the simulated response time and throughput with the original measured data is shown in Table 3 and Fig. 3. As seen in the Fig. 3, the simulation almost perfectly reflects the actual system.
N Xraw Xsim Rraw Rsim
1 24 25 39 40
2 48 49 39 42
4 85 86 44 47
7 100 102 67 68
10 99 103 99 97
20 94 97 210 206
표 3. 처리율과 응답시간의 비교 Table 3. Comparison of Throughput and Response Time
Xraw : Throughput from the measured data Xsim : Throughput from the simulated data Rraw : Response Time from measured data in ms Rsim : Response Time from simulated data in ms
그림 3. 표 3을 그래프로 표시 Fig 3. Graphical representation of Table 3.
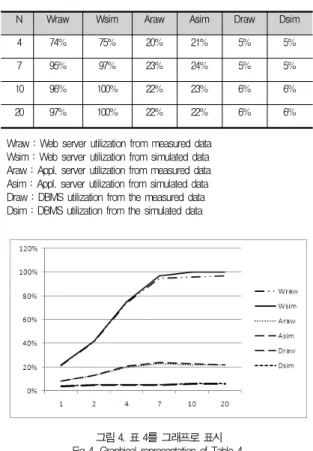
The utilization of three servers from the simulated data also well matches that of the measured data as in Table 4 and Fig. 4.
N Wraw Wsim Araw Asim Draw Dsim
1 21% 22% 8% 8% 4% 4%
2 41% 42% 13% 13% 5% 5%
표 4. 서버 사용율의 비교 Table 4. Comparison of Server Utilization
N Wraw Wsim Araw Asim Draw Dsim
4 74% 75% 20% 21% 5% 5%
7 95% 97% 23% 24% 5% 5%
10 96% 100% 22% 23% 6% 6%
20 97% 100% 22% 22% 6% 6%
Wraw : Web server utilization from measured data Wsim : Web server utilization from simulated data Araw : Appl. server utilization from measured data Asim : Appl. server utilization from simulated data Draw : DBMS utilization from the measured data Dsim : DBMS utilization from the simulated data
그림 4. 표 4를 그래프로 표시 Fig 4. Graphical representation of Table 4.
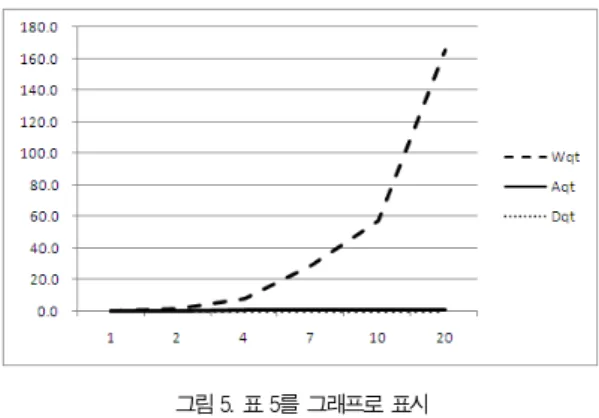
ARENA gives us a wealth of performance data other than the throughput and response time. Here the queue length of the three main servers is presented among them. As we may know from the measured data, the web server is the busiest and the bottleneck of the system. The queue length grows exponentially as the number of clients increase as shown in Table 5 and Fig. 5.
N Wqt Aqt Dqt
1 0.0 0.0 0.0
2 1.9 0.2 0.0
4 8.1 0.5 0.0
7 29.1 0.7 0.0
10 57.7 0.6 0.0
20 165.7 0.7 0.0
표 5. 서버의 큐 길이 비교 Table 5. Queue Length of the Servers
Wqt : Queue length of the web server Aqt : Queue length of the application server Dqt: Queue length of the DBMS server
그림 5. 표 5를 그래프로 표시 Fig 5. Graphical representation of Table 5
Now let’s estimate the performance of a system using the model when there are 30 clients. It is assumed that the service demands for the application server and DBMS server may not change as the number of clients creases because they have lots of capacity yet. But the service demand of the web server would change as the number of clients increase and it is derived by the statistical regression of the measured data. The regression can be easily obtained using the tools like EXCEL or SPSS. Here is the formula from Gunther [2].
Dws(N) = 8.0 x N0.085 ··· (5)
where Dws(N) is the service demand of the web server for N clients.
Using (5), the service demand, 10.7 ms is calculated for the web server with 30 clients.
The simulation result is as follows:
Throughput: 93 Response Time: 321 ms Web Server Utilization: 100%
Application Server Utilization: 21%
DBMS Server Utilization: 6%
Web Server Queue Length: 26.22 Application Server Queue Length: 0.06
DBMS Server Queue Length: 0.00
The throughput slightly decreases and the response time increases substantially. As seen in Table 4 and Table 3, the CPU utilization of the web server reaches 100% when there are 10 clients and the throughput decreases when the number of clients is 10 or more. The result clearly shows that when the maximum capacity of the CPU reaches, the more users decrease the throughput. When a system resource exceeds a threshold like 100% of the utilization, the performance deteriorates exponentially. We should be careful to estimate the performance when the system reaches a saturation point and double check the validity of the model and the result.
Ⅴ. CONCLUSION
In this paper a coarse‐grained simulation model for the web application is proposed. The measured performance data presented by Buch [1] and calibrated analytical model by Gunther [2] is evaluated using the simulation model. The model successfully simulated the measured data and proved correct. It also showed the model can be used to estimate the varied number of clients and the service demands mixes.
참고문헌
[1] D.K. Buch, V.M. Pentkovski, “Experience of characterization of typical multi‐tier e‐
Business systems using operational analysis”, Proceedings of CMG Conference, pp671~681, Anaheim, CA, 2001
[2] Neil J. Gunther, “Analyzing Computer System Performance with Perl::PDQ”, Springer, 2005 [3] Daniel A. Menasce, Virgilio A.F. Almeida,
“Capacity Planning for Web Services”, Prentice Hall PTR, 2002
[4] Daniel A. Menasce, Virgilio A.F. Almeida, Lawrence W. Dowdy, “Performance by Design”, Prentice Hall PTR, 2004
[5] Mohd Nazri Ismail, Abdullah Mohd Zin,
"Comparing the Accuracy of End-to-End Network Performance Measurement Testbed and Simulation Model for Data Transfers in Heterogeneous Environment", 2nd Asia International Conference on Modelling &
Simulation, pp.124~131, May 2008
[6] Eric Cheung, Harry Hsieh, Felice Balarin,
"Framework for Fast and Accurate Performance Simulation of Multiprocessor Systems", High Level Design Validation and Test Workshop, IEEE International, pp.21-28, Nov. 2007
[7] W. David Keltion, Randall P. Sadowski, David T. Sturrock, “Simulation with Arena”, McGraw Hill, 2003
[8] Yong‐Soo Kim, “Response Time Simulation for 2‐tier and 3‐tier C/S System”, The Korea Society of Computer and Information, vol.9, no.3, pp.45~53, September 2004.
[9] Yong‐Soo Kim, “Simulation of Storage Capacity Analysis with Queuing Network Models”, The Korea Society of Computer and Information, vol.10, no.4, pp. 221~228, September 2005.
[10] Neil J. Gunther, “The Practical Performance Analyst”, McGraw Hill, 2000
저 자 소 개
Yong‐Soo Kim
He is currently a full professor of IT College of Kyungwon University, Korea and his research interests include Linux Kernel optimization, RTOS, and computer performance management.
![그림 1. 웹 애플리케이션 시스템 모델 [2]](https://thumb-ap.123doks.com/thumbv2/123dokinfo/5325084.388513/2.892.424.700.821.971/그림-웹-애플리케이션-시스템-모델.webp)