Yeungnam Univ J Med 2018;35(2):205-212
Association of head circumference with cognitive decline and symptoms of depression in elderly: a 3-year prospective study
Oh Dae Kwon
1, So-Young Choi
1, Jisuk Bae
2Departments of
1Neurology and
2Preventive Medicine, Catholic University of Daegu School of Medicine, Daegu, Korea Background: Brain volume is associated with dementia and depression in the elderly. An easy way to predict relative brain volume is to measure head circumference. In this study, we investigated the relationship between head circumference and cognition as well as depression in a non-demented elderly community.
Methods: Baseline and follow-up surveys were conducted in 2007 and 2010. At baseline, community resi- dents aged 65 years or over (n=382) within a rural area of South Korea were screened for dementia and symptoms of depression and were followed using the same screening battery after 3 years (n=279). Data from anthropometric measurements (head circumference, height, and body weight), demographics, and blood tests were gathered. Neuropsychological tests, including the Korean version of mini-mental state examination (K-MMSE), clinical dementia rating (CDR) including the CDR-sum of boxes, the Korean version of instru- mental activities of daily living, and geriatric depression scale (GDS), were performed. None of the 279 subjects followed were demented.
Results: Baseline performance on the K-MMSE and GDS was poorer for participants with smaller head circumferences. Follow-up performance on the MMSE was also poorer for participants with smaller head circumferences. Interestingly, participants with smaller head circumference showed worse GDS scores at baseline but on follow-up examination, participants with larger head circumference showed rapid worsening than those with smaller head circumference with marginal significance by ANOVA test. In regression coeffi- cient analysis, GDS decline showed significant difference.
Conclusion: Head circumference was not associated with cognitive change but was associated with symp- toms of depression in non-demented community residents.
Keywords: Clinical dementia rating; Cognition; Geriatric depression scale; Head circumference; Mini mental state examination
Copyright ©2018 Yeungnam University College of Medicine
This is an Open Access article distributed under the terms of the Creative Commons Attribution Non-Commercial License (http://creative- commons.org/licenses/by-nc/4.0/) which permits unrestricted non-commercial use, distribution, and reproduction in any medium, provided the original work is properly cited.
Received: October 12, 2018, Revised: November 21, 2018 Accepted: November 27, 2018
Corresponding Author: Oh Dae Kwon, Department of Neurology, Catholic University of Daegu School of Medicine, 33, Duryugongwon-ro 17-gil, Nam-gu, Daegu 42472, Korea
Tel: +82-53-650-4298, Fax: +82-53-654-9786 E-mail: dolbaeke@cu.ac.kr
INTRODUCTION
There is evidence that a beneficial developmental environ- ment correlates positively with a higher brain weight [1] and a
thicker cerebral cortex [2]. Brain atrophy in the elderly is fre-
quently seen and especially common in the hippocampus and
temporal, parietal, and frontal lobes. Positive correlation bet-
ween brain atrophy and cognitive decline in Alzheimer’s dis-
ease has been reported [3]. Neuroimaging studies in normally
cognitive elderly have also shown that people with lower edu-
cation have a reduced glucose metabolism compared with those
with a higher education [4]. Therefore, brain volume as well
as environmental enrichment, such as higher education, seems
to have some association with a positive cognitive reserve
[5-7].
Until now, the effect of brain volume, as estimated by head circumference, and the level of cognitive function in normal elderly as well as in patients with Alzheimer’s disease, has been discussed controversially. Evidence supporting a cogni- tive reserve resulting from large brain volume showed that lower brain volume is correlated with cognitive impairment and the onset of Alzheimer’s disease [8-11]. However, there are studies that do not support this theory [12-14]. Depression may advance cognitive dysfunction while cognitive dysfunc- tion commonly accompanies symptoms of depression. Aging can cause frontal lobe atrophy which may, in turn, result in the development of depression [15,16]. Therefore, it is im- portant to evaluate depressive symptoms as well as cognitive symptoms in studies of dementia.
We observed methodological weaknesses in some studies in community dwelling elderly. The participants of those stu- dies were tested with limited cognitive tests and only a few were longitudinal cohort studies. Furthermore, thorough as- sessments of symptoms of depression, which may indicate a degree of frontal degeneration [17,18], were not performed.
We estimated that smaller head circumference may have a negative effect on cognition and symptoms of depression in the elderly.
In the current, prospective study, we investigated whether head circumference affects cognitive decline and depressive symptoms in a non-demented elderly community cohort.
MATERIALS AND METHODS
1. Study population
The population for this study included inhabitants aged 65 years or over that were recorded in the National Residents Registration Lists within one defined rural geographic area of Koryung province, South Korea in 2007. Participants were recruited by community survey. All participants gave their written informed consent before participating in this study.
The data collection protocol was approved by the Institutional Review Board of Daegu Catholic University Medical Center in Daegu, Korea (DCUMC IRB approval number: CR-10- 096-ETC-01-R).
2. Assessment and measurements
Details of study procedures and findings have been pub-
lished elsewhere [19]. Head circumference was measured by passing a plastic tape around the head above the eyebrows and over the most posterior protuberance of the occiput [20].
3. Cognitive assessment and dementia diagnosis
Cognitive function was assessed using the Korean version of the mini-mental state examination (K-MMSE) [21], and cli- nical dementia rating (CDR) scale [22]. The Korean version of instrumental activities of daily living (K-IADL) [23] and a short form of geriatric depression scale (GDS-S) were also per- formed [24]. An informant interview for dementia diagnosis and subtype was also administered [25]. A physical examina- tion included blood pressure examination and a neurological examination. Using the above information, consensus diag- nosis of dementia and dementia subtypes were made by two neurologists.
4. Statistical analysis
One-way ANOVA and post-hoc analysis (Tukey’s studen- tized range test) were conducted to compare the mean diffe- rences among head circumference quartile groups. Mantel- Haenszel chi-square test for trend was used to assess the dif- ferences in proportions among head circumference quartile groups. Multiple regression models were also used. Statistical significance was evaluated with a two-sided significance level of 0.05. All statistical analyses were performed by the IBM SPSS version 19.0 (IBM Co., Armonk, NY, USA).
RESULTS
1. Recruitment
In 2007, 388 subjects (68% of total residents) participated in first interviews, blood tests, and neurological examinations.
Six of them were excluded due to poor compliance during psychological examination. Of the 382 people included, 279 underwent the second survey in 2010.
2. Comparison of men and women
Men who completed follow-up were better educated ( p <
0.001), were less illiterate ( p <0.001), had a higher rate of
current alcohol consumption ( p <0.001), lower total choles-
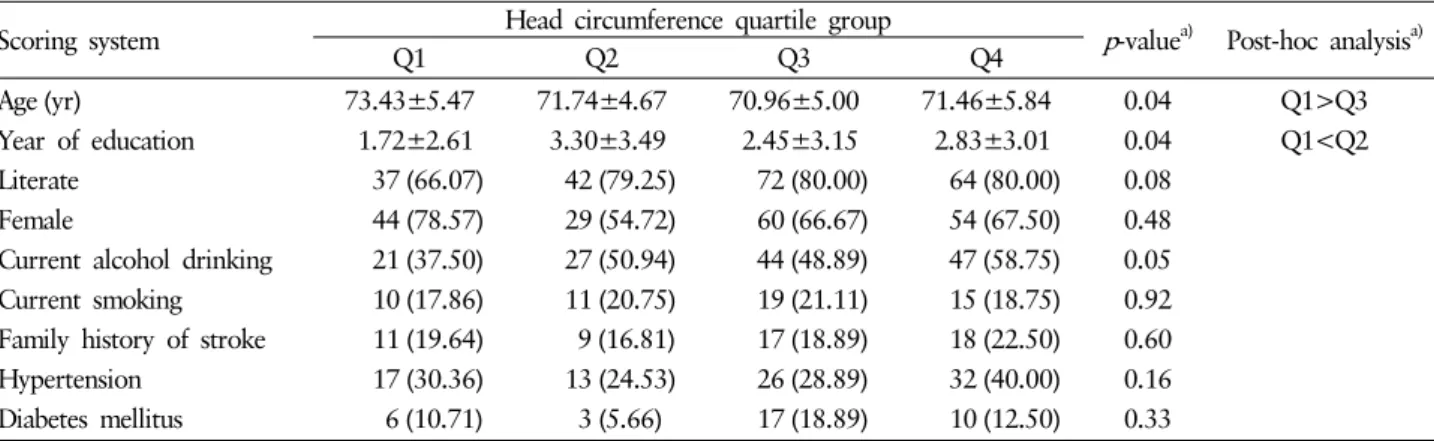
Table 1. Baseline characteristics of the study participants according to head circumference quartile group (among total participants, n=279)
Scoring system Head circumference quartile group
p -value
a)Post-hoc analysis
a)Q1 Q2 Q3 Q4
Age (yr) 73.43±5.47 71.74±4.67 70.96±5.00 71.46±5.84 0.04 Q1>Q3
Year of education 1.72±2.61 3.30±3.49 2.45±3.15 2.83±3.01 0.04 Q1<Q2 Literate 37 (66.07) 42 (79.25) 72 (80.00) 64 (80.00) 0.08
Female 44 (78.57) 29 (54.72) 60 (66.67) 54 (67.50) 0.48 Current alcohol drinking 21 (37.50) 27 (50.94) 44 (48.89) 47 (58.75) 0.05 Current smoking 10 (17.86) 11 (20.75) 19 (21.11) 15 (18.75) 0.92 Family history of stroke 11 (19.64) 9 (16.81) 17 (18.89) 18 (22.50) 0.60 Hypertension 17 (30.36) 13 (24.53) 26 (28.89) 32 (40.00) 0.16 Diabetes mellitus 6 (10.71) 3 (5.66) 17 (18.89) 10 (12.50) 0.33 Data were expressed as mean±SD for continuous variables and number (%) for categorical variables.
a)
Calculated by one-way ANOVA (Tukey’s studentized range tests were used for post hoc analysis) for continuous variables and Mantel-Haenszel chi-square test for trend for categorical variables.
Table 2. Baseline and 3-year follow-up (FU) scores of K-MMSE, K-IADL, CDR-G, CDR-SB, and GDS-S (mean±SD) according to head circumference quartile group (among total participants, n=279)
Scoring system Head circumference quartile group p -value
a)Post-hoc analysis
a)Q1 Q2 Q3 Q4
K-MMSE
Baseline [a] 22.20±4.94 22.88±4.10 24.14±4.19 24.43±4.33 0.01 Q1<Q4
3-year FU [b] 21.67±5.02 22.33±4.28 23.30±4.63 24.05±4.51 0.01 Q1<Q4 Difference [a]-[b] 0.53±3.67 0.55±2.56 0.84±2.81 0.38±3.00 0.67
K-IADL
Baseline [a] 0.05±0.10 0.08±0.14 0.06±0.12 0.07±0.18 0.59 3-year FU [b] 0.18±0.37 0.13±0.22 0.27±0.54 0.14±0.32 0.10 Difference [a]-[b] -0.13±0.36 -0.05±0.22 -0.21±0.52 -0.07±0.33 0.05
CDR-G
Baseline [a] 0.15±0.23 0.18±0.24 0.13±0.22 0.16±0.26 0.59 3-year FU [b] 0.29±0.29 0.23±0.25 0.26±0.35 0.22±0.26 0.47 Difference [a]-[b] -0.13±0.36 -0.05±0.30 -0.13±0.38 -0.06±0.31 0.17
CDR-SB
Baseline [a] 0.23±0.36 0.32±0.50 0.17±0.32 0.33±0.78 0.23 3-year FU [b] 0.60±0.86 0.41±0.54 0.64±0.95 0.50±0.89 0.45 Difference [a]-[b] -0.37±0.91 -0.09±0.58 -0.47±0.91 -0.17±1.10 0.06
GDS-S
Baseline [a] 6.80±4.70 5.65±4.23 5.23±4.07 4.40±3.49 0.007 Q1>Q4 3-year FU [b] 6.49±4.11 5.35±4.34 6.26±4.16 5.56±4.01 0.37
Difference [a]-[b] 0.31±4.03 0.30±3.88 -1.03±3.66 -1.16±3.73 0.05
K-MMSE, Korean version of mini-mental Sstatus examination; K-IADL, Korean version of instrumental activities of daily living; CDR- G, clinical dementia rating-global; CDR-SB, clinical dementia rating-sum of Boxes; GDS, geriatric depression scale-short form.
a)
Calculated by one-way ANOVA (Tukey’s studentized range tests were used for post hoc analysis).
terol ( p <0.001) and LDL levels ( p <0.001), were taller ( p <
0.001), and heavier ( p <0.001), and had a larger head circum- ference than women ( p <0.001). They also showed higher
baseline cognitive scores in K-MMSE ( p <0.001) and were
less depressive ( p <0.001) in initial tests.
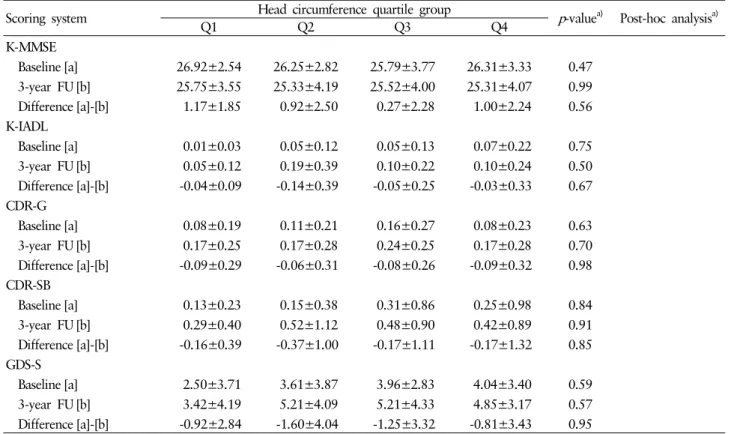
Table 3. Baseline and 3-year follow-up (FU) scores of K-MMSE, K-IADL, CDR-G, CDR-SB, and GDS-S (mean±SD) according to head circumference quartile group (among male participants, n=92)
Scoring system Head circumference quartile group p -value
a)Post-hoc analysis
a)Q1 Q2 Q3 Q4
K-MMSE
Baseline [a] 26.92±2.54 26.25±2.82 25.79±3.77 26.31±3.33 0.47 3-year FU [b] 25.75±3.55 25.33±4.19 25.52±4.00 25.31±4.07 0.99 Difference [a]-[b] 1.17±1.85 0.92±2.50 0.27±2.28 1.00±2.24 0.56
K-IADL
Baseline [a] 0.01±0.03 0.05±0.12 0.05±0.13 0.07±0.22 0.75 3-year FU [b] 0.05±0.12 0.19±0.39 0.10±0.22 0.10±0.24 0.50 Difference [a]-[b] -0.04±0.09 -0.14±0.39 -0.05±0.25 -0.03±0.33 0.67
CDR-G
Baseline [a] 0.08±0.19 0.11±0.21 0.16±0.27 0.08±0.23 0.63 3-year FU [b] 0.17±0.25 0.17±0.28 0.24±0.25 0.17±0.28 0.70 Difference [a]-[b] -0.09±0.29 -0.06±0.31 -0.08±0.26 -0.09±0.32 0.98
CDR-SB
Baseline [a] 0.13±0.23 0.15±0.38 0.31±0.86 0.25±0.98 0.84 3-year FU [b] 0.29±0.40 0.52±1.12 0.48±0.90 0.42±0.89 0.91 Difference [a]-[b] -0.16±0.39 -0.37±1.00 -0.17±1.11 -0.17±1.32 0.85
GDS-S
Baseline [a] 2.50±3.71 3.61±3.87 3.96±2.83 4.04±3.40 0.59 3-year FU [b] 3.42±4.19 5.21±4.09 5.21±4.33 4.85±3.17 0.57 Difference [a]-[b] -0.92±2.84 -1.60±4.04 -1.25±3.32 -0.81±3.43 0.95
K-MMSE, Korean version of mini-mental status examination; K-IADL, Korean version of instrumental activities of daily living; CDR- G, clinical dementia rating-global; CDR-SB, clinical dementia rating-sum of boxes; GDS, geriatric depression scale-short form.
a)
Calculated by one-way ANOVA (Tukey’s studentized range tests were used for post hoc analysis).
3. Anthropometric measures and cognitive decline
When we carried out partial correlation analysis between each anthropometric measure and the amount of cognitive decline, there was no significant correlation among measures of cognition; however, differences in GDS-S were apparent ( p =0.010).
4. Head circumference and changes of cognition and depressive symptoms
The study participants were grouped into quartiles accor- ding to head circumference. In males, the lower quartile was 54.0 cm, the median quartile was 55.0 cm, and the upper quar- tile was 57.0 cm. In females, the lower quartile was 53.0 cm, the median quartile was 53.5 cm, and the upper quartile was 54.5cm. In the total of all participants, the ANOVA test showed
that people in the lowest quartile were older ( p =0.01) and less educated ( p =0.01) (Table 1). When we compared baseline and 3-year follow-up scores, baseline and follow-up K-MMSE scores and baseline GDS scores were worse in the lowest head circumference group ( p =0.05) (Table 2). We divided the group by gender and analyzed males and females separately. In males (n=92), K-MMSE scores were higher in groups with larger head circumferences in baseline ( p =0.01) and follow-up ( p = 0.01) tests. No differences were seen in scores between base- line and follow-up tests in each of the four quartile groups.
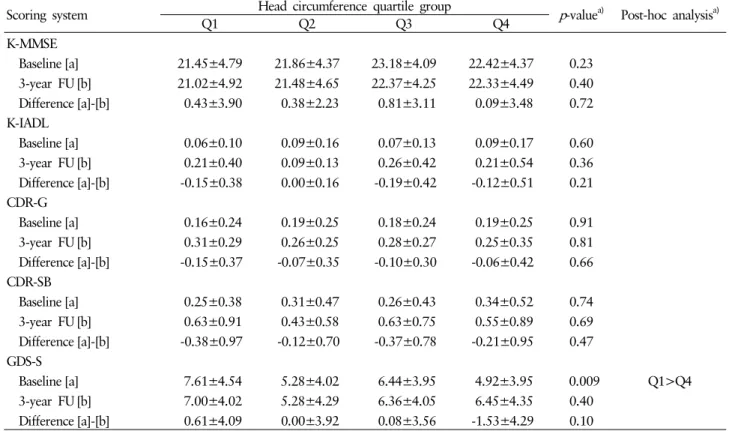
The group with the smallest head circumference showed se- vere depressive symptoms in baseline ( p =0.01) tests but there was no difference in follow-up tests or in the difference bet- ween baseline and follow-up tests (Table 3). In females (n=
187), there was no significant difference between cognitive
scores at baseline and follow-up, nor was there a difference
between baseline and follow-up tests among the four quartile
groups (Table 4). In a crude model of regression analysis, dif-
Table 4. Baseline and 3-year follow-up (FU) scores of K-MMSE, K-IADL, CDR-G, CDR-SB, and GDS-S (mean±SD) according to head circumference quartile group (among female participants, n=187)
Scoring system Head circumference quartile group p -value
a)Post-hoc analysis
a)Q1 Q2 Q3 Q4
K-MMSE
Baseline [a] 21.45±4.79 21.86±4.37 23.18±4.09 22.42±4.37 0.23 3-year FU [b] 21.02±4.92 21.48±4.65 22.37±4.25 22.33±4.49 0.40 Difference [a]-[b] 0.43±3.90 0.38±2.23 0.81±3.11 0.09±3.48 0.72
K-IADL
Baseline [a] 0.06±0.10 0.09±0.16 0.07±0.13 0.09±0.17 0.60 3-year FU [b] 0.21±0.40 0.09±0.13 0.26±0.42 0.21±0.54 0.36 Difference [a]-[b] -0.15±0.38 0.00±0.16 -0.19±0.42 -0.12±0.51 0.21
CDR-G
Baseline [a] 0.16±0.24 0.19±0.25 0.18±0.24 0.19±0.25 0.91 3-year FU [b] 0.31±0.29 0.26±0.25 0.28±0.27 0.25±0.35 0.81 Difference [a]-[b] -0.15±0.37 -0.07±0.35 -0.10±0.30 -0.06±0.42 0.66
CDR-SB
Baseline [a] 0.25±0.38 0.31±0.47 0.26±0.43 0.34±0.52 0.74 3-year FU [b] 0.63±0.91 0.43±0.58 0.63±0.75 0.55±0.89 0.69 Difference [a]-[b] -0.38±0.97 -0.12±0.70 -0.37±0.78 -0.21±0.95 0.47
GDS-S
Baseline [a] 7.61±4.54 5.28±4.02 6.44±3.95 4.92±3.95 0.009 Q1>Q4 3-year FU [b] 7.00±4.02 5.28±4.29 6.36±4.05 6.45±4.35 0.40
Difference [a]-[b] 0.61±4.09 0.00±3.92 0.08±3.56 -1.53±4.29 0.10
K-MMSE, Korean version of mini-mental status examination; K-IADL, Korean version of instrumental activities of daily living; CDR- G, clinical dementia rating-global; CDR-SB, clinical dementia rating-sum of boxes; GDS, geriatric depression scale-short form.
a)
Calculated by one-way ANOVA (Tukey’s studentized range tests were used for post hoc analysis).
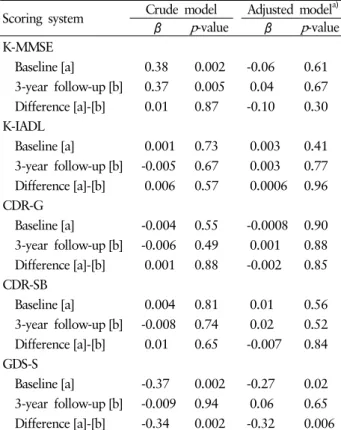
ferences in K-MMSE at baseline ( p =0.002) and follow-up ( p = 0.005) showed significance. However, no significance was not- ed after adjusting for age and education. In the crude model of regression analysis, GDS-S at baseline ( p =0.002) and the di- fferences between baseline and follow-up ( p =0.002) tests were significant among the four quartile groups. Here, significance was noted after adjustment for age and education at baseline ( p =0.02) and in differences between baseline and follow-up tests ( p =0.006) (Table 5).
DISCUSSION
The aim of this study was to investigate whether cognitive decline during aging is less severe in persons with larger head circumferences among non-demented community dwelling elderly. There was no evidence of a more rapid decline of K- MMSE in the smaller head circumference group. People with larger head circumferences showed lower depressive scores at
baseline. However, they showed a rapid worsening of depres- sive symptoms during the 3-year interval between measure- ments. Head circumference did not affect K-MMSE scores, but GDS-S scores seemed to be affected in the female group.
Smaller head size has been known to be associated with the prevalence [26] and incidence of dementia [27], as well as with age at onset [28], severity [29], and progression [30] of Alzheimer’s disease, and with lower cognitive function in non- demented older populations [9,31]. People with larger brains and better cognitive reserves may learn easier than people with smaller brains and less cognitive reserves. However, not all studies have found associations between head size and de- mentia [32,33].
Measuring brain volume by neuroimaging methods is costly
and complex. Head circumference is a reliable surrogate mar-
ker of brain volume; easy to check and with good correlation
to intracranial volume [34,35]. Therefore, head circumference
can be used as a marker for brain volume.
Table 5. Regression coefficients between head circumference and scores of K-MMSE, K-IADL, CDR-G, CDR-SB, and GDS-S (among total participants, n=279)
Scoring system Crude model Adjusted model
a)β p -value β p -value K-MMSE
Baseline [a] 0.38 0.002 -0.06 0.61 3-year follow-up [b] 0.37 0.005 0.04 0.67 Difference [a]-[b] 0.01 0.87 -0.10 0.30 K-IADL
Baseline [a] 0.001 0.73 0.003 0.41 3-year follow-up [b] -0.005 0.67 0.003 0.77 Difference [a]-[b] 0.006 0.57 0.0006 0.96 CDR-G
Baseline [a] -0.004 0.55 -0.0008 0.90 3-year follow-up [b] -0.006 0.49 0.001 0.88 Difference [a]-[b] 0.001 0.88 -0.002 0.85 CDR-SB
Baseline [a] 0.004 0.81 0.01 0.56 3-year follow-up [b] -0.008 0.74 0.02 0.52 Difference [a]-[b] 0.01 0.65 -0.007 0.84 GDS-S
Baseline [a] -0.37 0.002 -0.27 0.02 3-year follow-up [b] -0.009 0.94 0.06 0.65 Difference [a]-[b] -0.34 0.002 -0.32 0.006 K-MMSE, Korean version of mini-mental status examination;
K-IADL, Korean version of Instrumental activities of daily living;
CDR-G, clinical dementia rating-global; CDR-SB, clinical demen- tia rating-sum of boxes; GDS, geriatric depression scale-short form.
a)