The intertidal zone is classified as two distinct environments, mudflat and sand beach. Intertidal mudflat is known to have very consistent morphology with weak external forcing from waves. Sand beach experiences more dynamic changes by wave forcing and its induced currents. Both environment tries to reach an equilibrium state but some artificial activities nearby cause drastic change of environmental factors
and bring about severe topographical changes even in the intertidal mudflat. Intertidal area has not been concerned much compared to other coastal region such as normal beach and esturies, and tidal effects with wave forcings to the intertidal beach and mudflat also have received comparatively little attention.
Recently, coastal zone is thought to be another valuable land to be developed and intertidal areas are also experiencing strong pressure of abandoning its native characteristics. A wide area of mudflats suffer
Comparisons of the Environmental Characteristics of Intertidal Beach and Mudflat
Taerim Kim
†
Department of Coastal Construction Engineering, Kunsan University, Kunsan, Korea
Abstract : The characteristics of morphological shapes, wave heights, tidal ranges and sediment sizes are observed and compared between intertidal beach and mudflat. The Mohang sand beach, southwest coast of Korea, is located just next to the large mudflat and has tidal range over 5 meters. Wave measurements are conducted at each entrance of the beach and mudflat as well as at the outside waters representing the incident waves to these different coastal environments. The morphological characteristics are also examined including the sediment size and the slope of the bathymetry. For the observation of morphological shapes, camera monitoring technique is used to measure the spatial information of intertidal bathymetry. The water lines moving on the intertidal flat/beach during a flood indicate depth contours between low and high water lines. The water lines extracted from the consecutive images are rectified to get the ground coordinates of each depth contours and integrated to provide three dimensional information of intertidal topography. The wave data show that sand beach is in the condition of severer wave forcing but tidal range is almost identical in both environment. The slope of the mudflat is much milder than the sand beach with finer sediment.
Key Words : Intertidal Beach, Mudflat, Bathymetry, Images, Camera monitoring, Waves, Tides, Sediment.
Received June 2, 2009; Revised June 24, 2009; Accepted July 1, 2009.
from rapid changes of topography provoked by man- initiated coastal developments such as large scaled reclamation projects or construction of embankment around ports. Insufficient understanding of the characteristics of intertidal zone cause serious irreparable environmental damages after construction project. In order to avoid these side effects, characteristics of sediment transport mechanism and morphological response to the artificial interruption should be carefully studied, but there are still a lot of uncertainties on the sediment transport both in the field of sand and mud. Some mechanisms which are not clearly investigated are just replaced with coefficients locally calibrated by field and lab experiments. More extensive research are needed including wave and current forcings and its response.
In addition to this, observation of the topography changes is important to access countermeasures to the environmental damages and remedies against the change/loss of the flats in the coastal area.
Wright et al.(1982) carried out intensive field investigation in a marcrotidal beach including hydrodynamics and morphological changes, and studied the tidal and wave forcings to the beach, and temporal and spatial variations of profiles. O’Brien etal.(2000) showed that mudflat morphology changes episodically and periodically on decadal, seasonal, spring-neap and tidal time scales based on long and short term field observations. Morphological development under different hydrodynamic conditions on a tidal flat in the Dutch Wadden Sea is studied by Bright(2000) and the relationships between mudflat profiles and external forces such as tidal range, sediment supply and wave conditions are established by Roberts et al.(2000). Whitehouse etal.(2000) showed that bedforms on intertidal mudflats can influence sediment transport as well as hydrodynamic conditions. Owing to the recent development of instruments and techniques, more
extensive and accurate measurements become possible. This study compares the characteristics of intertidal beach and mudflats using camera monitoring technique and other measurements of waves, tides and sediment sizes.
The study site is the Mohang sand beach and its adjoining mudflat, coastal area of Byunsan Peninsular, southwest coast of Korea (Fig. 1). The intertidal sand beach and mudflat are located in closely adjoining area but have been preserving their original characteristics (Fig. 1). The examination of the characteristics of both environment will provide information for understanding dynamics of sediment transport and morphological changes in the intertidal mudflat and sand beach. Specially, the site has a mountain just next to the shore and owns very good view for camera monitoring, which can be mainly applied for longterm remotely unmanned observation of intertidal morphological changes.
2. Method and Results
The characteristics of intertidal sand beach and mudflat were examined by bottom topography, sediment size, time series of tidal elevation and significant wave height and spectrum during a period Fig. 1. Location map of study site and a photo of Mohang
sand beach and its adjoining mudflat.
(3)
from 10
th
September to 8
th
October in 2006.
1) Bottom Topography
The intertidal topography of mudflat and sand beach is very different in shape and in slope.
Normally intertidal sand beach is smaller size and steeper slope compared to the mudflat. However, obtaining topographic data of intertidal zone is not a easy task. Employment of ship measurement using echo sounder is hindered by continuous changes of water level by tide and wave motions in the shallow water and it is almost impossible to survey inside surf zone. Ground survey using total station during an ebb tide is also limited by working hours and walking.
Specially, the mild slope of tidal mudflats and the wide area make it difficult to measure the bottom topography, and the mud bottom is dangerous place to survey. Because of these reasons, traditional in-situ measurements on the tidal flats were done only at the small number of fixed points or lines, and had difficulties to figure out the quantitative characteristics of the wide region. Especially, considering a very little morphological changes of mudflat, new observation technique for the wide area of tidal flats with high precision is needed. The advancement of digital imaging technique makes it possible to use a camera for monitoring many kinds of natural phenomena. They are also applied to the measurements of nearshore processes and morphological features including the measurement of nearshore fluid processes, sand bar length scales, foreshore topography, and drifter motions (Holand etal., 1997). Nathaniel and Holman (1997) presented that depth contours within the relatively narrow swash zone can be constructed by extracting the water lines from a time series of consecutive geo- referenced images during a tidal period. This method was also used for mapping intertidal beach bathymetry and validated by comparing with DGPS
survey results (Aarninkhof et al, 2003). Bradley et al.
(2001) used advanced video monitoring technique to measure the spatial and temporal evolution of the inlet morphology to forcing by waves and tides.
Aagaard et al. (2005) studied the processes for sediment transport and morphological changes in the intertidal zone of natural beach by executing video camera monitoring with in-situ measurements.
In this paper, to obtain topographic data from intertidal mudflat and sand beach, camera monitoring system was executed. The water lines moving on the intertidal flat during a flood indicate depth contours between low and high water lines. The water lines extracted from the consecutive images are rectified to get the ground coordinates of each depth contours using the equations (1) and (2) below and integrated to provide three dimensional information of intertidal flat topography
X
_
X
L
= (Z
_
Z
L
) (1)
Y
_
Y
L
= (Z
_
Z
L
) (2)
in which (x, y) are the image space coordinates, (X, Y,Z) are ground coordinates, (X
L
, Y
L
, Z
L
) are the camera station or exposure station coordinates, f is focallength, and M is a 3×3 matrix containing the rotation parameters: w about X-axis, f about once-rotated Y- axis, k about the twice-rotated Z-axis (Mikhail and Bethel, 2001). Since we know image space coordinates (x, y) and elevation (Z) of each waterlines, the two equations having two unknowns, (X, Y),can be calculated exactly. The matrix M and the focallength f are decided by the relationships of ground control points between fields and images, and elevations (Z) of waterlines in each image are measured at the field using total station. Two digital cameras (Olympus Camedia C-5050 Zoom) with 5 million pixels are used for this experiment. The
m
21
x + m
22
y + m
23
(
_
f)
m
31
x + m
32
y + m
33
(
_
f)
m
11
x + m
12
y + m
13
(
_
f)
m
31
x + m
32
y + m
33
(
_
f)
(4)
detailed explanation of the method and accuracy are well explained in the study of Kim and Park(2006).
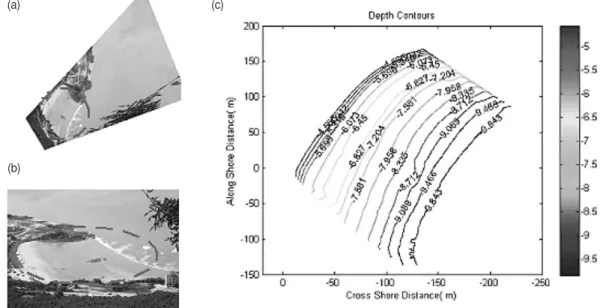
Fig. 2 and Fig. 3 show the bathymetry contours and one of the images used for the depth calculation and
its rectified image. The dashed ellipses indicate the depth contour portion in the photo. Overall, the average slope of the sand beach and mudflat are 0.022 and 0.0086, respectively. The sand beach
Fig. 3. (a) The rectified image of the Mohang mudflat. (b) The oblique image of the Mohang mudflat. (c) Depth contours calculated from the consecutive images taken during a flood. The dashed ellipses are the locations where depths are calculated.
(a) (c)
(b)
Fig. 2. (a) The rectified image of the Mohang sand beach. (b) The oblique image of the Mohang beach. (c) Depth contours calculated from the consecutive images taken during a flood. The dashed ellipses are the locations where depths are calculated.
(a) (c)
(b)
(5)
shows relatively regular contour lines and shapes but the mudflat is irregular and center part is deeper than the boundary area.
2) Sediment Size
Surface sediments taken from the sites of the intertidal flat are analyzed by sieving and by laser scattering particle size analyzer, respectively. The dominant sand size of the Mohang beach is 0.425 mm ~ 0.075 mm and the mudflat dominantly has very fine silt between 20 mm and 400 mm.
3) Tide and Wave
Tide and wave measurements were conducted simultaneously at the entrance of the sand beach and mudflat, from 10
th
September to 8
th
October in 2006.
The pressure gauges were specially designed for shallow water employment with higher accuracy. The sensor measures the water pressure every 30 minutes and wave spectrum is calculated at the same time.
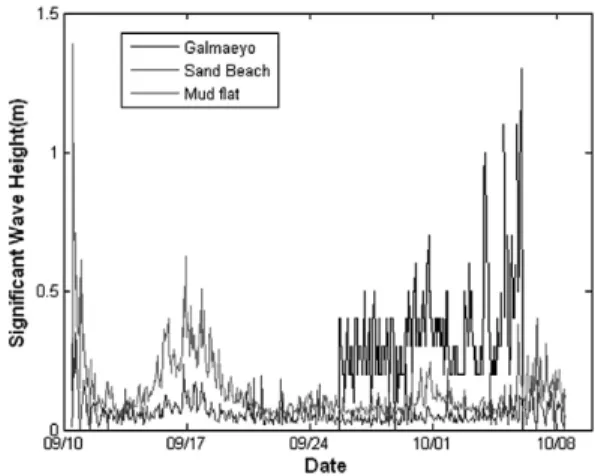
Fig. 4 shows time series variation of semidiurnal tidal range varying from 2 m at neap to 6.8 m at spring with a mean of about 4.1 m. At both entrance sites, the tidal range and phase are almost same and difficult to find the differences. However, considering different slopes and bottom shape of two intertidal environments, the current velocity and fluxes might be very different at each flat. For wave data analysis, wave measurement data outside the nearshore region(Galmaeyo) were examined, too. This wave measurement was done by Korea Meteorological Administration(KMA) and it represents the incident waves to both study sites. Fig. 5 shows time series of significant wave height variation. It is very clear that the incident wave dramatically weaken as they approach to the shore although the first part data are not shown from malfunctioning of the gauge.
Specially the wave approaching to the mudflat is lower than the ones to the sand beach. This is because
Fig. 4. Time series of tidal elevations over a period from 10
th
September to 8
th
October, 2006.
Fig. 5. Time series of wave heights over a period from 10
th
September to 8
th
October, 2006.
Fig. 6. Time series of wave spectrum over a period from 10
th
September to 8
th
October, 2006.
(6)
of the location of mudflat at the sheltering area from waves. Fig. 6 exhibits transition of wave spectrum at both area. Like significant wave heights, more wave energy is found on the sand beach concentrated on the frequency from 0.1 to 0.3 Hz. However, the wave energy on the mudflat appears to be confined within narrow band of frequency about 0.1 Hz.
3. Conclusions and further study
The physical environmental characteristics of the sand beach and mudflat are examined by in-situ measurements at the Mohang sand beach and its adjoining mudflat. The slope of the sand beach is about three times steeper than the mudflat based on the bathymetry calculated from the intertidal camera monitoring system. The sediment in the beach is fine sand but the sediment in the mudflat is very fine silt close to clay. The time series of tidal elevation at both entrances show almost identical tidal range variation.
However, wave condition is very different. In harsh wave condition, the significant wave heights at the sand beach are more than two times higher than the ones on the mudflat. It seems that wave forcing is the main forcing which differentiate the characteristics of two environment, owing to the location of the mudflat at the sheltering area from waves.
For further study, two points are suggested. The camera monitoring system to observe the intertidal bathymetry using the movement of water lines during a flood is good to monitor morphological changes of mudflat as well as sand beach. Long-term monitoring along with wave measurement will provide seasonal or longterm evolving information and response to the external forcing. The second point is to utilize the numerical model including wave, current and sediment transport to understand the mechanisms of spatial wave variation and morphological changes.
The in-situ measurement data can be used for validating the model results as well as for input data for the numerical model.
Acknowledgement
This work was supported by the Korea Research Foundation Grant funded by the Korean Government(MOEHRD) (KRF-2006-311-D00894 ).
References
Aagaard T., A. Kroon, S. Andersen, R. M. Sorensen, S. Quartel, and N. Vinther, 2005. Intertidal beach change during storm conditions;
Egmond, The Netherlands, Marine Geology, 218: 65-80.
Aarninkhof, S., I. L. Turner, T. D. T. Dronkers, C.
Mark, and N. Leann, 2003. A video-based technique for mapping intertidal beach bathymetry. Coastal Engineering, 49: 275- 289.
Bradley D. M., A. D. Mark, and A. H. David, 2001.
Measurements of the response of a coastal inlet using video monitoring techniques, Marine Geology, 175: 251-272.
Bright Janssen-Stelder, 2000. The effect of different hydrodynamics conditions on the morphodynamics of a tidal mudflat in the Dutch Wadden Sea. Continental ShelfResearch, 20: 1461-1478.
Holand K. T., R. A. Holman, T. C. Lippmann, J.
Stanley, and P. Nathaniel, 1997. Practical use of video imagery in nearshore oceanographic field studies. IEEE Journal of OceanicEngineering, 22: 81-92.
Mikhail E. M. and J. S. Bethel, 2001. Intorduction to
(7)
modern photogrammetry. New York, John Wiley & Sons, Inc., 93p.
Nathaniel G. P. and R. A. Holman, 1997. Intertidal beach profile estimation using video images.
Marine Geology, 140: 1-24.
O’Brien, D. J., R. J. S. Whitehouse, and A. Cramp, 2000. The cyclic development of a macrotidal mudflat on varying time scales. ContinentalShelf Research, 20: 1593-1619.
Roberts W., P. H. Le, and R. J. S. Whitehouse, 2000.
Investigation using simple mathematical models of the effect of tidal currents and wave son the profile shape of intertidal mudflats. Continental Shelf Research, 20:
1079-1097.
Kim T. and S. Park, 2006. Study on Intertidal flat topography observation using camera images.
Journal of the Korean Society of Oceanogrphy, 11(4): 145-151.
Wright, L. D., P. Nielsen, A. D. Short, and M. O.
Green, 1982. Morphodynamics of a macrotidal beach. Marine Geology, 50: 97- 128.
Whitehouse R. J. S., P. Bassoullet, K. R. Dyer, H. J.