ISSN 2287-8130(Online) Particle and Aerosol Research
Part. Aerosol Res. Vol. 12, No. 4: December 2016 pp. 145-150 http://dx.doi.org/10.11629/jpaar.2016.12.31.145
Chemical mechanical planarization 슬러리에 사용되는 point-of-use 필터의 평가 방법 개발
장 선 재1)⋅아툴 쿨르카르니1)⋅김 형 우2)⋅김 태 성1)2)*
1)
성균관대학교 기계공학부,
2)성균나노과학기술원
(2016년 11월 13일 투고, 2016년 12월 26일 수정, 2016년 12월 27일 게재확정)
Development of point-of-use filter evaluation method using chemical mechanical planarization slurry
Sunjae Jang
1), Atul Kulkarni
1), Hyeong-U Kim
2), and Taesung Kim
1),2),a1)
School of Mechanical Engineering, Sungkyunkwan University
2)
SKKU Advanced Institute of Nano Technology (SAINT), Sungkyunkwan University
Abstract
During the chemical mechanical planarization (CMP) process, slurry that comprises abrasive particles can directly affect the CMP performance and quality. Mainly, the large particles in the slurry can generate the defects on the wafer. Thus, many kinds of filters have been used in the CMP process to remove unwanted over-sized particles.
Among these filters, the point-of-use (POU) filter is used just before the slurry is supplied onto the CMP pad. In the CMP research field, analysis of the POU filter has been relatively exceptional, and previous studies have not focused on the standardized filtration efficiency (FE) or filter performance. Furthermore, conventional evaluation methods of filter performance are not appropriate for POU filters, as the POU filter is not a membrane type, but is instead a depth type roll filter. In order to accurately evaluate the POU filter, slurry FE according to particle size was measured in this study. Additionally, a CMP experiment was conducted with filtered slurry to demonstrate the effects of filtered slurry on CMP performance. Depending on the flow rate and the filter retention size, the FE according to particle size was different. When the small and large particles have different FEs, the total filtration efficiency (TFE) can still have a similar value. For this reason, there is a need to measure the FE with respect to the particle size to verify the effects of the POU filter on the CMP process.
Keywords:POU filter, Chemical mechanical polishing (CMP), Slurry, filtration efficiency(FE)
* Corresponding author.
Tel:+82-31-299-7466
E-mail:[email protected]
146
장선재⋅아툴 쿨르카르니⋅김형우⋅김태성
1. Introduction
The chemical mechanical planarization (CMP) process is an important and often-used process in semiconductor manufacturing. The CMP process can planarize wafer surfaces due to mechanical and chemical aspects, and various consumables such as pads, slurry, conditioners and filters are used for effective planarization (Suryadevara Babu, 2016).
Among those consumables, abrasive particles of slurry directly affects the polishing performance. When the slurry was applied in the CMP process, the existence of particles larger than that required for the process may cause scratches and defects on the wafer (Komanduri, R., Lucca, D.A., and Tani, Y, 1997). The wiring short and disconnection in semiconductor device were precipitated by scratches and defects, and wiring short and disconnection declines yields (Parshuram B.
Zantye, 2005). Thus, various filters are used during the CMP process to remove any unnecessary large particles (M.R. Chang et al, 2006; L. C. Juang et al, 2008; R. Lo and S.-L. Lo, 2004). The point-of-use (POU) filter is used just before the slurry is fed into the process (S-Y. Kim et al, 2002). There have been a few studies that evaluated the filtration efficiency (FE) by comparing the filter performance according to retention size (C. B. Kim et al, 2001) and the slurry flow rate (S-Y. Kim et al, 2002), and CMP experiments were carried out using filtered slurry in order to assess the filtration effect on CMP performance (Y.J. Seo et al, 2004). In addition, we have also studied the FE of the POU filter using the total filtration efficiency (TFE) (S. Jang et al, 2013).
TFE refers to the efficiency due to the difference in the total number of particles before and after filter filtration. However, there exist no measurements of the
standardized FE and filter performance. Using the conventional measurement methods, it is difficult to directly evaluate the particle removal efficiency of the filter according to particle size. The retention size and pore size of the POU filter is different from membrane filters, and for this reason, evaluation of the FE according to particle size is difficult in the POU filter (S. Jang et al, 2013). Thus, it is necessary to find an accurate evaluation method that can verify if working particles pass through the filter and if large particles are filtered. In this study, slurry FE with respect to particle size was measured by scanning mobility particle sizer (SMPS), and the effects of filtered and unfiltered slurry on CMP performance were evaluated by measuring the removal rate (RR) and the coefficient of friction (COF).
2. Materials and methods
In this study, we developed a filtration system in which the slurry is circulated. A schematic of the filtration system is depicted in fig. 1. The inlet and outlet valves were installed in front of and behind the filter, respectively. The slurry chamber can hold up to 40 L, the chamber frame was made of steel use stainless, and the inner wall was coated with Teflon.
The tube used in this system was made of Teflon and the tube diameter is 1/2 inch. Additionally, a magnetic centrifugal pump that can supply flow without fluctuation was installed. The POU filter used in this study structure is a depth type roll filter, which is made of polypropylene. It has sheet composed of a number of fibers (fiber thickness is not perfectly uniform, but it tends to be thinner toward the inside), rolled sheet constitute a filter media. Commercial ceria
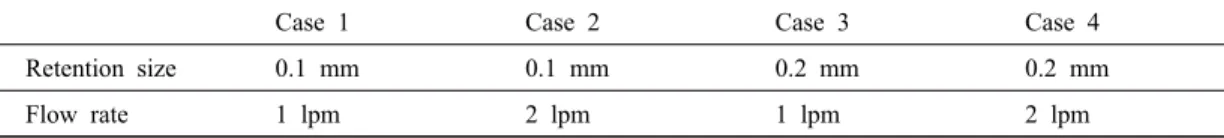
Case 1 Case 2 Case 3 Case 4
Retention size 0.1 mm 0.1 mm 0.2 mm 0.2 mm
Flow rate 1 lpm 2 lpm 1 lpm 2 lpm
Table 1. Details of experimental cases used in this study
slurry was used in this experiment, which has a wide particle size distribution (PSD) and bimodal (30 and 100 nm) distribution, particle shape is peanut type (non-spherical). The filtration experiment was conducted over a span of 8 hours, and slurry was sampled every two hours. Slurry was diluted to a slurry : DI water ratio of 1 : 3. The experimental case conditions are as follows table 1. Two types of filter retention size and two flow rates are used in the experiment. The SMPS used to measure the slurry PSD before and after filtration in order to evaluate the FE according to particle size. The SMPS used in the experiment consist of neutralizer (Am-241, aerosol neutralizer, GRIMM, Germany), differential mobility analyzer (DMA, DMA 3081, TSI instrument, USA), condensation particle counter (CPC, ultrafine CPC 3776, TSI instrument, USA) and classifier (electrostatic classifier 3080, TSI instrument, USA). Because the slurry has a wide PSD, SMPS is more suitable for taking measurements than other types of equipment (S. Jang et al, 2016; H. Kim
et al, 2010; J. C. Yang et al, 2010). Polishing experiments were conducted before and 8 hour filtration slurry to evaluate the effect of filtration on the polishing performance. The polishing instrument used in this experiment was a 4 inch polisher (CP-4, Bruker, USA), which can measure the COF between the wafer and pad. A 4 inch silicon oxide wafer (thickness of 2000 Å) was used in this experiment.
The polishing time was 60 s, the slurry flow rate was
60 ml/min, the pad table rotation speed was 98 rpm,
the wafer head rotation speed was 87 rpm, and the
wafer head pressure was 3 psi. Before the polishing
experiment, pad pre-conditioning was performed with
DI water for 30 min. In between polishing experiments
for the same sample, pad conditioning was performed
with slurry for 1 minute. Additionally, when the
polishing sample was changed, pad conditioning was
performed with DI water for 3 min. Before and after
the polishing experiments, wafer thickness was
measured using a reflectometer (ST-5030-SL, K-MAC,
Figure 1. Schematic of filter evaluation system
148
장선재⋅아툴 쿨르카르니⋅김형우⋅김태성
Korea) in order to calculate the RR. RR is the thickness of the wafer to be removed per minute.
Since the experiment was conducted for one minute in this experiment, the RR value was calculated by subtracting the wafer thickness after polishing from the wafer thickness before polishing.
3. Results and Discussion
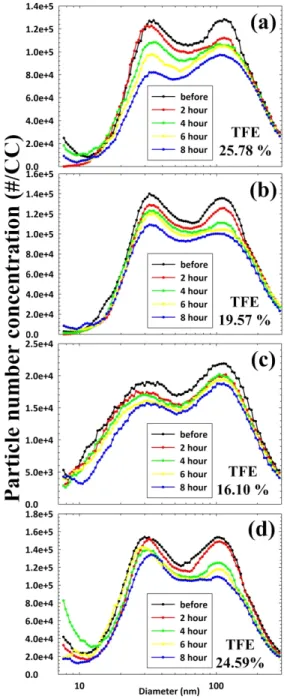
Figure 2 shows the slurry PSD and TFE of the cases before and after filtration. When the slurry flow rate was the same, the 0.1 mm filter had an FE higher than that of the 0.2 mm filter. As the filter retention size is small, it can remove more particles than the filter with a large retention size. Furthermore, for the 2 lpm conditions, the large particle FE was higher than that for the 1 lpm conditions with the same retention size. When the slurry flow rate increases, the inertial force increases; this is why large particles do not closely follow the stream line. Similarly, when the slurry flow rate decreases, the inertial force decreases, which is why small particles can move more freely in the stream line. Hence, as the flow rate decreases, more small particles were removed. Because small particles have a higher chance to impact or attach to the fiber (due to Brownian motion, electrostatic interaction, hydrodynamic interaction, etc. (W. C.
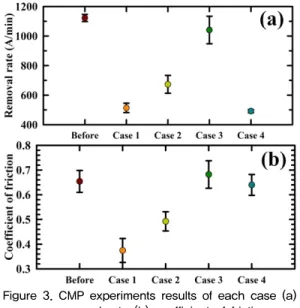
Hinds, 1999; R. F. Probestein, 2003). The difference in large particle FE between condition (c) and (d) was larger than between condition (a) and (b). It seems that differences of large particle FE due to flow rate changes not a changes of filter retention size. Figure 3 shows the RR and COF of the cases. We measured RR at 9 points on the wafer surface in the radial direction, and the average of these 9 points is shown in the figure. The case 1 to 4 are filtration slurry for conditions (a) to (d) defined in fig. 2, derived after 8 hour of processing. In the case 4 the RR was at its lowest because a lot of large particles were removed.
When the large particle FE was high, the RR was small; on the other hand, when the large particle FE
was small, the RR was high. In the cases 1 and 4, the TFE was different, but the large particle FE was almost the same. For this reason, the RR in both cases was similar.
Figure 2. Particle size distribution graph of each
case (a) case 1 (b) case 2 (c) case 3
(d) case 4
Figure 3. CMP experiments results of each case (a) removal rate (b) coefficient of friction
In previous research, TFE was used to evaluate the POU filter performance (S. Jang et al, 2013). However, precise filter performance could not be confirmed using only TFE, according to previous experiment results. It is only possible to accurately measure the factors that affect polishing by considering FE (as opposed to TFE) with respect to particle size. In the case 1, when the small particle FE was high, the COF was smallest.
In the case 2, when the small particle FE was at an intermediate value, so was the COF. For the cases 3 and 4, when the small particle FE was small, the COF was the highest. From these results, we can make a conjecture regarding the effects of small particle FE on COF. However, we need more experimental data with small particles to confirm the relationship between the COF and small particles.
4. Conclusion
In conclusion, when the flow rate increased, more large particles were removed; this is because large particles (100 nm) are significantly influenced by mechanical processes (e.g., sedimentation, inertial impaction and interception) relative to small particles
(30 nm). Similarly, small particles (30 nm) move more freely because small particles are not significantly influenced by the inertial force relative to large particles (100 nm). When using a small retention and low flow rate, freely moving small particles have more opportunities to impact or attach to the fiber (W. C.
Hinds, 1999; R. F. Probestein, 2003). From this, we conclude that the removal of small particles is significantly affected by electrochemical processes (e.g., the hydrodynamic effect, Brownian motion, and diffusion). When the large particle FE is high, the RR is low. On the other hand, when the large particle FE is low, the RR is high. When the large particle FE has similar value, the RR also has similar trends. This indicates that the concentration of large particles is a key factor in determining RR. Thus, only measuring TFE is not enough to confirm the effects of filtration efficiency on CMP performance when considering the POU filter. As small particles and large particles can have different effects on the CMP performance, measuring the FE according to particle size is necessary for understanding exactly how the CMP performance is affected. Thus, the SMPS, which can precisely measure the PSD, is recommended for use in filtration experiments as opposed to light scattering equipment.
Reference
C. B. Kim, S-Y. Kim and Y-J. Seo, (2001), Proceedings of 2001 International Symposium on Electrical Insulating Materials (ISEIM 2001), p91-94.
H. Kim, J. C. Yang and T. Kim, (2010), Measurement of CMP Slurry Abrasive Size Distribution by Scanning Mobility Particle Sizer, Electrochem.
Solid. St., 13, H137-H140
J. C. Yang, H. Kim and T. Kim, (2010), Study of Polishing Characteristics of Monodisperse Ceria Abrasive in Chemical Mechanical Planarization, J.
Electrochem. Soc., 157, H235-H240.
150