D I A B E T E S & M E T A B O L I S M J O U R N A L D I A B E T E S & M E T A B O L I S M J O U R N A L
This is an Open Access article distributed under the terms of the Creative Commons Attribution Non-Commercial License (http://creativecommons.org/licenses/by-nc/4.0/) which permits unrestricted non-commercial use, distribution, and reproduction in any medium, provided the original work is properly cited.
Association between Higher Blood Pressure and Risk of Diabetes Mellitus in Middle-Aged and Elderly
Chinese Adults
Xue Yang1, Jian Chen2, An Pan3, Jason H.Y. Wu4, Fei Zhao1, Yue Xie1, Yi Wang3, Yi Ye3, Xiong-Fei Pan3,4, Chun-Xia Yang1
1Department of Epidemiology and Biostatistics, West China School of Public Health and West China Fourth Hospital, Sichuan University, Chengdu,
2Department of Epidemiology and Biostatistics, School of Public Health, Chengdu Medical College, Chengdu,
3 Department of Epidemiology and Biostatistics, Ministry of Education Key Laboratory of Environment and Health and State Key Laboratory of Environmental Health (Incubation), School of Public Health, Tongji Medical College, Huazhong University of Science and Technology, Wuhan, China,
4The George Institute for Global Health, University of New South Wales, Sydney, Australia
Background: To examine the prospective association between higher blood pressure (BP) and risk of type 2 diabetes mellitus (T2DM) in middle-aged and elderly Chinese adults.
Methods: A total of 9,642 middle-aged and elderly Chinese adults (≥45 years old; 47.30% men) without diabetes from the China Health and Retirement Longitudinal Study were included for analyses. Participants were categorized into three groups: normal BP, prehypertension, and hypertension, according to the 2010 Chinese Guidelines for the Management of Hypertension. The in- cidence of T2DM was determined by self-reported physician diagnosis during two follow-up surveys conducted in 2013 to 2014 and 2015 to 2016.
Results: During the 4-year follow-up, 429 participants (4.45%) developed T2DM, including 3.51% of the men and 5.29% of the women. The incidence rates of T2DM were 2.57%, 3.75%, and 6.71% in the normal BP, prehypertension, and hypertension groups, respectively. After adjustment for age, sex, education level, residence, smoking status, alcohol consumption, body mass index, waist circumference, and dyslipidemia, both prehypertension (odds ratio [OR], 1.32; 95% confidence interval [CI], 0.98 to 1.77) and hypertension (OR, 2.02; 95% CI, 1.54 to 2.64) were associated with increased risk of T2DM, compared to those with a normal BP. The ORs associated with T2DM were 1.08 (95% CI, 1.03 to 1.13) for an increase of 10 mm Hg in systolic BP and 1.06 (95% CI, 1.01 to 1.10) for an increase of 5 mm Hg in diastolic BP.
Conclusion: Higher BP is a risk factor for T2DM in middle-aged and elderly Chines. It may be a potential target for diabetes pre- vention.
Keywords: Blood pressure; China; Diabetes mellitus; Hypertension
Corresponding authors: Chun-Xia Yang https://orcid.org/0000-0002-8548-2381 Department of Epidemiology and Biostatistics, West China School of Public Health and West China Fourth Hospital, Sichuan University, 3-17 Renmin Nanlu, Chengdu 610041, China
E-mail: [email protected]
Xiong-Fei Pan https://orcid.org/0000-0002-9350-9230
Department of Epidemiology and Biostatistics, Ministry of Education Key Laboratory of Environment and Health and State Key Laboratory of Environmental Health (Incubation), School of Public Health, Tongji Medical College, Huazhong University of Science and Technology, 3 Hangkong Rd, Wuhan 430030, China
INTRODUCTION
Diabetes is a leading noncommunicable disease throughout
the world. Over 425 million adults aged 20 to 79 years old (8.8% of the population) had type 2 diabetes mellitus (T2DM) worldwide in 2017, and the prevalence of diabetes is expected https://doi.org/10.4093/dmj.2019.0081
pISSN 2233-6079 · eISSN 2233-6087
to increase to 693 million people by 2045 [1]. In China, the prevalence of T2DM was 6.6% of the population (about 90 million people) in 2016 [2]. Another national survey also showed that about 35.7% of Chinese adults had prediabetes in 2013 [3]. Thus, it is important to identify modifiable risk fac- tors and early interventions to prevent the development of dia- betes.
Evidence for a link between higher blood pressure (BP) and T2DM has been reported. A systematic review in 2015 includ- ing 4.1 million adults from 31 studies showed that 20 mm Hg higher systolic BP and 10 mm Hg higher diastolic BP were as- sociated with a substantially elevated risk for T2DM [4]. How- ever, there was remarkable variability in the magnitude of the association between studies in different populations, and none of the 31 studies was conducted in a Chinese population. Two recent large studies on this topic in China examined diabetes risk associated with a certain increase of BP, but they did not further delineate the impacts of prehypertension and hyper- tension on the risk of diabetes [5,6]. Thus, we hypothesize that a higher BP, including clinically relevant prehypertension and hypertension, could be a risk factor for the incidence of T2DM in Chinese adults. Given the increasing burden of diabetes and hypertension in China, it is necessary to examine their associa- tion in a large population-based cohort.
The China Health and Retirement Longitudinal Study (CHARLS) is a large ongoing multicenter longitudinal study including 17,708 middle-aged and elderly adults in China [7].
With complete biomarker measurements at baseline and re- peated questionnaire surveys, it is a major source to explore determinants of noncommunicable diseases among Chinese adults. We utilized data from CHARLS to examine the associa- tion between the baseline BP and the risk of T2DM in Chinese adults aged 45 years and older in a comprehensive manner. In addition, we assessed the heterogeneity of their associations in different subgroups to identify particular high-risk groups.
METHODS
Study design
CHARLS is conducted by the China Center for Economic Re- search at Peking University. The design and methodology of CHARLS have been reported previously [7]. Briefly, it selected individual participants aged 45 years and older and their spouses through a multistage probability sampling procedure.
A total of 17,708 participants (10,069 main respondents and
7,639 spouses) in 450 communities from 150 counties, encom- passing 28 of the 32 provinces in China, were enrolled at base- line between June 2011 and March 2012, and followed up every 2 years. CHARLS was approved by the Biomedical Ethics Re- view Committee of Peking University (IRB00001052-11015), and informed consent was obtained from all participants [7].
Baseline data collection
Study participants were surveyed at baseline by trained inter- viewers on demographic and socioeconomic information, health status and functioning (such as self-reported general health and diagnosed chronic diseases), and lifestyle and be- haviors (such as smoking, drinking, and physical activity) us- ing a face-to-face computer-assisted personal interview. An- thropometric measurements such as height, weight, and waist circumference as well as physical performance measurements were obtained using standard devices, according prespecified protocols. Trained staff measured resting systolic and diastolic BP at the left brachial artery with an Omron HEM-7200 elec- tronic monitor (Omron, Tokyo, Japan) when the participants were in the seated position. The BP measurements were re- peated three times with a 45-second interval and were aver- aged for the final systolic and diastolic BP values. Blood sam- ples (8 mL) were collected for bioassays, including fasting blood glucose (FBG) and glycosylated hemoglobin (HbA1c), at the Youanmen Center for Clinical Laboratory of Capital Medical University.
Baseline T2DM was determined by self-reported physician di- agnosis and the FBG or HbA1c measurement (FBG ≥126 mg/dL or HbA1c ≥6.5%) [8]. Participants with baseline diabetes were excluded from our final analysis. Participants without diabetes were categorized as having prediabetes (100≤ FBG ≤125 mg/dL) or normal glucose tolerance (FBG <100 mg/dL) if they provid- ed blood samples for FBG measurements [9]. BP was classified according to the 2010 Chinese Guidelines for the Management of Hypertension: normal BP group (systolic BP <120 mm Hg and diastolic BP <80 mm Hg), prehypertension group (systolic BP
≥120 and <140 mm Hg or diastolic BP ≥80 and < 90 mm Hg), and hypertension group (systolic BP ≥140 mm Hg or diastolic BP ≥90 mm Hg) [10]. A self-reported physician diagnosis of hypertension at baseline was also regarded as prevalent hyper- tension. Dyslipidemia was defined as total cholesterol/high density lipoprotein cholesterol >5.0 [11] or self-reported dys- lipidemia to avoid the effect of lipid-lowering medication. Par- ticipants were regarded as having self-reported dyslipidemia if
they answered ‘yes’ to the following question. “Have you been diagnosed with dyslipidemia (elevation of low density lipopro- tein cholesterol, total triglycerides, and total cholesterol, or low high density lipoprotein cholesterol) by a doctor?”
Ascertainment of diabetes during follow-up
Study participants were followed up every 2 years through a face-to-face interview to assess the same measurements deter- mined at baseline. The two follow-up interviews were adminis- tered in 2013 to 2014 (n=15,788) and 2015 to 2016 (n=15,331).
Health outcomes such as diabetes, heart disease, hypertension, and stroke were collected in the two follow-up surveys. Blood samples were collected at every second follow-up in CHARLS, but the second blood sampling was not completed in the cur- rent follow-ups. Therefore, we determined the status of incident T2DM according to self-reported physician diagnosis of diabe- tes in either of the two follow-ups instead of using blood glu- cose measurements.
Statistical analysis
A total of 17,596 participants who were enrolled at baseline completed the two follow-up surveys. We excluded 2,066 par- ticipants with prevalent diabetes at baseline, including 63 who lacked information of diabetes, 2,394 without BP measure- ments, and 444 with incomplete data for major covariates in- cluding age, sex, education level, residence, smoking status, al- cohol consumption, body mass index (BMI), waist circumfer- ence, and dyslipidemia. We also excluded 2,987 participants who lacked information of diabetes in both follow-up surveys or who lacked information of diabetes in the second follow-up survey if no diabetes was reported in the first follow-up survey.
A total of 9,642 participants were included in the primary analyses. Continuous variables such as BMI, waist circumfer- ence, and BP were summarized as mean±standard deviation, while categorical variables such as sex and smoking status were summarized as absolute counts (percentages). Multivariable logistic regression analyses were applied to examine associa- tions between BP and T2DM. Odds ratios (ORs) and their 95%
confidence intervals (CIs) were estimated after adjustment for sex (male and female), age (continuous, year), and education level (illiterate, primary/middle school, and high school or above) in the first model, and additionally for residence (rural and urban), smoking status (never smoker, former smoker, and current smoker), alcohol consumption (never drinker and for- mer/current drinker), BMI (continuous, kg/m2), waist circum-
ference (continuous, cm), and dyslipidemia (yes and no) in the second model. All covariates were collected during the baseline survey in 2011 to 2012. We also performed stratified analyses by sex, age, residence, education level, BMI, smoking status, and alcohol consumption. In a sensitivity analysis, we restrict- ed our analyses in participants with baseline FBG, and sepa- rately examined the impact of higher BP on the risk of diabetes in participants with a normal FBG and those with prediabetes.
To minimize the impact of antihypertensive medications, we also conducted another sensitivity analysis by excluding par- ticipants who self-reported previously diagnosed hyperten- sion. Statistical analyses were done by Stata version 14.0 soft- ware (StataCorp., College Station, TX, USA). All P values were two-sided, and statistical significance was defined as P<0.05.
RESULTS
Baseline characteristics of study participants in CHARLS Of 9,642 participants without prevalent diabetes, the mean age at baseline was 58.8±9.2 years old. A total of 3,578 participants (37.11%) had hypertension, while 2,799 (29.03%) had prehy- pertension (Table 1). Compared with the participants who had a normal BP, those who had hypertension were more likely to be old, obese, and to have dyslipidemia, but they were less like- ly to be well educated. Systolic BP, diastolic BP, and waist cir- cumference also increased with categories of higher BP at baseline.
Association between higher BP and incident T2DM During the 4-year follow-up, 429 participants (4.45%) devel- oped diabetes mellitus, including 3.51% of the men and 5.29%
of the women. The incidence of diabetes was 2.57%, 3.75%, and 6.71% in the normal BP, prehypertension, and hyperten- sion groups, respectively (Table 2). Compared to participants with a normal BP, those with prehypertension (OR, 1.32; 95%
CI, 0.98 to 1.77) and hypertension (OR, 2.02; 95% CI, 1.54 to 2.64) were at higher risk for incident T2DM after adjustment for age, sex, education level, residence, smoking status, alcohol consumption, BMI, waist circumference, and dyslipidemia. A linear trend was noted for the association between BP and the risk of incident T2DM (P for trend <0.001). The ORs associat- ed with T2DM were 1.08 (95% CI, 1.03 to 1.13) per 10 mm Hg higher systolic BP and 1.06 (95% CI, 1.01 to 1.10) per 5 mm Hg higher diastolic BP (Table 2).
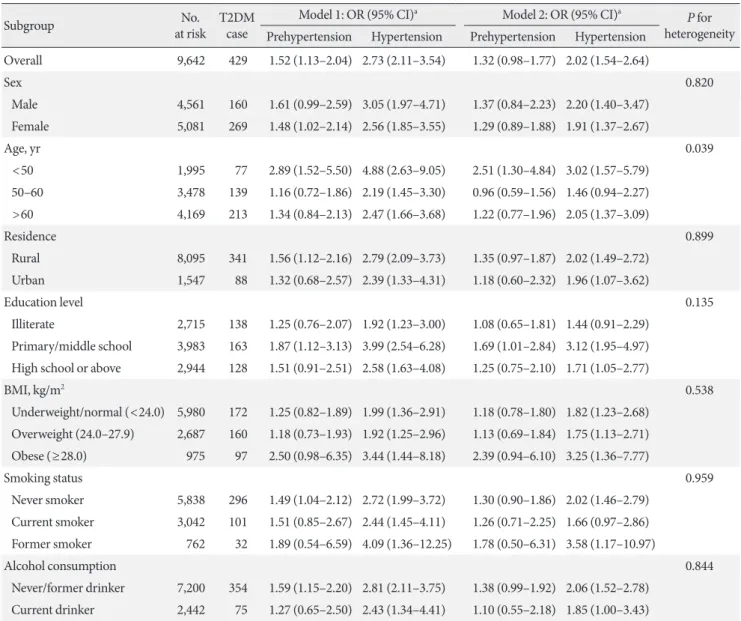
We did not observe any heterogeneity for the associations
between higher BP and incident diabetes in the subgroups stratified by sex, age, residence, education level, BMI, smoking status, or alcohol consumption (Table 3). Generally, there were increased odds of diabetes associated with both prehyperten-
sion and hypertension in all subgroups stratified. The associa- tion with diabetes was stronger in participants younger than 50 years old than the other age groups: OR of 2.51 (95% CI, 1.30 to 4.84) for prehypertension and OR of 3.02 (95% CI, 1.57 Table 1. Baseline characteristics of the CHARLS participants (n=9,642)
Characteristic Total Blood pressure group
P value Normal BP Prehypertension Hypertension
Total 9,642 (100.00) 3,265 (33.86) 2,799 (29.03) 3,578 (37.11)
Sex <0.001
Male 4,561 (47.30) 1,486 (45.51) 1,468 (52.45) 1,607 (44.91)
Female 5,081 (52.70) 1,779 (54.49) 1,331 (47.55) 1,971 (55.09)
Age, yr <0.001
<50 1,995 (20.69) 897 (27.47) 621 (22.19) 477 (13.33)
50–60 3,478 (36.07) 1,286 (39.39) 1,050 (37.51) 1,142 (31.92)
>60 4,169 (43.24) 1,082 (33.14) 1,128 (40.30) 1,959 (54.75)
Residence <0.001
Rural 8,095 (83.96) 2,807 (85.97) 2,340 (83.60) 2,948 (82.39)
Urban 1,547 (16.04) 458 (14.03) 459 (16.40) 630 (17.61)
Education level <0.001
Illiterate 2,715 (28.16) 831 (25.45) 740 (26.44) 1,144 (31.97)
Primary/middle school 3,983 (41.31) 1,370 (41.96) 1,141 (40.76) 1,472 (41.14) High school or above 2,944 (30.53) 1,064 (32.59) 918 (32.80) 962 (26.89)
Alcohol consumption 0.002
Never drinker 7,200 (74.67) 2,472 (75.71) 2,023 (72.28) 2,705 (75.60)
Former/current drinker 2,442 (25.33) 793 (24.29) 776 (27.72) 873 (24.40)
Smoking status <0.001
Never smoker 5,838 (60.55) 2,013 (61.65) 1,619 (57.84) 2,206 (61.65)
Former smoker 3,042 (31.55) 1,033 (31.64) 963 (34.41) 1,046 (29.23)
Current smoker 762 (7.90) 219 (6.71) 217 (7.75) 326 (9.11)
BMI, kg/m2 <0.001
Underweight (<18.5) 659 (6.83) 298 (9.13) 178 (6.36) 183 (5.11)
Normal (18.5–23.9) 5,321 (55.19) 2,096 (64.20) 1,573 (56.20) 1,652 (46.17) Overweight (24.0–27.9) 2,687 (27.87) 723 (22.14) 808 (28.87) 1,156 (32.31)
Obese (≥28.0) 975 (10.11) 148 (4.53) 240 (8.57) 587 (16.41)
Dyslipidemia <0.001
No 7,877 (81.69) 2,866 (87.78) 2,329 (83.21) 2,682 (74.96)
Yes 1,765 (18.31) 399 (12.22) 470 (16.79) 896 (25.04)
Waist circumference, cm 83.73±12.22 80.63±11.22 83.41±11.99 86.80±12.53 <0.001
Systolic BP, mm Hg 129.34±21.23 109.31±7.19 128.10±6.03 148.59±20.02 <0.001
Diastolic BP, mm Hg 75.45±12.11 65.47±7.08 76.07±7.12 84.07±12.00 <0.001
Values are presented as number (%) or mean±standard deviation.
CHARLS, China Health and Retirement Longitudinal Study; BP, blood pressure; BMI, body mass index.
Table 2. Association between higher BP and risk of incident T2DM in the CHARLS participants (n=9,642)
Group No. at risk T2DM case OR (95% CI)
P for trend
Model 1 Model 2
Overall 9,642 429 (4.45) <0.001
Normal BP 3,265 84 (2.57) 1 1
Prehypertension 2,799 105 (3.75) 1.52 (1.13–2.04) 1.32 (0.98–1.77)
Hypertension 3,578 240 (6.71) 2.73 (2.11–3.54) 2.02 (1.54–2.64)
Systolic BP (10 mm Hg) - - 1.12 (1.08–1.17) 1.08 (1.03–1.13) 0.002
Diastolic BP (5 mm Hg) - - 1.10 (1.06–1.15) 1.06 (1.01–1.10) 0.009
Values are presented as number (%). Model 1: Adjusted for age (continuous, year), sex (male and female), and education level (illiterate, prima- ry/middle school, and high school or above); Model 2: Adjusted for age (continuous, year), sex (male and female), education level (illiterate, pri- mary/middle school, and high school or above), residence (rural and urban), smoking status (never smoker, former smoker and current smok- er), alcohol consumption (never drinker and former/current drinker), body mass index (continuous, kg/m2), waist circumference (continuous, cm), and dyslipidemia (yes and no).
BP, blood pressure; T2DM, type 2 diabetes mellitus; CHARLS, China Health and Retirement Longitudinal Study; OR, odds ratio; CI, confidence interval.
to 5.79) for hypertension. In participants with normal glucose tolerance, both those with hypertension (OR, 2.57; 95% CI, 1.47 to 4.48) and those with prehypertension (OR, 1.78; 95%
CI, 0.97 to 3.25) were more likely to develop incident diabetes compared to their counterparts with a normal BP, despite the lack of statistical significance for the latter (Table 4). However, the associations were weaker and not statistically significant for either prehypertension or hypertension in participants with prediabetes. In addition, when 2,033 participants who report- ed previously diagnosed hypertension were excluded, the asso- ciation did not change appreciably (Table 5).
DISCUSSION
The major finding of this large prospective study is that both hypertension and prehypertension were associated with higher risk of incident T2DM, compared to normal BP in Chinese adults, independent of major risk factors for diabetes. In gen- eral, higher BP was associated with increased risk of T2DM in this Chinese population. The positive associations were consis- tent with those from a systematic review among 4.1 million adults [4] as well as those from two recent Chinese studies [5,6]. Our findings, together with others, imply that higher BP may be a modifiable risk factor for T2DM in Chinese adults.
Our study found that the risk of incident diabetes rose with the increase of BP and that participants with normal BP at baseline had the lowest risk of developing diabetes, even in analyses stratified by baseline glucose levels. Prehypertension
as well as hypertension increased the risk of T2DM by 32% and 102%, respectively. Although there have been several studies on the impact of higher BP on incident T2DM globally, it is still understudied in the Chinese population, in whom only two studies have examined the impact of BP as a continuous risk factor for diabetes; in addition, the excess risk associated with prehypertension and hypertension was not assessed [5,6].
Our effect estimates associated with prehypertension and hy- pertension are comparable to those reported in other Asian studies, including two Korean studies (1.27 and 1.51 for prehy- pertension and hypertension, respectively, among 7,150 partic- ipants [9]; 1.23, 1.26, and 1.60 for prehypertension, stage 1 hy- pertension, and stage 2 hypertension, respectively, among 10,038 participants [12]) and a Japanese study (1.39 and 1.76 for prehypertension and hypertension, respectively, among 7,594 participants [13]). Although the BP in these studies was grouped similarly, the ascertainment of incident diabetes dur- ing follow-up varied: (1) 75-g oral glucose tolerance test (OGTT) alone [12]; (2) 75-g OGTT, HbA1c, or use of hypo- glycemic agents [9]; and (3) fasting glucose or 75-g OGTT [13]. In addition, we noted that participants with normal glu- cose tolerance showed strong positive associations between higher BP and diabetes, while these associations were weaker and not statistically significant in those with prediabetes, which was consistent with the finding in a study of Koreans [9]. This finding implies that the role of higher BP in the development of T2DM might be diminished by other competing risk factors when glucose tolerance is compromised. Of note, none of the
previous prospective studies on the association between BP and T2DM among the Chinese population explored this het- erogeneity of effect sizes. In the current study, the stronger pos- itive association between a higher BP and T2DM among par- ticipants younger than 50 years old versus that in other age groups may suggest that higher BP in young people deserves particular attention for susceptibility to risk of diabetes.
Table 3. Association between higher BP and risk of incident T2DM in the CHARLS subgroups (n=9,642)
Subgroup No.
at risk T2DM case
Model 1: OR (95% CI)a Model 2: OR (95% CI)a P for heterogeneity Prehypertension Hypertension Prehypertension Hypertension
Overall 9,642 429 1.52 (1.13–2.04) 2.73 (2.11–3.54) 1.32 (0.98–1.77) 2.02 (1.54–2.64)
Sex 0.820
Male 4,561 160 1.61 (0.99–2.59) 3.05 (1.97–4.71) 1.37 (0.84–2.23) 2.20 (1.40–3.47) Female 5,081 269 1.48 (1.02–2.14) 2.56 (1.85–3.55) 1.29 (0.89–1.88) 1.91 (1.37–2.67)
Age, yr 0.039
<50 1,995 77 2.89 (1.52–5.50) 4.88 (2.63–9.05) 2.51 (1.30–4.84) 3.02 (1.57–5.79) 50–60 3,478 139 1.16 (0.72–1.86) 2.19 (1.45–3.30) 0.96 (0.59–1.56) 1.46 (0.94–2.27) >60 4,169 213 1.34 (0.84–2.13) 2.47 (1.66–3.68) 1.22 (0.77–1.96) 2.05 (1.37–3.09)
Residence 0.899
Rural 8,095 341 1.56 (1.12–2.16) 2.79 (2.09–3.73) 1.35 (0.97–1.87) 2.02 (1.49–2.72) Urban 1,547 88 1.32 (0.68–2.57) 2.39 (1.33–4.31) 1.18 (0.60–2.32) 1.96 (1.07–3.62)
Education level 0.135
Illiterate 2,715 138 1.25 (0.76–2.07) 1.92 (1.23–3.00) 1.08 (0.65–1.81) 1.44 (0.91–2.29) Primary/middle school 3,983 163 1.87 (1.12–3.13) 3.99 (2.54–6.28) 1.69 (1.01–2.84) 3.12 (1.95–4.97) High school or above 2,944 128 1.51 (0.91–2.51) 2.58 (1.63–4.08) 1.25 (0.75–2.10) 1.71 (1.05–2.77)
BMI, kg/m2 0.538
Underweight/normal (<24.0) 5,980 172 1.25 (0.82–1.89) 1.99 (1.36–2.91) 1.18 (0.78–1.80) 1.82 (1.23–2.68) Overweight (24.0–27.9) 2,687 160 1.18 (0.73–1.93) 1.92 (1.25–2.96) 1.13 (0.69–1.84) 1.75 (1.13–2.71) Obese (≥28.0) 975 97 2.50 (0.98–6.35) 3.44 (1.44–8.18) 2.39 (0.94–6.10) 3.25 (1.36–7.77)
Smoking status 0.959
Never smoker 5,838 296 1.49 (1.04–2.12) 2.72 (1.99–3.72) 1.30 (0.90–1.86) 2.02 (1.46–2.79) Current smoker 3,042 101 1.51 (0.85–2.67) 2.44 (1.45–4.11) 1.26 (0.71–2.25) 1.66 (0.97–2.86) Former smoker 762 32 1.89 (0.54–6.59) 4.09 (1.36–12.25) 1.78 (0.50–6.31) 3.58 (1.17–10.97)
Alcohol consumption 0.844
Never/former drinker 7,200 354 1.59 (1.15–2.20) 2.81 (2.11–3.75) 1.38 (0.99–1.92) 2.06 (1.52–2.78) Current drinker 2,442 75 1.27 (0.65–2.50) 2.43 (1.34–4.41) 1.10 (0.55–2.18) 1.85 (1.00–3.43)
Model 1: Adjusted for age (continuous, year), sex (male and female), and education level (illiterate, primary/middle school and high school or above); Model 2: Adjusted for age (continuous, year), sex (male and female), education level (illiterate, primary/middle school, and high school or above), residence (rural and urban), smoking status (never smoker, former smoker and current smoker), alcohol consumption (never drinker and former/current drinker), body mass index (continuous, kg/m2), waist circumference (continuous, cm), and dyslipidemia (yes and no).
BP, blood pressure; T2DM, type 2 diabetes mellitus; CHARLS, China Health and Retirement Longitudinal Study; OR, odds ratio; CI, confidence interval; BMI, body mass index.
aOR and 95% CI were calculated for prehypertension and hypertension versus normal blood pressure.
Our study also showed that an increase of 10 mm Hg in sys- tolic BP or 5 mm Hg in diastolic BP was associated with an 8%
(OR, 1.08; 95% CI, 1.03 to 1.13) or 6% (OR, 1.06; 95% CI, 1.01 to 1.10) increased risk of incident T2DM in 4 years, although there was only borderline statistical significance. These esti- mates were equivalent to those associated with the same time- cumulative systolic BP or diastolic BP change (4% [hazard ra-
tio, 1.04; 95% CI, 1.03 to 1.04] and 2% [hazard ratio, 1.02; 95%
CI, 1.02 to 1.03]) in the longitudinal Kailuan Study in China [6], but the estimate for each 10-mm Hg change was lower than the 14% reported in the China Kadoorie Biobank study
[5]. Overall, the increased risk of T2DM in Chinese popula- tions was much lower than that reported in the large systemat- ic review of 31 prospective studies predominantly conducted in Western populations (relative risk of 1.76 for a 20-mm Hg Table 4. Association between higher BP and risk of incident T2DM among participants with baseline FBG in CHARLS (n=6,196)
Variable No. at risk T2DM case OR (95% CI)
P for trend
Model 1 Model 2
All 6,196 260 <0.001
Normal BP 2,124 55 1 1
Prehypertension 1,758 63 1.43 (0.99–2.07) 1.26 (0.87–1.82)
Hypertension 2,314 142 2.44 (1.77–3.38) 1.86 (1.33–2.61)
NGTa 3,063 93 <0.001
Normal BP 1,213 20 1 1
Prehypertension 856 25 1.88 (1.03–3.43) 1.78 (0.97–3.25)
Hypertension 994 48 2.93 (1.70–5.04) 2.57 (1.47–4.48)
Prediabetesb 3,133 167 0.073
Normal BP 911 35 1 1
Prehypertension 902 38 1.13 (0.70–1.80) 0.95 (0.59–1.53)
Hypertension 1,320 94 1.95 (1.30–2.92) 1.39 (0.91–2.13)
Model 1: Adjusted for age (continuous, year), sex (male and female) and education level (illiterate, primary/middle school, and high school or above); Model 2: Adjusted for age (continuous, year), sex (male and female), education level (illiterate, primary/middle school, and high school or above), residence (rural and urban), smoking status (never smoker, former smoker and current smoker), alcohol consumption (never drinker and former/current drinker), body mass index (continuous, kg/m2), waist circumference (continuous, cm), and dyslipidemia (yes and no).
BP, blood pressure; T2DM, type 2 diabetes mellitus; FBG, fasting blood glucose; CHARLS, China Health and Retirement Longitudinal Study;
OR, odds ratio; CI, confidence interval; NGT, normal glucose tolerance.
aNormal glucose tolerance was defined as FBG <100 mg/dL, bPrediabetes was defined as FBG ≥100 mg/dL and ≤125 mg/dL.
Table 5. Association between higher BP and risk of incident T2DM after excluding participants with self-reported hypertension in the CHARLS participants (n=7,609)
Group No. at risk T2DM case OR (95% CI)
P for trend
Model 1 Model 2
Overall 7,609 267 (3.51) 0.002
Normal BP 3,265 84 (2.57) 1 1
Prehypertension 2,799 105 (3.75) 1.51 (1.13–2.02) 1.31 (0.97–1.76)
Hypertension 1,545 78 (5.05) 2.00 (1.44–2.76) 1.68 (1.21–2.34)
Systolic BP (10 mm Hg) - - 1.14 (1.07–1.21) 1.10 (1.03–1.17) 0.005
Diastolic BP (5 mm Hg) - - 1.10 (1.04–1.16) 1.06 (1.00–1.12) 0.057
Values are presented as number (%). Model 1: Adjusted for age (continuous, year), sex (male and female) and education level (illiterate, prima- ry/middle school, and high school or above); Model 2: Adjusted for age (continuous, year), sex (male and female), education level (illiterate, pri- mary/middle school, and high school or above), residence (rural and urban), smoking status (never smoker, former smoker and current smok- er), alcohol consumption (never drinker and former/current drinker), body mass index (continuous, kg/m2), waist circumference (continuous, cm), and dyslipidemia (yes and no).
BP, blood pressure; T2DM, type 2 diabetes mellitus; CHARLS, China Health and Retirement Longitudinal Study; OR, odds ratio; CI, confidence interval.
change in systolic BP or a relative risk of 1.32 for a 10-mm Hg change) [4]. Of note, a large Mendelian randomization study using 28 genetic variants as an instrumental variable to exclude confounding effects showed that genetically elevating the sys- tolic BP by 1 mm Hg was associated with a 2% increased risk of T2DM [14] (or 22% for a 10-mm Hg change in systolic BP) [14] in Europeans. The inconsistencies between the magnitude of effect estimates may reflect the differential role of higher BP in the development of diabetes for different populations.
Although there are no confirmed mechanisms, inflamma- tion, oxidative stress, endothelial dysfunction, insulin resis- tance, and genetic predisposition have been proposed to ex- plain the link between higher BP and diabetes. First, inflam- mation and oxidative stress may be shared pathways for diabe- tes and hypertension [15]. For example, inflammatory bio- markers such as C-reactive protein have been reported to be associated with both an elevated BP [16,17] and diabetes [18]
in the general population. Second, hypertension is involved in the development of endothelial dysfunction, whose biomark- ers are associated with increased risk of diabetes [18-20].
Third, insulin resistance as a precursor to diabetes is thought to increase the risk of hypertension [21] and thus can partly explain the link between BP and diabetes. Fourth, there seems to be a shared genetic susceptibility for hypertension and dia- betes [15]. Variants in genes encoding adiponectin, apolipo- protein, and adrenomedullin have been found to correlate with both hypertension and diabetes. In addition, some genetic variants predisposing individuals to diabetes are also closely associated with a higher risk of hypertension. Despite these putative mechanisms, there is still a lack of clinical trials to demonstrate the effectiveness of reducing BP for the preven- tion of diabetes. Limited evidence from randomized trials shows that reduced incidence of diabetes is associated with lower BP, but the effects are restricted to the use of angioten- sin-converting enzyme inhibitors and angiotensin receptor blockers [22]. Thus, it is still uncertain whether the association between elevated BP and diabetes is causal.
Our study has certain strengths, including prospective na- ture, large sample size, population-based design, and compre- hensive follow-up. However, there are still some limitations to acknowledge. First, T2DM was mainly ascertained by self-re- porting of physician diagnosis in follow-up surveys. This may lead to misclassification due to underreporting in underdevel- oped areas where screening for diabetes is not routine in regu- lar physical check-ups [23]. Second, we could not fully control
for potential confounding effects from BP control in the analy- ses due to a lack of information regarding antihypertensive medications. Previous trials have demonstrated that BP reduc- tion by certain antihypertensive medications can reduce the risk of diabetes [22]. However, our sensitivity analysis after ex- clusion of participants with a reported physician diagnosis of hypertension showed that the associations remained robust when the effect of antihypertensive medications was partly considered. Third, the BP information was not updated in our analyses due to data availability, which is also a weakness of our analytical approach based on logistical regression. Future anal- yses using time-dependent modeling that incorporates expo- sure updates and time-to-event information may improve our estimates. Fourth, the duration of the total follow-up was only about 4 years, which is shorter than that reported in earlier studies. A longer-term follow-up may be necessary to corrobo- rate our findings in the Chinese population. Since the mean age of our study participants was approximately 60 years old, many of the ascertained prehypertension/hypertension cases at base- line may presumably have been in that state for years, which means a much longer exposure than the 4 years of follow-up.
Thus, the associations observed between hypertension and in- cident diabetes in our study were still considered reasonable.
In conclusion, our study demonstrates that higher BP was associated with increased risk of incident diabetes in Chinese adults and that both hypertension and prehypertension were risk factors of diabetes, independent of other risk factors for diabetes. Our findings imply that BP control, such as monitor- ing and management, may play an important role in diabetes prevention. However, evidence from clinical trials is still need- ed to confirm the benefits of BP control.
CONFLICTS OF INTEREST
No potential conflict of interest relevant to this article was re- ported.
AUTHOR CONTRIBUTIONS
Conception or design: X.Y., A.P., X.F.P., C.X.Y.
Acquisition, analysis, or interpretation of data: X.Y., F.Z., Y.X., Y.W., Y.Y.
Drafting the work or revision: J.C., A.P., J.H.Y.W., X.F.P., C.X.Y.
Final approval of the manuscript: X.Y., J.C., A.P., J.H.Y.W, F.Z., Y.X., Y.W., Y.Y., X.F.P., C.X.Y.
ORCID
Xue Yang https://orcid.org/0000-0002-9775-5009 Xiong-Fei Pan https://orcid.org/0000-0002-9350-9230 Chun-Xia Yang https://orcid.org/0000-0002-8548-2381
ACKNOWLEDGMENTS
We thank the China Center for Economic Research, National School of Development at Peking University for providing the CHARLS data. An Pan was supported by the National Key Re- search and Development Program of China (2017YFC0907504).
Xiong-Fei Pan was funded by the International Postdoctoral Ex- change Fellowship Program of the China Postdoctoral Council (No. 20180062). The sponsors had no role in the study design or collection, analysis, or interpretation of data. This research did not receive any specific grants from funding agencies in the pub- lic, commercial, or not-for-profit sectors.
REFERENCES
1. Arauz A, Rodriguez-Agudelo Y, Sosa AL, Chavez M, Paz F, Gonzalez M, Coral J, Diaz-Olavarrieta C, Roman GC. Vascular cognitive disorders and depression after first-ever stroke: the Fogarty-Mexico Stroke Cohort. Cerebrovasc Dis 2014;38:284-9.
2. Liu M, Liu SW, Wang LJ, Bai YM, Zeng XY, Guo HB, Liu YN, Jiang YY, Dong WL, He GX, Zhou MG, Yu SC. Burden of dia- betes, hyperglycaemia in China from to 2016: findings from the 1990 to 2016, global burden of disease study. Diabetes Metab 2019;45:286-93.
3. Wang L, Gao P, Zhang M, Huang Z, Zhang D, Deng Q, Li Y, Zhao Z, Qin X, Jin D, Zhou M, Tang X, Hu Y, Wang L. Preva- lence and ethnic pattern of diabetes and prediabetes in China in 2013. JAMA 2017;317:2515-23.
4. Emdin CA, Anderson SG, Woodward M, Rahimi K. Usual blood pressure and risk of new-onset diabetes: evidence from 4.1 million adults and a meta-analysis of prospective studies. J Am Coll Cardiol 2015;66:1552-62.
5. Lacey B, Lewington S, Clarke R, Kong XL, Chen Y, Guo Y, Yang L, Bennett D, Bragg F, Bian Z, Wang S, Zhang H, Chen J, Wal- ters RG, Collins R, Peto R, Li L, Chen Z; China Kadoorie Bio- bank collaborative group. Age-specific association between blood pressure and vascular and non-vascular chronic diseases in 0·5 million adults in China: a prospective cohort study. Lan- cet Glob Health 2018;6:e641-9.
6. Wu YT, Song L, Liu XX, Gao JS, Zheng XM, Ruan CY, Zhao HY, Chen SH, Gao WY, Jonas JB, Wu SL. Time-cumulated blood pressure exposure and incident impairment of glucose tolerance and diabetes mellitus. BMC Cardiovasc Disord 2017;
17:106.
7. Zhao Y, Hu Y, Smith JP, Strauss J, Yang G. Cohort profile: the China Health and Retirement Longitudinal Study (CHARLS).
Int J Epidemiol 2014;43:61-8.
8. Zhao Y, Crimmins EM, Hu P, Shen Y, Smith JP, Strauss J, Wang Y, Zhang Y. Prevalence, diagnosis, and management of diabetes mellitus among older Chinese: results from the China Health and Retirement Longitudinal Study. Int J Public Health 2016;
61:347-56.
9. Kim MJ, Lim NK, Choi SJ, Park HY. Hypertension is an inde- pendent risk factor for type 2 diabetes: the Korean genome and epidemiology study. Hypertens Res 2015;38:783-9.
10. Liu LS; Writing Group of 2010 Chinese Guidelines for the Management of Hypertension. 2010 Chinese guidelines for the management of hypertension. Zhonghua Xin Xue Guan Bing Za Zhi. 2011;39:579-615.
11. Allison MA, Budoff MJ, Wong ND, Blumenthal RS, Schreiner PJ, Criqui MH. Prevalence of and risk factors for subclinical cardiovascular disease in selected US Hispanic ethnic groups:
the Multi-Ethnic Study of Atherosclerosis. Am J Epidemiol 2008;167:962-9.
12. Cho NH, Kim KM, Choi SH, Park KS, Jang HC, Kim SS, Sattar N, Lim S. High blood pressure and its association with incident diabetes over 10 years in the Korean Genome and Epidemiolo- gy Study (KoGES). Diabetes Care 2015;38:1333-8.
13. Hayashi T, Tsumura K, Suematsu C, Endo G, Fujii S, Okada K.
High normal blood pressure, hypertension, and the risk of type 2 diabetes in Japanese men. The Osaka Health Survey. Diabetes Care 1999;22:1683-7.
14. Aikens RC, Zhao W, Saleheen D, Reilly MP, Epstein SE, Tik- kanen E, Salomaa V, Voight BF. Systolic blood pressure and risk of type 2 diabetes: a Mendelian randomization study. Diabetes 2017;66:543-50.
15. Cheung BM, Li C. Diabetes and hypertension: is there a com- mon metabolic pathway? Curr Atheroscler Rep 2012;14:160-6.
16. Sesso HD, Buring JE, Rifai N, Blake GJ, Gaziano JM, Ridker PM. C-reactive protein and the risk of developing hyperten- sion. JAMA 2003;290:2945-51.
17. Bautista LE, Vera LM, Arenas IA, Gamarra G. Independent as- sociation between inflammatory markers (C-reactive protein, interleukin-6, and TNF-alpha) and essential hypertension. J
Hum Hypertens 2005;19:149-54.
18. Odegaard AO, Jacobs DR Jr, Sanchez OA, Goff DC Jr, Reiner AP, Gross MD. Oxidative stress, inflammation, endothelial dysfunction and incidence of type 2 diabetes. Cardiovasc Dia- betol 2016;15:51.
19. Meigs JB, Hu FB, Rifai N, Manson JE. Biomarkers of endothe- lial dysfunction and risk of type 2 diabetes mellitus. JAMA 2004;291:1978-86.
20. Meigs JB, O’donnell CJ, Tofler GH, Benjamin EJ, Fox CS, Lipin- ska I, Nathan DM, Sullivan LM, D’Agostino RB, Wilson PW.
Hemostatic markers of endothelial dysfunction and risk of in- cident type 2 diabetes: the Framingham Offspring Study. Dia-
betes 2006;55:530-7.
21. Wang F, Han L, Hu D. Fasting insulin, insulin resistance and risk of hypertension in the general population: a meta-analysis.
Clin Chim Acta 2017;464:57-63.
22. Elliott WJ, Meyer PM. Incident diabetes in clinical trials of anti- hypertensive drugs: a network meta-analysis. Lancet 2007;369:
201-7.
23. Ning M, Zhang Q, Yang M. Comparison of self-reported and biomedical data on hypertension and diabetes: findings from the China Health and Retirement Longitudinal Study (CHARLS).
BMJ Open 2016;6:e009836.