D I A B E T E S & M E T A B O L I S M J O U R N A L
This is an Open Access article distributed under the terms of the Creative Commons At- tribution Non-Commercial License (http://creativecommons.org/licenses/by-nc/3.0/) which permits unrestricted non-commercial use, distribution, and reproduction in any medium, provided the original work is properly cited.
Relative Skeletal Muscle Mass Is Associated with Development of Metabolic Syndrome
Byung Sam Park, Ji Sung Yoon
Department of Internal Medicine, Yeungnam University College of Medicine, Daegu, Korea
Background: Visceral adiposity is related to insulin resistance. Skeletal muscle plays a central role in insulin-mediated glucose disposal; however, little is known about the association between muscle mass and metabolic syndrome (MS). This study is to clarify the clinical role of skeletal muscle mass in development of MS.
Methods: A total of 1,042 subjects were enrolled. Subjects with prior MS and chronic diseases were excluded. After 24 months, development of MS was assessed using NCEP-ATP III criteria. Skeletal muscle mass (SMM; kg), body fat mass (BFM; kg), and visceral fat area (VFA; cm2) were obtained from bioelectrical analysis. Then, the following values were calculated as follows: per- cent of SMM (SMM%; %): SMM (kg)/weight (kg), skeletal muscle index (SMI; kg/m2): SMM (kg)/height (m2), skeletal muscle to body fat ratio (MFR): SMM (kg)/BFM (kg), and skeletal muscle to visceral fat ratio (SVR; kg/cm2): SMM (kg)/VFA (cm2).
Results: Among 838 subjects, 88 (10.5%) were newly diagnosed with MS. Development of MS increased according to increasing quintiles of BMI, SMM, VFA, and SMI, but was negatively associated with SMM%, MFR, and SVR. VFA was positively associat- ed with high waist circumference (WC), high blood pressure (BP), dysglycemia, and high triglyceride (TG). In contrast, MFR was negatively associated with high WC, high BP, dysglycemia, and high TG. SVR was negatively associated with all components of MS.Conclusion: Relative SMM ratio to body composition, rather than absolute mass, may play a critical role in development of MS and could be used as a strong predictor.
Keywords: Body composition; Metabolic syndrome; Muscle, skeletal
Corresponding author: Ji Sung Yoon
Department of Internal Medicine, Yeungnam University College of Medicine, 170 Hyeonchung-ro, Nam-gu, Daegu 705-717, Korea
E-mail: jsyoon9@ynu.ac.kr
INTRODUCTION
The incidence of metabolic syndrome (MS) is increasing world- wide. MS refers to a collection of metabolic abnormalities, in- cluding visceral obesity, hyperglycemia, dyslipidemia, and hy- pertension. It is known as a predisease state and leads to in- creased risk of cardiovascular disease, type 2 diabetes mellitus, and cancer.
The predominant characteristic of MS is insulin resistance [1] and the most prevalent form of MS is associated with ab- dominal obesity, especially when accompanied by deposition of visceral adipose tissue [2]. Visceral fat is closely linked to insulin resistance and chronic metabolic disease.
Skeletal muscle comprises a large percentage of body mass and is the most abundant insulin-sensitive tissue [3]. It also plays an important role in maintenance of systemic glucose metabolism [4]. Therefore, loss of skeletal muscle mass (SMM) and skeletal muscle resistance to insulin associated with the aging process or obesity may be fundamental to metabolic dysregulation and may contribute to the development of MS [5]. Potential mechanisms contributing to reduced insulin sig- naling and action in skeletal muscle include adipose tissue ex- pansion and increased levels of inflammatory adipokines, in- creased renin-angiotensin-aldosterone system activity, decreased muscle mitochondrial oxidative capacity, increased intramus- cular lipid accumulation, and increased levels of reactive oxy- http://dx.doi.org/10.4093/dmj.2013.37.6.458
pISSN 2233-6079 · eISSN 2233-6087
gen species [5].
Methods for estimating body composition, including SMM and body fat mass (BFM), should be valid and reliable. Bio- electrical analysis (BIA) has recently become a widely accepted method for estimation of body composition and is relatively simple, quick, and noninvasive [6]. Eight-polar BIA offers val- id and accurate estimates of total and appendicular body com- position when validated against DXA [7].
This study was performed to clarify the clinical role of SMM in development of MS using different anthropometric param- eters estimated by multifrequency bioelectrical impedance analysis.
METHODS
Study design
This study is a retrospective cohort study of 1,042 subjects ranging in age from 20 to 75 years old who visited the Yeung- nam University Health Promotion Center from June 1, 2008 to June 30, 2010. Clinical data, including demographic factors, past medical history, laboratory findings, and anthropometric parameters were collected at baseline. Twenty-four months af- ter baseline, metabolic parameters and development of MS were assessed. Mean total follow-up period was 28.7±5.4 months.
Preexisting MS was excluded. Chronic diseases that can affect SMM were also excluded, including severe anemia (hemoglo- bin <8 mg/dL), chronic kidney disease (serum creatinine
>1.5 mg/dL), abnormal liver function test (total bilirubin, di- rect bilirubin, aspartate aminotransferase, or alanine amino- transferase >2 folds of upper normal limits), and abnormal tumor markers (α-fetoprotein >15 mg/mL, carbohydrate an- tigen 19-9 >37 U/mL, carcinoembryonic antigen >10 mg/mL, prostate specific antigen >4 mg/mL in male, or cancer antigen 125 >35 U/mL in female). After excluding 204 subjects, 838 subjects (mean age, 46.9±9.9 years; male:female, 477:361) were included in the study. Study protocol was approved by the Institutional Review Board of Yeungnam University Medi- cal Center. Because this was a retrospective study, the board deemed it exempt from informed consent requirements.
Analytical methods
Height, body weight (BW), and waist circumference (WC) were measured and body mass index (BMI) was calculated by divid- ing the weight (kg) with height square (m2). WC was measured using a soft tape midway between the lowest rib and the iliac
crest while participants were standing. Systolic and diastolic BPs were measured using a standard sphygmomanometer af- ter at least 10 minutes of rest. Blood was drawn for evaluation of metabolic, biochemical, and hematological parameters after overnight fasting for 10 to 12 hours. Fasting plasma glucose (FPG), total cholesterol (TC), triglyceride (TG), and high den- sity lipoprotein cholesterol (HDL-C) were measured using the hexokinase method (AU 5400 Autoanalyser; Olympus, Tokyo, Japan). Low density lipoprotein cholesterol (LDL-C) levels were calculated according to the Friedewald formula. Hemoglobin A1c (HbA1c) was measured using high performance liquid chromatography (HLC-723 G7; Tosoh Corp., Tokyo, Japan) according to the standardized Diabetes Control and Compli- cations Trial assay.
Measurement of anthropometric parameters using body impedance analysis
Bioelectrical impedance was estimated using InBody 720 (Bio- space Inc., Seoul, Korea), a multifrequency BIA device, after overnight fasting for at least 8 hours. Study subjects were in- structed to stand upright and grasp the handles of the analyz- er, thereby putting both palms, thumbs, and anterior and pos- terior aspects of each sole of the foot in contact an 8-polar tac- tile-electrode. Impedance values for five segments (arms, trunk, and legs) were measured at frequencies of 1, 5, 20, 50, 500, and 1,000 kHz through the 8-polar tactile-electrode. Based on these impedance values, SMM (kg), total BFM (kg), and visceral fat area (VFA) at the umbilicus level (cm2) were calculated. Skele- tal muscle parameters based on these variables were defined as follows, in order to estimate not only of the effect of absolute SMM but also the effect of relative ratio to body composition:
Percent of SMM (SMM%, %): SMM (kg)/weight (kg) Skeletal muscle index (SMI, kg/m2): SMM (kg)/height (m2) Skeletal muscle to body fat ratio (MFR): SMM (kg)/BFM (kg) Skeletal muscle to visceral fat ratio (SVR, kg/cm2): SMM (kg)/
VFA (cm2)
Definition of metabolic syndrome
MS was defined based on the modified NCEP-ATP III criteria [8] as any combination of three or more of the following com- ponents: 1) abdominal obesity (WC ≥90 cm in males and ≥80 cm in females) based on adjusted Asian-Pacific waist circum- ference criterion; 2) elevated BP (≥130 mm Hg systolic pres- sure or ≥85 mm Hg diastolic pressure), or treatment of previ-
ously diagnosed hypertension; 3) elevated FPG (≥100 mg/dL) or treatment of diabetes; 4) elevated TG (≥150 mg/dL), or spe- cific treatment for this lipid abnormality; and 5) reduced HDL- C (<40 mg/dL in males and <50 mg/dL in females).
Statistical analysis
Subjects were divided into two groups: those who had devel- oped MS and those who had not developed MS during a 2-year follow-up period. Clinical and anthropometric data are ex- pressed as mean±standard deviation. Comparisons of contin- uous variables between groups with and without MS were performed using Student t-test. All anthropometric parame- ters were described in quintiles (data are not shown). Multi-
variate logistic regression analysis was used to estimate the ef- fects of each anthropometric parameter on development of MS.
Odds ratios (ORs) of MS in the fifth quintile were estimated using the first quintile for reference. ORs adjusted for age and gender are presented with 95% confidence intervals (CIs). All statistical analyses were performed using the statistical package for SPSS version 20.0 for Windows (IBM Co., Armonk, NY, USA) with a 5% significance level (P<0.05).
RESULTS
Baseline characteristics
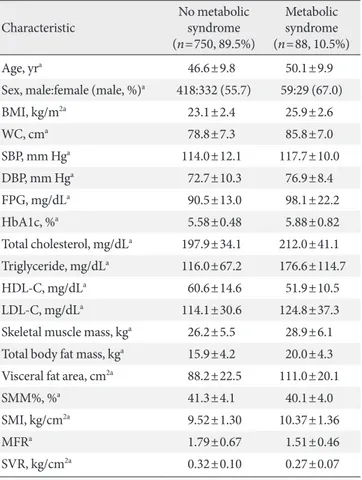
Baseline characteristics are shown in Table 1. Among 838 sub- jects, 88 subjects (10.5%) developed MS during the 2-year fol- low-up period. Older males were more prevalent in the MS group compared to the group without MS. Subjects in the MS group had poorer metabolic status (higher BMI, WC, BP, FPG, HbA1c, TC, TG, and LDL-C and lower HDL-C) at baseline than subjects without MS. SMM, BFM, VFA, and SMI were significantly higher in subjects with MS; however, SMM%, MFR, and SVR were significantly higher in subjects without MS.
Proportions of each quintile in subjects with metabolic syndrome
The proportions of each quintile of various anthropometric parameters in subjects with MS are shown in Fig. 1. The fifth quintile of MFR, SMM%, and SVR accounted for the smallest Table 1. Baseline characteristics of all subjects according to
development or no development of metabolic syndrome
Characteristic No metabolic
syndrome (n=750, 89.5%)
Metabolic syndrome (n=88, 10.5%)
Age, yra 46.6±9.8 50.1±9.9
Sex, male:female (male, %)a 418:332 (55.7) 59:29 (67.0)
BMI, kg/m2a 23.1±2.4 25.9±2.6
WC, cma 78.8±7.3 85.8±7.0
SBP, mm Hga 114.0±12.1 117.7±10.0
DBP, mm Hga 72.7±10.3 76.9±8.4
FPG, mg/dLa 90.5±13.0 98.1±22.2
HbA1c, %a 5.58±0.48 5.88±0.82
Total cholesterol, mg/dLa 197.9±34.1 212.0±41.1 Triglyceride, mg/dLa 116.0±67.2 176.6±114.7
HDL-C, mg/dLa 60.6±14.6 51.9±10.5
LDL-C, mg/dLa 114.1±30.6 124.8±37.3
Skeletal muscle mass, kga 26.2±5.5 28.9±6.1 Total body fat mass, kga 15.9±4.2 20.0±4.3 Visceral fat area, cm2a 88.2±22.5 111.0±20.1
SMM%, %a 41.3±4.1 40.1±4.0
SMI, kg/cm2a 9.52±1.30 10.37±1.36
MFRa 1.79±0.67 1.51±0.46
SVR, kg/cm2a 0.32±0.10 0.27±0.07
Values are presented as mean±standard deviation.
BMI, body mass index; WC, waist circumference; SBP, systolic blood pressure; DBP, diastolic blood pressure; FPG, fasting plasma glucose;
HbA1c, hemoglobin A1c; HDL-C, high density lipoprotein choles- terol; LDL-C, low density lipoprotein cholesterol; SMM%, percent of skeletal muscle mass; SMI, skeletal muscle index; MFR, skeletal mus- cle to body fat ratio; SVR, skeletal muscle to visceral fat area.
aP<0.05 for Student t-test between two groups.
Fig. 1. Proportions of each quintile in subjects with metabolic syndrome according to various anthropometric parameters.
The fifth quintile of percent of skeletal muscle mass (SMM%), skeletal muscle to body fat ratio (MFR), and skeletal muscle to visceral fat ratio (SVR) accounted for the smallest proportion in subjects with metabolic syndrome. BMI, body mass index;
VFA, visceral fat area; SMI, skeletal muscle index.
5th Quintile 4th Quintile 3rd Quintile 2nd Quintile 1st Quintile
BMI SMM VFA SMM% SMI MFR SVR
100 80 60 40 20 0
%
proportion in subjects with MS. In contrast, the fifth quintile of BMI, SMM, VFA, and SMI accounted for the largest pro- portion in subjects with MS.
Effects of skeletal muscle mass on development of metabolic syndrome
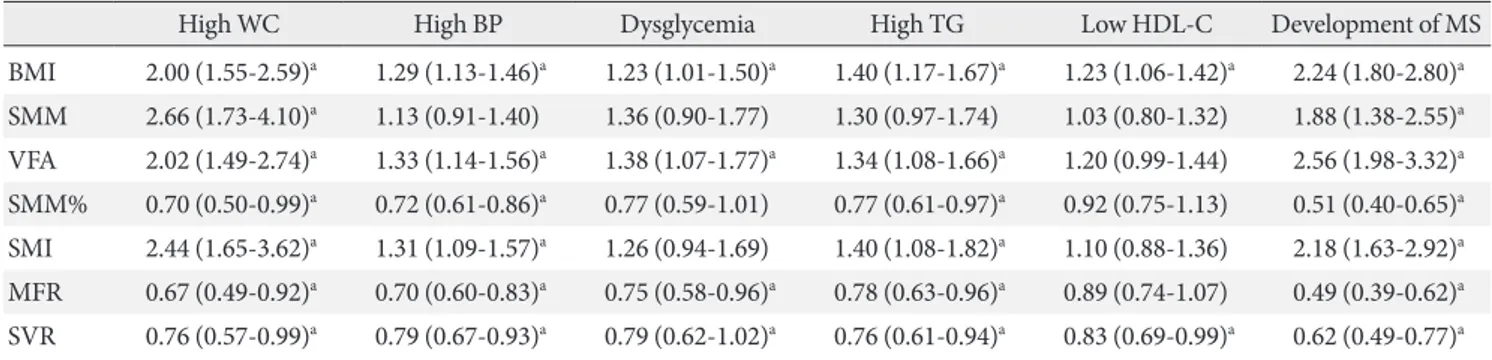
The risk of developing MS increased with increasing quintiles of BMI (OR, 2.24; 95% CI, 1.80 to 2.80), SMM (OR, 1.88; 95%
CI, 1.38 to 2.55), VFA (OR, 2.56; 95% CI, 1.98 to 3.32), and SMI (OR, 2.18; 95% CI, 1.63 to 2.92), but was negatively asso- ciated with increasing quintiles of SMM% (OR, 0.51; 95% CI, 0.40 to 0.65), MFR (OR, 0.49; 95% CI, 0.39 to 0.62), and SVR (OR, 0.62; 95% CI, 0.49 to 0.77) (Table 2).
ORs for each component of MS according to quintiles of each anthropometric parameter are also shown in Table 2. SMM was positively associated only with high WC (OR, 2.66; 95% CI, 1.73 to 4.10), while SMI was positively associated with high WC (OR, 2.44; 95% CI, 1.65 to 3.62), high BP (OR, 1.31; 95% CI, 1.09 to 1.57), and high TG (OR, 1.40; 95% CI, 1.08 to 1.82). In contrast, SMM% was negatively associated with high WC (OR, 0.7; 95% CI, 0.50 to 0.99), high BP (OR, 0.72; 95% CI, 0.61 to 086), and high TG (OR, 0.77; 95% CI, 0.61 to 0.97). Both SMI and SMM% showed no significant association with dysglycemia or low HDL-C. VFA showed a positive association with compo- nents of MS, including high WC (OR, 2.02), high BP (OR, 1.33), dysglycemia (OR, 1.38), and high TG (OR, 1.34). The exception was low HDL-C, which was not significantly associated with VFA. In contrast, MFR showed a significant negative associa- tion with high WC (OR, 0.6), high BP (OR, 0.7), dysglycemia (OR, 0.75), and high TG (OR, 0.78), but not low HDL-C. SVR
was negatively associated with all components of MS, including high WC (OR, 0.76), high BP (OR, 0.79), dysglycemia (OR, 0.79), high TG (OR, 0.76), and low HDL-C (OR, 0.83).
Among subjects who did not develop MS, the number of components of MS significantly decreased in the fifth quintile of SVR, compared to the first quintile of SVR (OR, 0.47; 95%
CI, 0.24 to 0.92) (Table 3).
DISCUSSION
This study showed that higher SMM%, MFR, and SVR, which
Table 2. Odds ratios and 95% confidence intervals for each component of metabolic syndrome and development of metabolic syndrome according to increasing quintiles of each anthropometric parameter
High WC High BP Dysglycemia High TG Low HDL-C Development of MS
BMI 2.00 (1.55-2.59)a 1.29 (1.13-1.46)a 1.23 (1.01-1.50)a 1.40 (1.17-1.67)a 1.23 (1.06-1.42)a 2.24 (1.80-2.80)a SMM 2.66 (1.73-4.10)a 1.13 (0.91-1.40) 1.36 (0.90-1.77) 1.30 (0.97-1.74) 1.03 (0.80-1.32) 1.88 (1.38-2.55)a VFA 2.02 (1.49-2.74)a 1.33 (1.14-1.56)a 1.38 (1.07-1.77)a 1.34 (1.08-1.66)a 1.20 (0.99-1.44) 2.56 (1.98-3.32)a SMM% 0.70 (0.50-0.99)a 0.72 (0.61-0.86)a 0.77 (0.59-1.01) 0.77 (0.61-0.97)a 0.92 (0.75-1.13) 0.51 (0.40-0.65)a SMI 2.44 (1.65-3.62)a 1.31 (1.09-1.57)a 1.26 (0.94-1.69) 1.40 (1.08-1.82)a 1.10 (0.88-1.36) 2.18 (1.63-2.92)a MFR 0.67 (0.49-0.92)a 0.70 (0.60-0.83)a 0.75 (0.58-0.96)a 0.78 (0.63-0.96)a 0.89 (0.74-1.07) 0.49 (0.39-0.62)a SVR 0.76 (0.57-0.99)a 0.79 (0.67-0.93)a 0.79 (0.62-1.02)a 0.76 (0.61-0.94)a 0.83 (0.69-0.99)a 0.62 (0.49-0.77)a WC, waist circumference; BP, blood pressure; TG, triglyceride; HDL, high density lipoprotein; MS, metabolic syndrome; BMI, body mass in- dex; SMM, skeletal muscle mass; VFA, visceral fat area; SMM%, percent of skeletal muscle mass; SMI, skeletal muscle index; MFR, skeletal muscle to body fat mass; SVR, skeletal muscle to visceral fat area.
aP<0.05, age- and sex-adjusted odds ratios are presented.
Table 3. Odds ratios and 95% confidence intervals of increase in the number of components of metabolic syndrome in the fifth quintile of each anthropometric parameter reference to the first quintile among subjects who did not develop metabol- ic syndrome
ORs of development of MS (95% CIs)
BMI 1.30 (0.75-2.26)
SMM 1.22 (0.49-3.05)
VFA 1.37 (0.68-2.76)
SMM% 0.82 (0.41-1.64)
SMI 1.46 (0.70-3.06)
MFR 0.76 (0.39-1.45)
SVR 0.47 (0.24-0.92)a
OR, odds ratio; MS, metabolic syndrome; CI, confidence interval;
BMI, body mass index; SMM, skeletal muscle mass; VFA, visceral fat area; SMM%, percent of skeletal muscle mass; SMI, skeletal muscle index; MFR, skeletal muscle to body fat mass; SVR, skeletal muscle to visceral fat area.
aP<0.05, age- and sex-adjusted ORs are presented.
are indicative of relative muscle mass, reduced the risk of high BP, dysglycemia, and high TG, in addition to reducing the de- velopment of MS.
MS and associated morbidities include dyslipidemia, hyper- tension, type 2 diabetes mellitus, and nonalcoholic steatohepa- titis, which are known as insulin resistance syndrome. Skeletal muscle is the most abundant insulin-sensitive tissue and plays a crucial role in maintenance of systemic glucose metabolism, accounting for 85% of all insulin-mediated glucose utilization [1]. However, adipose tissue expansion is associated with ecto- pic lipid accumulation in the skeletal muscle, liver, and kidneys, as well as elevation of inflammatory adipokines and reactive oxygen species. These likely contribute to impaired insulin signaling and action in skeletal muscle, resulting in develop- ment of MS [5].
Some recent studies have reported an association between skeletal muscle and MS. Londono et al. [9] demonstrated an inverse association between thigh muscle mass and MS and a direct association between chest muscle perimeter and MS.
Atlantis et al. [10] also reported that low muscle mass and low strength were the strongest risk factors for MS, independent of abdominal fat, and other factors. However, in this study, the absolute total amount of SMM (i.e., SMM) was positively as- sociated with risk of developing MS, which conflicts with the aforementioned studies. Like SMM, SMI was positively associ- ated with MS. These results may be caused by total BFM, in- cluding VFA, which often increases with SMM [11]. In fact, in this study, BFM had a significant positive correlation with SMM and height (data not shown).
Newman et al. [11] compared two different approaches to defining sarcopenic obesity using appendicular lean mass di- vided by height squared and appendicular lean mass adjusted for both height and BFM. They assessed the relationship be- tween these two definitions of sarcopenic obesity and lower extremity function and other health-related factors. They found that the classification based on both height and fat mass was more strongly associated with lower extremity functional limi- tations and suggested that fat mass should be considered when estimating sarcopenia in overweight or obese individuals [11].
According to the Korean Longitudinal Study on Health and Aging, the ratio of lower appendicular SMM to weight was more closely associated with MS than either sarcopenia or obe- sity alone [12]. The Korean Sarcopenic Obesity Study also re- ported that the muscle to fat ratio (appendicular SMM to VFA), which was defined as a new index of sarcopenic obesity, was
negatively associated with MS (OR, 5.43; 95% CI, 2.56 to 13.34) [13,14]. The Third National Health and Nutrition Examination found that the highest quintile of SMI (the ratio of total SMM to total BW) was associated with improved insulin sensitivity and lower risk of transitional/pre- or overt diabetes [15]. Find- ings in the present study were similar to the aforementioned studies: higher SMM%, MFR, and SVR, which are indicative of relative muscle mass, were found to reduce the risk of high BP, dysglycemia, and high TG, resulting in reduced develop- ment of MS. These results suggest that relative SMM ratio to body composition (particularly body fat) is more important than absolute amount of SMM in development of MS.
In addition, among subjects who did not develop MS, the number of components of MS increased in subjects in the low- est quintile of SVR. This suggests that proportion of SMM may play a role in the early progression to MS and could also sup- port the importance of relative SMM in development of MS.
Among the anthropometric parameters, BMI and SVR were associated with all five components of MS. On the other hand, among components of MS, only high WC, which is a funda- mental component of MS, was significantly associated with all of the anthropometric parameters.
Although retrospective, this study was a cohort study, and thus showed a more powerful causal relationship between SMM and development of MS in comparison with most previously reported cross-sectional studies. In addition, the effect of SMM on development of MS was investigated using ratio of SMM to weight, total BFM, and VFA. This study showed that the rela- tive ratio of SMM to body composition is important in devel- opment of MS.
Anthropometric parameters were estimated using BIA.
Computed tomography (CT) and magnetic resonance imag- ing (MRI) are reference methods for assessment of SMM [16].
Dual-energy X-ray absorptiometry (DXA), which is well cor- related with CT and MRI, has been proposed for analysis of body composition, due to its lower cost and higher availability [17-19]. However, it has a limitation in that different densi- tometers and software versions give different estimates of body composition. In addition, DXA, as well as CT and MRI, cannot be employed for population studies, mainly because of logisti- cal problems [7]. In contrast, BIA offers a simpler and more rapid means of estimating SMM, with less radiation exposure risk than DXA [6,7]. Therefore, it is probably the better candi- date for assessment of SMM at the population level.
Modified NCEP-ATP III criteria, rather than international
diabetes federation (IDF) criteria, were used for defining MS because it has been reported that central obesity is less preva- lent in Koreans than Caucasians and the IDF criteria are infe- rior to the modified NCEP criteria in identifying high-risk pa- tients who lack central obesity [20].
This study has some limitations. This was a retrospective study and the follow-up period was relatively short. Physical activities that may affect SMM were not taken into account [21,22]. Muscle strength, which is a factor in insulin sensitivity of skeletal muscle, was not taking into account either [10].
In conclusion, decreased SMM may play a critical role in the development of MS and may have some synergic effects on increased visceral fat. Therefore, relative ratio to body compo- sition, not absolute amount of SMM, may be more predictive and important to the development of MS.
CONFLICTS OF INTEREST
No potential conflict of interest relevant to this article was re- ported.
REFERENCES
1. Bonora E, Targher G. Increased risk of cardiovascular disease and chronic kidney disease in NAFLD. Nat Rev Gastroenterol Hepatol 2012;9:372-81.
2. Despres JP. Is visceral obesity the cause of the metabolic syn- drome? Ann Med 2006;38:52-63.
3. DeFronzo RA, Jacot E, Jequier E, Maeder E, Wahren J, Felber JP. The effect of insulin on the disposal of intravenous glucose.
Results from indirect calorimetry and hepatic and femoral ve- nous catheterization. Diabetes 1981;30:1000-7.
4. Baron AD, Brechtel G, Wallace P, Edelman SV. Rates and tissue sites of non-insulin- and insulin-mediated glucose uptake in humans. Am J Physiol 1988;255(6 Pt 1):E769-74.
5. Stump CS, Henriksen EJ, Wei Y, Sowers JR. The metabolic syndrome: role of skeletal muscle metabolism. Ann Med 2006;
38:389-402.
6. Lintsi M, Kaarma H, Kull I. Comparison of hand-to-hand bio- impedance and anthropometry equations versus dual-energy X-ray absorptiometry for the assessment of body fat percent- age in 17-18-year-old conscripts. Clin Physiol Funct Imaging 2004;24:85-90.
7. Malavolti M, Mussi C, Poli M, Fantuzzi AL, Salvioli G, Battisti- ni N, Bedogni G. Cross-calibration of eight-polar bioelectrical
impedance analysis versus dual-energy X-ray absorptiometry for the assessment of total and appendicular body composition in healthy subjects aged 21-82 years. Ann Hum Biol 2003;30:
380-91.
8. National Cholesterol Education Program (NCEP) Expert Pan- el on Detection, Evaluation, and Treatment of High Blood Cholesterol in Adults (Adult Treatment Panel III). Third Re- port of the National Cholesterol Education Program (NCEP) Expert Panel on Detection, Evaluation, and Treatment of High Blood Cholesterol in Adults (Adult Treatment Panel III) final report. Circulation 2002;106:3143-421.
9. Londono FJ, Calderon JC, Gallo J. Association between thigh muscle development and the metabolic syndrome in adults.
Ann Nutr Metab 2012;61:41-6.
10. Atlantis E, Martin SA, Haren MT, Taylor AW, Wittert GA;
Members of the Florey Adelaide Male Ageing Study. Inverse associations between muscle mass, strength, and the metabolic syndrome. Metabolism 2009;58:1013-22.
11. Newman AB, Kupelian V, Visser M, Simonsick E, Goodpaster B, Nevitt M, Kritchevsky SB, Tylavsky FA, Rubin SM, Harris TB; Health ABC Study Investigators. Sarcopenia: alternative definitions and associations with lower extremity function. J Am Geriatr Soc 2003;51:1602-9.
12. Lim S, Kim JH, Yoon JW, Kang SM, Choi SH, Park YJ, Kim KW, Lim JY, Park KS, Jang HC. Sarcopenic obesity: prevalence and association with metabolic syndrome in the Korean Lon- gitudinal Study on Health and Aging (KLoSHA). Diabetes Care 2010;33:1652-4.
13. Lim KI, Yang SJ, Kim TN, Yoo HJ, Kang HJ, Song W, Baik SH, Choi DS, Choi KM. The association between the ratio of vis- ceral fat to thigh muscle area and metabolic syndrome: the Korean Sarcopenic Obesity Study (KSOS). Clin Endocrinol (Oxf) 2010;73:588-94.
14. Kim TN, Park MS, Lim KI, Yang SJ, Yoo HJ, Kang HJ, Song W, Seo JA, Kim SG, Kim NH, Baik SH, Choi DS, Choi KM. Skele- tal muscle mass to visceral fat area ratio is associated with met- abolic syndrome and arterial stiffness: The Korean Sarcopenic Obesity Study (KSOS). Diabetes Res Clin Pract 2011;93:285-91.
15. Srikanthan P, Karlamangla AS. Relative muscle mass is inverse- ly associated with insulin resistance and prediabetes. Findings from the third National Health and Nutrition Examination Survey. J Clin Endocrinol Metab 2011;96:2898-903.
16. Roche AF, Heymsfield S, Lohman TG. Human body composi- tion. Champaign: Human Kinetics; 1996. Chapter 6, Estima- tion of muscle mass; p109-28.
17. Fuller NJ, Hardingham CR, Graves M, Screaton N, Dixon AK, Ward LC, Elia M. Assessment of limb muscle and adipose tis- sue by dual-energy X-ray absorptiometry using magnetic res- onance imaging for comparison. Int J Obes Relat Metab Disord 1999;23:1295-302.
18. Levine JA, Abboud L, Barry M, Reed JE, Sheedy PF, Jensen MD.
Measuring leg muscle and fat mass in humans: comparison of CT and dual-energy X-ray absorptiometry. J Appl Physiol (1985) 2000;88:452-6.
19. Visser M, Fuerst T, Lang T, Salamone L, Harris TB. Validity of fan-beam dual-energy X-ray absorptiometry for measuring fat- free mass and leg muscle mass. Health, Aging, and Body Com- position Study: Dual-Energy X-ray Absorptiometry and Body Composition Working Group. J Appl Physiol (1985) 1999;87:
1513-20.
20. Yoon YS, Lee ES, Park C, Lee S, Oh SW. The new definition of metabolic syndrome by the international diabetes federation is less likely to identify metabolically abnormal but non-obese individuals than the definition by the revised national choles- terol education program: the Korea NHANES study. Int J Obes (Lond) 2007;31:528-34.
21. Jung JY, Han KA, Ahn HJ, Kwon HR, Lee JH, Park KS, Min KW. Effects of aerobic exercise intensity on abdominal and thigh adipose tissue and skeletal muscle attenuation in over- weight women with type 2 diabetes mellitus. Diabetes Metab J 2012;36:211-21.
22. Aoi W, Naito Y, Yoshikawa T. Dietary exercise as a novel strate- gy for the prevention and treatment of metabolic syndrome:
effects on skeletal muscle function. J Nutr Metab 2011;2011:
676208.