190 책임저자:윤정현, 609-735, 부산시 금정구 장전동 산 30
부산대학교 약학대학 약학부 Tel: 051-510-2804, Fax: 051-513-6754 E-mail: [email protected]
접수일:2010년 4월 7일, 1차 수정일:2010년 7월 14일, 2차 수정일:2010년 7월 21일, 게재승인일:2010년 7월 23일
Correspondence to:Jeong-Hyun Yoon
Department of Pharmacy, College of Pharmacy, Pusan National University, San 30, Jangjeon-dong, Geumjeong-gu, Busan 609-735, Korea Tel: +82-51-510-2804, Fax: +82-51-513-6754
E-mail: [email protected] Fig. 1. Structure of morin.
Morin Inhibits the Growth of Murine Hepatoma Cells via Cell Cycle Arrest and Induction of Apoptosis
Mi-Na Kim1, Eun-Young Ahn1, Sang Eun Park1, Mohammad Akbar Hossain1, Min Young Kim1, Jeon-Ok Moon2, Nam Deuk Kim1 and Jeong-Hyun Yoon1
1Department of Pharmacy (BK21 Program), Molecular Inflammation Research Center for Aging Intervention (MRCA),
2Department of Manufacturing Pharmacy, Research Institute for Drug Development, Pusan National University College of Pharmacy, Busan 609-735, Korea
Morin (3,5,7,2’,4’-pentahydroxyflavone) is a common dietary flavonoid that exhibits various biological activities, including anti-proliferative, anti-tumor promotion, anti-oxidative, and anti-inflammatory effects.
In the present study, we investigated the effects of morin on the cell growth and the viabilities of hepa1c1c7 murine hepatoma cells. Flow cytometric analysis showed that morin-treated cells increased sub-G1 peak accompanied by DNA cleavage and phosphatidylserine externalization, indicating early apoptosis. Flow cytometric analysis also revealed that morin treatment induced G2/M arrest in the cell cycle progression. In addition, morin treatment induced alterations in expression levels of proteins which are linked to cell cycle and apoptosis, such as cyclin B1, Cdc2, Fas, Fas ligand, Bax, Bcl-2, caspase-9, caspase-3, and poly (ADP-ribose) polymerase, in a concentration-dependent manner. Taken together, these results suggest that morin inhibit cell growth and induce cytotoxicity of murine hepatoma cells through G2/M phase arrest and apoptosis. (Cancer Prev Res 15, 190-197, 2010)
Key Words: Morin, Cell cycle, G2/M phase, Apoptosis, Hepatoma cells
INTRODUCTION
Morin (3,5,7,2’,4’-pentahydroxyflavone), a flavonol belong- ing to the group of flavonoids, is a yellowish pigment (Fig.
1) present in almonds (P. guajava L.),1) fig (Chlorophora tinctoria),2) and other plants of the Moraceae family which are used as food or herbal medicines.3) It has been known to act as a potent antioxidant,4,5) a hypouricemic agent,6) a protein kinase C inhibitor,7) a suppressor of NF-κB activation,8) and a modulator of lipoxygenase and cyclooxygenase activities in the arachidonic acid cascade.9) Besides, morin has been in- vestigated to be a potential anticancer agent, exhibiting a chemopreventive activity against rat tongue carcinogeneis in vitro and in vivo,10) inhibiting the growth human oral squa-
mous carcinoma cells,11) inhibiting proliferation of HL-60, human promyelocytic leukemia cells,12) and showing an anti- tumor promotion effect by significantly inhibiting 12-O-tetra- decanoylphobol-13-acetate (TPA)-induced Epstein-Barr virus early antigen activation and skin tumor promotion.13) Further-
more, in the hepatic model it was reported to inhibit TPA- induced hepatocellular transformation14) and recently, it was found that the cotreatment of morin with N-nitrosodieth- ylamine (DEN) in male Wistar albino rats prevented the initiation of DEN-induced hepatocarcinogenesis.15)
Tissue homeostasis is dependent on the perfect balance between cell proliferation and cell death. The balance between positive and negative signals determines whether the cell would live or die. Therefore, the imbalance which results in either unwanted cell growth or cell death can lead to various dis- eases.16) Apoptosis, known as a programmed cell death, is an essential cellular event for maintaining the homeostasis of the cellular system and normal function and it is closely linked to cell growth. Several genes are common to both processes and major determinants of cell death or cell growth are likely to be controlled by more than one signal. c-Myc, p53, pRB, Ras, PKA, PKC, Bcl-2, NF-κB, cyclin dependent kinases (CDKs), cyclins, and CDK inhibitors (CKIs) have been recognized for the linkage of cell growth and apoptosis. During apoptosis, progressions in the cell cycle are stopped through the action of caspases which cleave various cell cycle regulators including Wee1, cdc27, p21, p27, pRb, and CDK1.17) One of major molecular apoptotic mechanisms is known to be mediated through the activation of death receptors such as TNF-R1, Fas (Apo-1/CD95), DR3 (TRAMP/Apo-3), DR4 (TRAIL-R1/Apo- 2), and DR5 (TRAIL-R2).18) Among these death receptors, the signaling pathways of Fas-induced apoptosis are best charac- terized and two apoptotic pathways, type I and type II pathways, have been identified. In the type II pathway, also called the mitochondrial pathway, is a more complex signaling cascade activated and tightly regulated by multiple steps involving the disruption of mitochondrial membrane poten- tial.19)
The established cell line, hepa1c1c7 cell is a murine hepa- toma-derived cell line that preserves most of the hepatocyte properties and characteristics.20) These cells provide an invaluable biological tool that can be controlled more easily and more cheaply than transgenic animals. In the present study, we investigated the effects of morin on the cell growth and the viabilities of hepa1c1c7 murine hepatoma cells and studied molecular mechanisms mediating these effects.
MATERIALS AND METHODS 1. Chemicals and reagents
PI/RNase staining buffer for cell cycle analysis and Annexin V-FITC kit for apoptosis were purchased from BD Biosciences (Franklin Lakes, NJ, USA). Dubecco’s modified Eagle medium (DMEM), fetal bovine serum (FBS), penicillin-streptomycin, trypsin-EDTA, and PBS (pH 7.4) were obtained from Hyclone Laboratories (Logan, UT, USA). All other chemicals used were analytical reagent grade. A flavonoid compound, morin hydrate (3,5,7,2’,4’-pentahydroxyflavone, C15H10O7ㆍxH2O), was pur- chased from Sigma Chemical Co. (St. Louis, MO, USA). This compound was dissolved in ethanol to 100 mM stock solution and kept at 5oC. Further dilutions were made immediately prior to each experiment. The final concentration of ethanol did not exceed 0.1% (v/v) in the treatment range (50∼200 μg/ml), where there was no influence on the cell growth (data not shown).
2. Cell lines and cell culture
Hepa1c1c7, murine hepatoma cells were obtained from the lab of Dr. Jung YJ (Department of Manufacturing Pharmacy, Pusan National University, Busan, Korea). Throughout all ex- periments, hepa1c1c7 cells were grown in DMEM supple- mented with 10% FBS and 1% penicillin/streptomycin in 5%
CO2 humidified atmosphere at 37oC. When the culture reached about 80% confluence, cells were washed twice with PBS (pH 7.4) at 37oC and harvested with trypsin-EDTA.
3. Determination of cell viability
Cell suspensions (4,000 cells per well) of hepa1c1c7 were seeded in the 96-well flat-bottom microtiter plates and in- cubated to adhere overnight. The number of viable cells in the tested samples was measured indirectly by following metabolic product. In the WST-8 assay, we measured the amount of formazan dye that was produced in the presence of an electron carrier when a highly water soluble tetrazolium salt, WST-8 [2-(2-methoxy-4-nitrophenyl)-3-(4-nitrophenyl)-5-(2,4-disulfop henyl)-2H-tetrazolium, monosodium salt], was reduced by dehydrogenase.21) Optical density for living cells was then measured by a spectrophotometer equipped with a 450 nm filter. Each experiment was repeated at least three times.
4. Morphological changes under microscope
Hepa1c1c7 cells were seeded (2×10⁵ cells/well) into a 6-well plate and allowed to adhere overnight. The cells were incubated with 50, 100, and 200 μg/ml of morin for 24 hr. Cells in control wells were treated with an equivalent volume of ethanol. Optic phase-contrast photographs were taken with Zeiss Axiovert 100 inverted microscope (Göttingen, Germany).
5. DNA content analysis
Hepa1c1c7 cells (2×10⁵ cells/dish) were seeded in a 60 mm2 dish and allowed to adhere overnight. And then the media was replaced with fresh medium containing 50, 100, and 200 μg/
ml of morin or an equivalent volume of ethanol. After 48 hr, the cells were collected by trypsinization, and washed with pre-cooled PBS via centrifugation. They were then fixed for 1 hr in 70% ethanol (v/v), and stained with 500 μl of propidium (PI)/RNase staining buffer for 30 min at 4oC. Before analysis, cell suspension was filtered with 40 μm pore nylon mesh to remove debris. Flow cytometry analysis was performed with a FACScalibur (Becton Dickinson, San Jose, CA, USA). Each experiment was repeated at least three times.
6. Apoptotic analysis using dual annexin V-FITC/
PI staining
Hepa1c1c7 cells (2×10⁵ cells/dish) were seeded in a 60 mm2 dish and allowed to adhere overnight. And then the media was replaced with fresh medium containing 50, 100, and 200 μg/
ml of morin or with an equivalent volume of ethanol. After 24 hr and 48 hr, the cells were collected by trypsinization, and washed with pre-cooled PBS via centrifugation. The cell pellet was then resuspended in 100 μl of 1×binding buffer to make cell suspension of 1×10⁶ cells/ml and stained with 5 μl of annexin V-FITC (green color) and 10 μl of PI (50 μg/ml, red color) for 15 min at room temperature in the dark. After staining, each tube was added 400 μl of 1×binding buffer and the cells were analyzed with a FACScalibur flow cytometer at 488 nm excitation. Data from at least 10,000 events per sample were recorded and processed using the CellQuest software (Becton Dickinson).
7. Protein preparation and Western blot analysis
Hepa1c1c7 cells (2×10⁶ cells/dish) were plated in a 150 mm2 dish and allowed to adhere overnight. And then the media was
replaced with fresh medium containing 50, 100, and 200 μg/
ml of morin or with an equivalent volume of ethanol. After 48 hr, the cells were collected by trypsinization, and washed with pre-cooled PBS via centrifugation. Total cells were lysed in lysis buffer [40 mM Tris (pH 8.0), 120 mM NaCl, 0.5%
NP-40, 0.1 mM sodium orthovanadate, 2 μg/ml aprotinin, 2 μg/ml leupeptin, and 100 μg/ml phenylmethylsulfonyl fluoride (PMSF)]. The supernatant was then collected and protein concentrations were measured with a Bio-Rad protein assay reagent (Bio-Rad Laboratories, Hercules, CA, USA). Equal amount of protein extracts were denatured by boiling at 95oC for 5 min in sample buffer [0.5 M Tris-HCl (pH 6.0), 4% SDS, 20% glycerol, 0.1% bromophenol blue and 10% β-mer- captoethanol] in ratio of 1:1. Equal amount of total proteins were subjected to 6∼15% SDS-PAGE and transferred to PVDF membranes. The membranes were blocked with 5%
non-fat dry milk in TBS-T buffer [20 mM Tris, 100 mM NaCl (pH 7.5), and 0.1% Tween 20] for 1 hr at room temperature.
And then, the membranes were incubated for 1 hr with hor- seradish peroxidase-conjugated anti-rabbit or anti-mouse im- munoglobin (Santa Cruz Biotechnology Inc., Santa Cruz, CA, USA). The membranes were washed four times with TBS-T buffer for every 10 min. Antigen-antibody complexes were detected by the enhanced chemiluminescence (ECL) detection system (Amersham Biosciences Corp., Little Chalfont, Bucks, UK).
8. Statistics
Date were expressed as the mean±SD of three separate ex- periments and analyzed by Student’s t-test. The means were considered significantly different at either *p<0.05 or **p<
0.01.
RESULTS
1. Effects of morin on the cell viability and growth of hepa1c1c7 cells
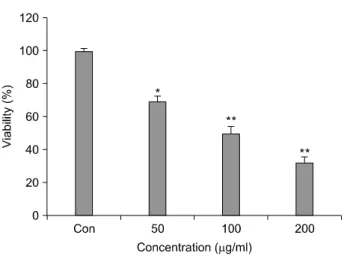
In this study, we examined the effect of morin on the viability of hepa1c1c7 cells. As shown in Fig. 2, the percentage of viable cells assayed with WST-8 was decreased as the concentration of morin increases. The IC50 value of morin in hepa1c1c7 cells was approximately 100 μg/ml. These data suggest that morin inhibit cell growth and exert cytotoxic activity against hepa1c1c7 cells.
Fig. 3. Morphological changes of hepa1c1c7 cells observed under light microscope. Exponentially growing cells were incubated either with vehicle alone (A) or with 50 (B), 100 (C), and 200 (D) μg/ml of morin for 24 hr.
Fig. 2. Effect of morin on the viability of hepa1c1c7 cells.
Hepa1c1c7 cells were treated with three (50, 100, and 200 μg/
ml) concentrations of morin for 24 hr. The data represented the percentage of cell viability by WST-8 assay. Results are expressed as percentage of the vehicle treated control±SD of three separate experiments. The significance was determined by Student’s t-test (*p<0.05 or **p<0.01 vs. untreated con- trol). Con: control.
2. Morin-induced morphological changes of hepa1c1c7 cells
To assess whether there are any morphological changes in morin-treated hepa1c1c7 cells, we examined the cells using light microscope after 24 hr of incubation with or without morin. Under the light microscope, untreated hepa1c1c7 cells spread regularly in the culture plate and grew to near confluent (Fig. 3A). In contrast, morin-treated hepa1c1c7 cells were shrunken and changed to round form. Additionally, cell numbers were decreased in a concentration-dependent manner (Fig. 3B∼D). Fig. 3B shows that hepa1c1c7 cells treated with 50 μg/ml of morin kept the normal cellular shape, being attached to the plates, even though the confluence was decreased than control. However, a significant proportion of the hepa1c1c7 cells treated with 200 μg/ml of morin, became dislodged from their plates and most of the remaining attached cells showed typical apoptotic changes in morphology, characterized by cellular shrinkage and disruption (Fig. 3D).
3. Morin-induced cell cycle modulation
To investigate whether the inhibition of hepa1c1c7 cells growth was mediated, at least in part, by regulating the cell cycle, flow cytometry analysis of PI-stained hepa1c1c7 nuclei was performed. This flow cytometry analyses data showed that
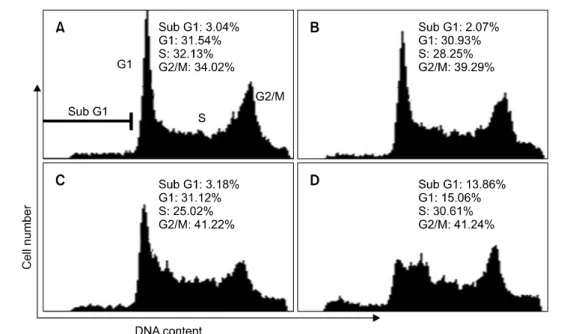
morin treatment induced the accumulation of cells in G2/M phase of the cell cycle, with the occurrence of sub-G1 peak, indicating DNA degradation through either necrosis or apoptosis (Fig. 4). G2/M phase arrest by morin treatment reached the maximum percentage at 48 hr. After 48 hr incubation with different concentrations of morin, the popul- ation of the cells at the G2/M phase increased from 34.02%
to 41.24% (Fig. 4A, D). As shown in Fig. 4, the increase of cell population in G2/M phase consequently occurred with the decrease in G0/G1 cells as compared to those of control. And we also observed the appearance of the peak corresponding to a population of cells with sub-G1 DNA content. This peak represented morin-induced DNA degradation either by necrosis or by apoptosis in hepa1c1c7 cells. After 48 hr incubation of 200 μg/ml morin, as shown in Fig. 4A, D, the fractions of sub-G1 peak increased from 3.04% to 13.86%. These result supported the morin treatment for 48 hr mainly induced the inhibition of cell growth via G2/M phase arrest in the cell cycle.
4. Assessment of morin-induced apoptosis by annexinV-FITC/PI double-staining
To determine if sub-G1 peak is attributed by either apoptosis or necrosis, flow cytometry using annexin V-FITC/PI double-staining was performed. FITC-labeled annexin V can measure phosphatidylserine (PS) externalization and, in com- bination with PI, could discriminate between apoptotic and necrotic cells. As shown in Fig. 5, lower left quadrant shows
Fig. 4. Effect of morin on cell cycle progression of hepa1c1c7 cells. Hepa1c1c7 cells were treated with vehicle alone (A) or with 50 (B), 100 (C), and 200 (D) μg/ml of morin for 48 hr. DNA content was analyzed by flow cytometry with PI staining. The cell cycle distribution was calculated as the percentage of cells contained in each phase with the CellQuest software (Becton Dickinson Instruments). All experiments were performed in tripicate and gave similar results.
Fig. 5. Annexin-FITC/PI flow cytometric histograms of hepa1c1c7 cells after treatment with morin. Hepa1c1c7 cells were treated with vehicle alone (A, E) or with 50 (B, F), 100 (C, G), and 200 (D, H) μg/ml of morin for 24 hr (A∼D) or 48 hr (E∼H). Cells were double-stained with annexin V-FITC/PI and analyzed for apoptosis by flow cytometry. Representative results from three independent experiments are shown. Con: control.
viable cells; upper left quadrant shows dead cells; lower right, annexin V positive cells (indicating early apoptosis); upper right, cells positive for both annexin V and PI (indicating late apoptosis or necrosis). After 24 hr (Fig. 5A∼D) or 48 hr (Fig.
5E∼H) incubation of hepa1c1c7 cells with 50, 100, and 200 μg/ml of morin, proportions of early apoptotic cells were increased in both time and concentration-dependent manners.
Especially, after 48 hr incubation, 50, 100, and 200 μg/ml of
Fig. 6. Effects of morin on the expression levels of cell cycle regulatory proteins in hepa1c1c7 cells. The cells were treated with 50, 100, and 200 μg/ml of morin for 48 hr. Total cell lysates were prepared and subjected to 10∼12% SDS-PAGE and electrophoretically transferred to PVDF membranes.
Western blot analysis was conducted with indicated antibodies and ECL kits. Representative results from three independent experiments are shown. β-Actin was used as a loading
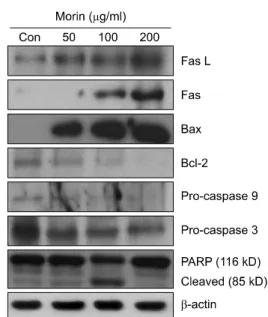
control. Con: control. Fig. 7. Effects of morin on the expression levels of apoptosis
regulatory proteins in hepa1c1c7 cells. The cells were treated with 50, 100, and 200 μg/ml of morin for 48 hr. Total cell lysates were prepared and subjected to 10∼12% SDS-PAGE and electrophoretically transferred to PVDF membranes.
Western blot analysis was conducted with indicated antibodies and ECL kits. Representative results from three independent experiments are shown. β-Actin was used as a loading control. Con: control.
morin treatment induced early apoptotic cells (annexin V+/PI-) from the base level of 14.36% to 19.94%, 24.36%, and 38.30%, respectively (Fig. 5E∼H). These results suggest that morin causes induction of apoptosis of hepa1c1c7 cells, es- pecially after 48 hr treatment.
5. The effect of morin on the expressions of cell cycle regulatory proteins
To assess the effect of morin on the intracellular protein expression levels of G2/M phase in cell cycle, we performed Western blot analysis. As shown in Fig. 6, the expression levels of cyclin B1 and cdc2 were decreased by morin treatment as compared to the basal levels. These results suggest that morin induce G2/M phase arrest in cell cycle by down-regulating expressions of cyclins and CDKs.
6. The effect of morin on the expressions of apoptosis-related proteins
To investigate whether expression levels of apoptosis-related proteins are regulated by morin in hepa1c1c7 cells, Western blot analysis was performed on Fas, Fas-L, Bax, Bcl-2, pro- caspase-9, procaspase-3, and poly (ADP-ribose) polymerase (PARP). After 48 hr of incubation with 50, 100, and 200 μg/
ml of morin, the expression levels of Fas-L and Fas were increased in a concentration-dependent manner as compared to the basal levels (Fig. 7). And the results showed that the expression level of Bcl-2, an anti-apoptotic protein, was
decreased, whereas the expression level of Bax, a pro-apoptotic protein, was increased concentration dependently (Fig. 7). The expression levels of procaspase-9 and procaspase-3 were decreased, indicating the activations of these caspases (Fig. 7).
In addition, as shown in Fig. 7, PARP cleavage, a specific marker of apoptosis, was observed in morin-treated hepa1c1c7 cells, showing a decrease of PARP along with an increase of cleaved forms. These results, taken all together, imply that morin seems to induce apoptosis through the mitochondrial pathway which involves Fas-signaling.
DISCUSSION AND CONCLUSION
In the hepatic model, morin has been studied to show hepatoprotective effects based on its various activities, including antioxidant effects,4) anti-transformation or anti-cancer effect inhibiting TPA-induced-hepatocellular transformation or DEN- induced carcinogenesis.14,15) Additionally, it was reported to minimize adverse effects attributed by anti-tumor drugs such as doxorubicin and mitomycin C when used together.22) The meta-hydroxyl groups on morin could be correlated with these
activities in vivo and in vitro experiments.23)
However, there is little available information on the mol- ecular mechanisms of cytotoxicity of morin toward tumor cells in hepatic model. Therefore, in this study, we investigated the effects of morin on the cell growth and viabilities of hepa1c1c7 cells and studied molecular mechanisms mediating these effects.
Hepa1c1c7 cell is a murine hepatoma-derived cell line that preserves most of the hepatocyte properties and charac- teristics.20) In our results, IC50 of morin was found to be approximately 100 μg/ml by cytotoxicity assay. DNA content analysis by flow cytometry showed that the fractions of G2/M phase arrest and the size of sub-G1 peak were increased after 48 hr treatment. During G2/M transition in the cell cycle, the cyclin-dependent protein kinase complex, cdc2-cyclin B1 com- plex, plays a critical role.24) When hepa1c1c7 cells were treated with morin for 48 hr, the expressions of cyclin B1 and cdc2 were decreased, seemingly causing G2/M phase arrest.
Furthermore, our results demonstrated that time-dependent effect on cell viability by various concentrations of morin, disturbing the growth of hepa1c1c7 cells at 24 hr (data not shown) and decreasing the percentage of viable cells after 48 hr. In particular, this decrease in cell viabilities by morin seems to be mediated through the induction of apoptosis, given that the cells treated with morin showed morphological charac- teristics of apoptosis such as cellular shrinkage and DNA cleavage. In addition, during the very early period of apoptosis, there occurs a loss of membrane asymmetry and phospha- tidylserine (PS), which distributed asymmetrically between inner and outer leaflets of the plasma membrane of live cells, becomes exposed on the outside surface of the plasma membrane.25) Therefore, our findings of annexin V staining which assessed PS externalization by measuring annexin binding to PS of the plasma membrane, also indicate that morin induced apoptosis, especially early phase of apoptosis.
Recent studies have described the existence of two types of Fas (APO-1/CD95)-signaling apoptotic pathways that depend on the amount of active caspase-8 produced at the death inducing signal complex.26) Type I pathway are characterized by abund- ant recruitment of procaspase-8 to the DISC following Fas ligation, resulting in subsequent direct activation of executioner caspases in a Bcl-2/Bcl-xL-insensitive fashion.18) In contrast, in type II pathway, also called the mitochondrial pathway, amounts of active caspase-8 generated at the DISC are very low, and apoptosis in these cells is believed to depend on Bcl-2
or Bcl-xL-regulated translocation of cytochrome c (cyt c) from the mitochondria to the cytosol. Once released, cyt c binds to Apaf-1, inducing it to associate with procaspase-9, and thereby triggering its auto-activation into a mature form, which in turn directly cleaves procaspase-3 and -7.26) This mitochondrial apoptotic pathway is largely mediated through Bcl-2 family proteins, which include both pro-apoptotic members such as Bax, Bak, and BNIP3 that promote mitochondrial per- meability, and anti-apoptotic members such as Bcl-2 and Bcl-xL that inhibit their effects or inhibit the mitochondrial release of cyt c.27) When hepa1c1c7 cells were treated with morin for 48 hr, the expression levels of Bcl-2, procaspase-9, procaspase-3, and PARP were decreased, whereas Bax, Fas- ligand, Fas, and cleavage of PARP were increased in a con- centration-dependent manner. These changes of expression levels of proteins, taken together, demonstrate that morin induced apoptosis through the mitochondrial pathway, Fas- signaling type II pathway.
In conclusion, the data presented in this study indicate that morin could cause the G2/M phase arrest of hepa1c1c7 cells and induce apoptosis of tumor cells via the Fas-signaling type II pathway. Thus this study provides a valuable information on the molecular mechanisms by which morin inhibits cell growth and induces apoptosis in murine hepatoma cells.
ACKNOWLEDGEMENT
This work was supported for two years by Pusan National University Research Grant.
REFERENCES
1) Wijeratne SS, Abou-Zaid MM, Shahidi F. Antioxidant poly- phenols in almond and its coproducts. J Agric Food Chem 54, 312-318, 2006.
2) Aggarwal BB, Shishodia S. Morecular targets of dietary agents for prevention and therapy of cancer. Biochiem Pharmacol 71, 1397-1421, 2006.
3) Xie MX, Long M, Liu Y, Qin C, Wang YD. Characterisation of the interaction of human serum albumin and morin. Biochim Biophys Acta 1760, 1184-1191, 2006.
4) Wu TW, Zeng LH, Wu J, Fung KP. Morin hydrate is a plant derived antioxidant-based hepatoprotector. Life Sci 53, 213- 218, 1993.
5) Wu TW, Zeng LH, Wu J, Fung KP. Morin: wood pigment that protects three types of human cells in the cardiovascular
system against oxyradical damage. Biochem Pharmacol 47, 1099-1103, 1994.
6) Yu Z, Fong WP, Cheng CH. The dual actions of moriin (3,5,7,2’,4’-pentahydroxyl flavones) as a hypouricemic agent:
uricosuric effect and xanthine oxidase inhibitory activity. J Pharmacol Exp Ther 316, 169-175, 2006.
7) Kempuraj D, Madhappan B, Christodoulou S, Boucher W, Cao J, Papadopoulou N, Cetrulo CL, Theoharides TC.
Flavonoids inhibit proinflammatory mediator release, intra- cellular calcium ion levels, and protein kinase C theta phosphorylation in human mast cells. Br J Pharmacol 145, 934-944, 2005.
8) Manna SK, Aggarwal RS, Sethi G, Aggarwal BB, Ramash GT. Morin (3,5,7,2’,4’-pentahydroxyflavone) abolishes nuclear factor-κB activation induced by various carcinogens and inflam- matory stimuli, leading to suppression of nuclear factor-κB- regulated gene expression and up-regulation of apoptosis. Clin Cancer Res 13, 2290-2297, 2007.
9) Laughton MJ, Evans PJ, Moroney MA, Hoult JR, Halliwell B. Inhibition of mammalian 5-lipoxygenase and cyclo-oxy- genase by flavonoids and phenolic dietary additives: Rela- tionship to antioxidant activity and to iron ion-reducing ability. Biochem Pharmacol 42, 1673-1681, 1991.
10) Kawabata K, Tanaka T, Honjo S, Kakumoto M, Hara A, Makita H, Tatematsu N, Ushida J, Tsuda H, Mori H.
Chemopreventive effect of dietary flavonoid morin on chemi- cally induced rat tongue carcinogenesis. Int J Cancer 83, 381- 386, 1999.
11) Brown J, O’Prey J, Harrison PR. Enhanced sensitivity of human oral tumors to the flavonol, morin, during cancer progression: involvement of the Akt and stress kinase pathways. Carcinogenesis 24, 171-177, 2003.
12) Kuo HM, Chang LS, Lin YL, Lu HF, Yang JS, Lee JH, Chung JG. Morin inhibits the growth of human leukemia HL-60 cells via cell cycle arrest and induction of apoptosis through mitochondria dependent pathway. Anticancer Res 27, 395-406, 2007.
13) Iwase Y, Takemura Y, Ju-ichi M, Muainaka T, Ichiishi E, Ito C. Inhibitory effect of flavonoid derivatives on Epstein-Barr virus activation and two stage carcinogensis of skin tumors.
Cancer Lett 173, 105-109, 2001.
14) Hsiang CY, Wu SL, Ho TY. Morin inhibits 12-O-tetrade- canoylphorbol-13-acetate-induced hepatocellular transforma- tion via activator protein 1 signaling pathway and cell cycle progression. Biochem Pharmacol 69, 1603-1611, 2005.
15) Sivaramakrishnan V, Shilpa PN, Praveen Kumar VR, Niranjali Devaraj S. Attenuation of N-nitrosodiethylamine-induced he-
patocellular carcinogenesis by a novel flavonol-morin. Chem Biol Interact 171, 79-88, 2008.
16) Vermeulen K, Berneman ZN, Van Bockstaele DR. Cell cycle and apoptosis. Cell Prolif 36, 165-175, 2003.
17) Jacotot E, Ferri KF, Kroemer G. Apoptosis and cell cycle:
distinct checkpoints with overlapping upstream control. Pathol Biol 48, 271-279, 2000.
18) Schmitz I, Kirchhoff S, Krammer PH. Regulation of death re- ceptor-mediated apoptosis pathways. Int J Biochem Cell Biol 32, 1123-1136, 2000.
19) Scaffidi C, Fulda S, Srinivasan A, Friesen C, Li F, Tomaselli KJ, Debatin KM, Krammer PH, Peter ME. Two CD95 (APO-1/Fas) signaling pathways. EMBO J 17, 1675-1687, 1998.
20) Dere E, Boverhof DR, Burgoon LD, Zacharewski TR. In vivo- in vitro toxicogenomic comparison of TCDD-elicited gene ex- pression in Hepa1c1c7 mouse hepatoma cells and C57BL/6 hepatic tissue. BMC Genomics 7, 80, 2006.
21) Kanemura Y, Mori H, Kobayashi S, Islam O, Kodama E, Yamamoto A, Nakanishi Y, Arita N, Yamasaki M, Okano H, Hara M, Miyake J. Evaluation of in vitro proliferative activity of human fetal neural stem/progenitor cells using indirect measurements of viable cells based on cellular metabolic activity. J Neurosci Res 69, 869-879, 2002.
22) Kok LD, Wong YP, Wu TW, Chan HC, Kwok TT, Fung KP. Morin hydrate a potential antioxidant in minimizing the free-radicals-mediated damage to cardiovascular cells by anti- tumor drugs. Life Sci 67, 91-99, 2000.
23) Rubery PH. Phytotropins: receptors and endogenous ligands.
Symp Soc Exp Biol 44, 119-146, 1990.
24) Ito Y, Takeda T, Sakon M, Monden M, Tsujimoto M, Matsuura N. Expression and prognostic role of cyclin-depen- dent kinase 1 (cdc2) in hepatocellular carcinoma. Oncology 59, 68-74, 2000.
25) Glander HJ, Schaller J. Binding of annexin V to plasma mem- branes of human spermatozoa: a rapid assay for detection of membrane changes after cryostorage. Mol Hum Reprod 5, 109- 115, 1999.
26) Scaffidi C, Schmitz I, Zha J, Korsmeyer SJ, Krammer PH, Peter ME. Differential modulation of apoptosis sensitivity in CD95 type I and type II cells. J Biol Chem 274, 22532-22538, 1999.
27) Jürgensmeier JM, Xie Z, Deveraux Q, Ellerby L, Bredesen D, Reed JC. Bax directly induces release of cytochrome c from isolated mitochondria. Proc Natl Acad Sci USA 95, 4997-5002, 1998.