Presumed Regional Incidence Rate of Out-of-Hospital Cardiac Arrest in Korea
The regional incidence rates of out-of-hospital cardiac arrest (OHCA) were traditionally calculated with the residential population as the denominator. The aim of this study was to estimate the true incidence rate of OHCA and to investigate characteristics of regions with overestimated and underestimated OHCA incidence rates. We used the national OHCA database from 2006 to 2010. The nighttime residential and daytime transient populations were investigated from the 2010 Census. The daytime population was calculated by adding the daytime influx of population to, and subtracting the daytime outflow from, the nighttime residential population. Conventional age-standardized incidence rates (CASRs) and daytime corrected age-standardized incidence rates (DASRs) for OHCA per 100,000 person-years were calculated in each county. A total of 97,291 OHCAs were eligible. The age-standardized incidence rates of OHCAs per 100,000 person-years were 34.6 (95% CI:
34.3-35.0) in the daytime and 24.8 (95% CI: 24.5-25.1) in the nighttime among males, and 14.9 (95% CI: 14.7-15.1) in the daytime, and 10.4 (95% CI: 10.2-10.6) in the nighttime among females. The difference between the CASR and DASR ranged from 35.4 to -11.6 in males and from 6.1 to -1.0 in females. Through the Bland-Altman plot analysis, we found the difference between the CASR and DASR increased as the average CASR and DASR increased as well as with the larger daytime transient population. The conventional incidence rate was overestimated in counties with many OHCA cases and in metropolitan cities with large daytime population influx and nighttime outflow, while it was underestimated in residential counties around metropolitan cities.
Keywords: Out-of-Hospital Cardiac Arrest; Incidence; Epidemiology
Young Sun Ro,1 Seung-sik Hwang,2Sang Do Shin,3 Daikwon Han,4 Sungchan Kang,2 Kyoung Jun Song,3 and Sung-il Cho5
1Laboratory of Emergency Medical Services, Seoul National University Hospital Biomedical Research Institute, Seoul; 2Department of Social & Preventive Medicine, Inha University School of Medicine, Incheon; 3Department of Emergency Medicine, Seoul National University College of Medicine, Seoul; 4Department of Epidemiology & Biostatistics, Texas A&M University, College Station, TX, USA;
5Department of Preventive Medicine, Graduate School of Public Health, Seoul National University, Seoul, Korea
Received: 3 May 2015 Accepted: 23 June 2015 Address for Correspondence:
Seung-sik Hwang, MD
Department of Social & Preventive Medicine, Inha University School of Medicine, 366 Seohae-daero, Jung-gu, Incheon 22332 Korea
Tel: +82.32-890-0972, Fax: +82.2-766-1185 E-mail: cyberdoc@inha.ac.kr
Funding: This study was financially supported by the Seoul Metropolitan City Government (2008), the Korean Centers for Disease Control and Prevention (CDC) (2009-2013) and the National Emergency Management Agency (NEMA) (2008-2013) (Grant No. 0720090210 and No. 0720100440).
http://dx.doi.org/10.3346/jkms.2015.30.10.1396 • J Korean Med Sci 2015; 30: 1396-1404
INTRODUCTION
Out-of-hospital cardiac arrest (OHCA) is a global health prob- lem and incidences of OHCA vary greatly across different re- gions not only within countries but also between countries (1- 4). Resource allocation to improve OHCA survivals targets com- munities with either high incidences or low survival rates. To implement effective community interventions, the true inci- dence rates and survival outcomes of OHCA must be evaluated.
Previous OHCA studies have extensively reported on the def- inite temporal variability and time-geographic distribution pat- terns (5-8). Epidemiological reports support the circadian vari- ability with a daytime excess and overnight nadir in the occur- rence of OHCAs (5-7, 9). Furthermore, incidence and mortality are not uniformly distributed geographically; distinct hot spots exist in which these variables are greater than expected (1, 8, 10-13). Understanding temporal variability and geographic dis- tribution observations provides a framework that may lead to the maximization of the benefits of interventions to increase the
probability of a favorable outcome (5, 9, 12-14).
The regional OHCA incidence rates were traditionally calcu- lated with the number of incidence cases in the region as the nominator and the residential population as the denominator (population at risk during a specific period of time) (1-3, 8-13).
Based on the regional OHCA incidence rates, interventions to improve OHCA outcomes, including ambulances and auto- nomic external defibrillators, were strategized and provided in high-risk regions. However, it is possible that certain areas may have more transient persons at risk during the daytime hours, resulting in a higher absolute number of arrests (12). For exam- ple, town centers concentrated with a large number of offices, railway stations and international airports were reported as hot spots for OHCA with an unexpected cluster attributing to the influx of daytime transient population and nonresident arrests (8, 15).
The daytime transient population who migrate inter-regions
for work or school during the daytime hours should be consid-
ered to calculate the incidence rate of acute medical events such
Occupation & Environmental Medicineas OHCA. The accurate measurement of event incidence may not be informative in determining the prevalence of chronic diseases, but it is a crucial component in effective resource al- location when developing community interventions for acute medical illness. Furthermore, because OHCAs have circadian variability and geographic distribution patterns, the daytime transient population should be considered to calculate the re- gional incidence rate in order to determine the true high risk population (2, 5-8, 15). To date, there have been few studies that incorporated the daytime transient population in calculations to investigate the OHCA incidence rate.
The goal of this study was to estimate the true regional inci- dence rate of OHCA in Korea and to investigate the characteris- tics of the regions with large differences between the previously reported rate and the newly calculated incidence rate that con- siders nighttime residential population and daytime transient population as population at risk.
MATERIALS AND METHODS
Data source and settingThe cardiovascular disease surveillance (CAVAS) database is a large-scale, nationwide, retrospective observational database of patients in Korea who have experienced confirmed OHCA (16- 19). The database is population-based and contains emergency medical service (EMS)-assessed OHCAs among the entire pop- ulation of the country. The cases were abstracted from the am- bulance run sheets in which an OHCA was coded. For this study, data from January 2006 to December 2010 were used.
Ambulance run sheets are electronically stored in each pro- vincial EMS headquarter, which is operated by the respective fire department. Trained medical record reviewers visited the study hospitals and reviewed the medical records to collect in- formation related to risks and outcomes using the Utstein guide- lines for reporting cardiac arrest and resuscitation data (20). All reviewers were formally trained and were provided with an op- eration manual to accurately abstract the data from the medical records and transcribe the data onto case report forms.
The Korean EMS system is single tiered and sponsored by the government. Basic-to-intermediate service level of ambulances are operated by 16 provincial headquarters of the national fire department. There are approximately 1,350 ambulance stations across the nation, which serve 48 million people over an area of approximately 100,000 square kilometers. The annual run vol- ume of the prehospital service was slightly greater than 1.4 mil- lion. Two or three crew members usually ride in each ambulance.
Study population
Korea is comprised of 248 counties, the boundaries of which are defined by statute for geographical administrative purpos- es. The counties are classified as metropolitan (Gu), urban (Si),
and rural (Gun) according to their population size. The metro- politan counties (Gu) are segmented administrative districts of a metropolitan city (for example, Seoul) with populations of more than 500,000; the urban counties (Si) are located in urban areas with populations of more than 100,000; the rural counties (Gun) are located in rural areas with populations of less than 100,000.
There were 95 metropolitan, 67 urban, and 86 rural counties in 2010, and the median population sizes and population densities of each level were 298,748 residents (range: 47,260 to 640,732) and 8,873.0 people per square kilometer (range: 358.5 to 28,731.2) in metropolitan (Gu) counties, 183,673 residents (range: 41,395 to 565,201) and 531.7 people per square kilometer (range: 60.9 to 9,226.6) in urban (Si) counties, and 41,481 residents (range:
7,737 to 185,811) and 77.0 people per square kilometer (range:
19.4 to 495.7) in rural (Gun) counties (16). Each county has its own health care authorities and administrative authorities that serve the population.
Eligible patients were hospital record-confirmed OHCA pa- tients during the five years of the study period. Each OHCA was assigned to a county according to the location of collapse because neighborhood factors including bystanders’ early response, near- est autonomic external defibrillators, and prompt EMS resusci- tative efforts are critical to survival outcomes. If a case was miss- ing data on the location of collapse, the address of fire depart- ment that had the response ambulance was used. The time and date of the call received at dispatch was used as a surrogate mea- sure for the time of OHCA occurrence (5). The time of day was divided into two 12-hr time intervals (0601-1800, 1801-0600), which were defined as daytime (0601-1800) and nighttime (1801- 0600) to maintain comparability with previous reports (5).
Outcome measure
Information about the Korean population was obtained from the Korea Census data (Supplementary Table). The nighttime residential and daytime transient populations were investigated in the 2010 Census. The daytime transient population was cal- culated based on internal migration statistics as provided by the Korean National Statistical Office (KNSO). The KNSO reports such statistics based on survey results from 10% of the sampled population.
The nighttime population was the same as the registered res- idential population. The daytime population was defined by add- ing the daytime influx of population to the nighttime residential population and subtracting the daytime outflow. The D index (Daytime population index) was defined as the ratio of the day- time population to the nighttime population and was calculat- ed by dividing the daytime population by the nighttime popula- tion and multiplying the result by 100.
The conventional age-standardized incidence rates (CASRs)
for EMS-assessed OHCA per 100,000 person-years by gender
were calculated for each county using the total nighttime popu-
lation in 2010 as the standard population. Daytime corrected age-standardized incidence rates (DASR) of EMS-assessed OH- CA per 100,000 person-years were calculated with standardized daytime incidence rates and standardized nighttime incidenc- es. To reflect the actual risk population, the daytime incidences were calculated from the OHCAs that occurred during the day- time and from the daytime population, and the nighttime inci- dences were calculated from the OHCAs that occurred during the nighttime and from the nighttime population.
Statistical analysis
The distributions of categorical variables are reported as per- centages. The continuous variables that were not distributed normally are presented as medians with interquartile ranges.
The CASRs and DASRs are presented in quintiles. Bland-Alt- man plots were used to compare the CASRs and DASRs by gen-
der. The CASR, DASR, D index, the daytime and nighttime pop- ulation, and the number of OHCAs during the 5 yr were used to evaluate the characteristics of the regions with the greatest and smallest differences between the CASR and the DASR by gen- der. Geographical maps of the CASRs and DASRs by gender were evaluated in order to identify the differences in the geographi- cal distribution using administrative boundaries.
Ethics statement
The study was approved by the institutional review board (IRB) of the Seoul National University Hospital (IRB No. 1206-063-414).
Informed consent was waived by the board.
RESULTS
There were 97,291 eligible EMS-assessed OHCA cases during
Table 1. Epidemiologic characteristics of out-of-hospital cardiac arrest patientsParameters Total Male Female
P value
N % N % N %
97,291 63,162 34,129
Age
Years, median (IQR) 65 (49-76) 61 (48-73) 72 (55-81)
< 0.01 Primary ECG
Shockable*
Non-shockable† 3,389
93,902 3.5
96.5 2,504
60,658 4.0
96.0 885
33,244 2.6
97.4
< 0.01
Etiology
Presumed cardiac
Non-cardiac 72,273
25,018 74.3
25.7 45,982
17,180 72.8
27.2 26,291
7,838 77.0
23.0
< 0.01
Year 2006 2007 2008 2009 2010
15,745 17,391 19,333 21,530 23,292
16.2 17.9 19.9 22.1 23.9
10,248 11,427 12,470 14,054 14,963
16.2 18.1 19.7 22.3 23.7
5,497 5,964 6,863 7,476 8,329
16.1 17.5 20.1 21.9 24.4
0.02
Season
Spring (Mar to May) Summer (Jun to Aug) Fall (Sep to Nov) Winter (Dec to Feb)
24,226 23,027 24,677 25,361
24.9 23.7 25.4 26.1
15,746 15,299 15,933 16,184
24.9 24.2 25.2 25.6
8,480 7,728 8,744 9,177
24.8 22.6 25.6 26.9
< 0.01
Hour 0001-0600 0601-1200 1201-1800 1801-2400
15,406 33,529 28,558 19,798
15.8 34.5 29.4 20.3
10,548 21,375 18,453 12,786
16.7 33.8 29.2 20.2
4,858 12,154 10,105 7,012
14.2 35.6 29.6 20.5
< 0.01
Arrest witnessed
Witnessed 37,154 38.2 24,603 39.0 12,551 36.8
< 0.01 Bystander CPR
CPR 2,078 2.1 1,424 2.3 654 1.9 < 0.01
Interval from call to EMS arrival
Minute, Median (IQR) 6 (5-9) 7 (5-10) 6 (5-9)
< 0.01 Interval from call to hospital arrival
Minute, Median (IQR) 22 (16-30) 22 (16-31) 21 (16-29)
< 0.01 Outcome
ROSC
Survival to admission Survival to discharge Good CPC
15,365 9,113 2,937 831
15.8 9.4 3.0 0.9
9,867 5,796 2,061 608
15.6 9.2 3.3 1.0
5,498 3,317 876 223
16.1 9.7 2.6 0.7
0.05
< 0.01
< 0.01
< 0.01
*Shockable ECG, ventricular fibrillation, ventricular tachycardia; †Non-shockable ECG, asystole, pulseless electrical activity. CPR, cardiopulmonary resuscitation; ECG, electrocar- diogram; ROSC, return of spontaneous circulation; CPC, cerebral performance category scale; IQR, interquartile range.
Fig. 1. Time distribution of out-of-hospital cardiac arrest. OHCA, out-of-hospital car- diac arrest.
Number of OHCA
Hour
0 2 4 6 8 10 12 14 16 18 20 22
5,000 4,000 3,000 2,000 1,000 0
Time distribution of OHCA
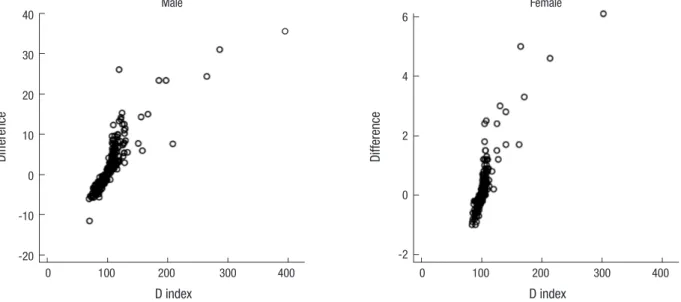
Fig. 2. Bland-Altman plots of conventional age-standardized rates and daytime corrected age-standardized rates by gender. CASR, conventional age-standardized rate per 100,000 person-years; DASR, daytime corrected age-standardized rate per 100,000 person-years.
Difference (CASRm-DASRm)
Average of CASRm and DASRm
0 20 40 60 80 100 150 200 250
60 40 20 0 -20
Agreement between CASR and DASR of male 11/232 = 4.74% outside the limits of agreement
Mean Diff = -3.50 + 0.10*Average Limits ± 2.46* (0.92 + 0.04*Average)
Agreement between CASR and DASR of female 19/232 = 8.19% outside the limits of agreement
Mean Diff = -0.03 + 0.04*Average Limits ± 2.46* (0.01 + 0.01*Average)
Difference (CASRf-DASRf)
Average of CASRf and DASRf
0 20 40 60 80 100 150 200 250
20 15 10 5 0
Fig. 3. Scatter plots of the D index and the difference between the conventional age-standardized rates and daytime corrected age-standardized rates. D index = daytime pop- ulation/nighttime residential population *100.
Difference
D index
0 100 200 300 400
6
4
2
0
-2
Female
Difference
D index
0 100 200 300 400
40 30 20 10 0 -10 -20
Male
the study period. The characteristics of the patients, communi- ty, EMS factors, and survival outcomes for OHCAs are present- ed by gender in Table 1.
Of the OHCAs, 34.5% and 29.4% occurred during the daytime hours from 6 AM to noon and from noon to 6 PM, respectively, whereas 20.3% and 15.8% occurred during the nighttime hours from 6 PM to midnight and from midnight to 6 AM, respectively (Fig. 1). In Korea, the age-standardized incidence rates of OH- CAs per 100,000 person-years by gender and occurrence time were 34.6 (95% CI: 34.3-35.0) during the daytime and 24.8 (95%
CI: 24.5-25.1) during the nighttime among males, and 14.9 (95%
CI: 14.7-15.1) during the daytime and 10.4 (95% CI: 10.2-10.6) during the nighttime among females.
The mean CASR and DASR per 100,000 person-years of each
county by gender were 69.2 (range 14.0-180.7) and 66.8 (range
14.7-154.6) in males and 30.8 (range 7.8-65.2) and 30.6 (range 7.8-64.6) in females, respectively.
Bland-Altman plots of the CASRs and DASRs by gender are shown in Fig. 2. In both genders, there were positive linear trends between the average CASR and DASR and the difference be- tween the CASR and DASR. The difference between the CASR and DASR increased as the average CASR and DASR increased.
Scatter plots of the D index and the difference between the CASR and DASR by gender are presented in Fig. 3. The differ- ence between the CASR and DASR ranged from 35.4 to -11.6 in males and from 6.1 to -1.0 in females. There were positive linear trends between the D index and the difference between the CA- SR and DASR in both genders. The difference between the CASR and the DASR increased as the D index increased.
The characteristics of the 5 regions with the greatest and the 5 regions with the smallest differences between the CASR and the DASR are evaluated in Table 2. The 5 regions with the great- est differences between the CASR and the DASR had larger D index, indicating larger daytime population and smaller night- time population, while the regions with the smallest differences had small D index for both genders. Nine of the 10 regions with the greatest differences and 7 of the 10 regions with the smallest difference between the CASR and the DASR were in metropoli- tan area (-gu in county name).
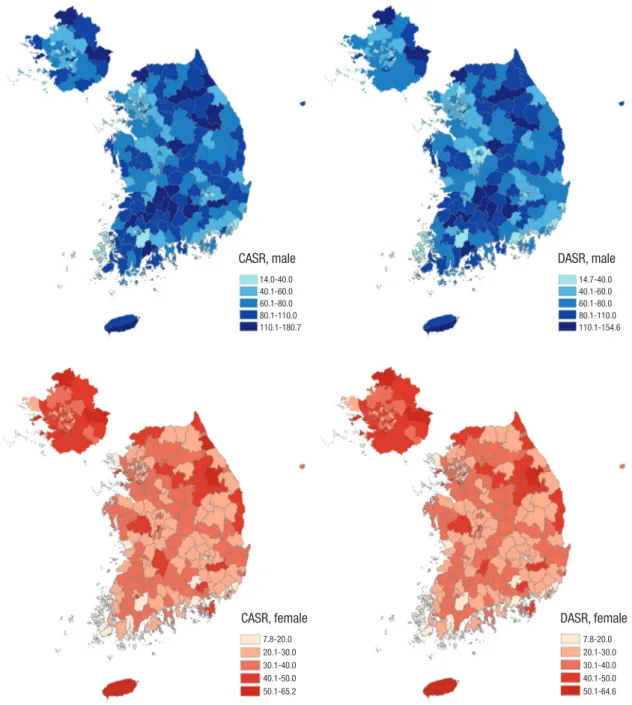
Fig. 4 shows the geographical distribution of the annual CASRs and DASRs of EMS-assessed OHCAs per 100,000 person-years by gender. Several metropolitan counties had large differences between the CASR and DASR.
DISCUSSION
Defining the at-risk population was essential to measure the disease burden based on the incidence rate. The incidence rates varied depending on the denominator of the at-risk population.
In this study, the difference between the CASR and DASR per 100,000 person-year ranged from 35.4 to -11.6 in males and from 6.1 to -1.0 in females. Although many studies have explored the incidence of OHCA, only a few equivalent quantitative studies have elucidated the differences between the nighttime popula- tion and the daytime transient population as the denominators when measuring OHCA incidence.
There were significant temporal and geographical variations in the OHCA incidence. A daytime excess and an overnight na- dir of OHCAs was observed, which is generally consistent with previous studies regardless of the characteristics of the patients and arrest circumstances (5-7, 9). In this study, 63.9% of OHCAs occurred during the daytime, comparable to the value of 59.6%
reported in the ROC study (5). The greater occurrence of OHCAs
Table 2. Characteristics of the highest and lowest 5 regions of differences between conventional age-standardized rates and daytime corrected age-standardized rates per 100,000 person-yearsCounty name* CASR DASR Difference D index† Daytime population
Residential population
OHCA at daytime‡
OHCA at nighttime§ Male
Highest 5
1 Jung-gu, Seoul 104.5 69.1 35.4 396 226,128 57,113 186 137
2 Gangseo-gu, Busan 96.5 65.4 31.1 287 74,180 25,887 86 49
3 Jinan-gun, Jeonbuk 180.7 154.6 26.1 119 11,333 9,489 80 19
4 Jongno-gu, Seoul 87.0 62.6 24.4 265 192,662 72,607 210 133
5 Jung-gu, Busan 107.9 84.5 23.4 197 44,513 22,547 89 67
Lowest 5
1 Jung-gu, Ulsan 56.1 67.7 -11.6 70 76,796 109,287 174 98
2 Suji-gu, Yongin 29.3 35.4 -6.1 70 100,074 143,750 102 87
3 Dobong-gu, Seoul 47.2 53.0 -5.8 74 122,103 165,782 212 187
4 Yangcheon-gu, Seoul 48.7 54.5 -5.8 77 172,640 224,554 272 202
5 Wonmi-gu, Bucheon 52.6 58.3 -5.7 78 163,030 210,326 247 198
Female Highest 5
1 Jung-gu, Seoul 51.0 44.9 6.1 302 179,850 59,518 81 73
2 Jung-gu, Busan 49.8 44.8 5.0 165 40,076 24,338 47 28
3 Jongno-gu, Seoul 35.3 30.7 4.6 214 164,942 77,228 84 57
4 Jung-gu, Daegu 40.8 37.5 3.3 171 63,899 37,410 57 42
5 Dong-gu, Gwangju 41.7 38.7 3.0 130 68,594 52,621 84 41
Lowest 5
1 Gwangmyoung-si, Gyonggi 31.5 32.5 -1.0 84 139,488 166,161 129 76
2 Euiwang-si, Gyonggi 27.7 28.7 -1.0 90 64,490 72,047 56 28
3 Hanam-si, Gyonggi 32.7 33.6 -0.9 91 62,450 68,435 54 46
4 Jungrang-gu, Seoul 29.6 30.5 -0.9 84 171,525 203,021 150 107
5 Dobong-gu, Seoul 28.0 28.8 -0.8 86 151,752 177,448 133 85
*County name was classified as metropolitan (-gu), urban (-si), and rural (-gun) area; †D index = daytime population/nighttime residential population *100; ‡OHCA at daytime is the number of OHCAs occurred at daytime in each gender during 5 yr; §OHCA at nighttime is the number of OHCAs occurred at nighttime in each gender during 5 yr. CASR, con- ventional age-standardized rate per 100,000 person-years; DASR, daytime corrected age-standardized rate per 100,000 person-years, OHCA; out-of-hospital cardiac arrest.
Fig. 4. Geographical maps of conventional age-standardized rates and daytime corrected age-standardized rates by gender. CASR, conventional age-standardized rate per 100,000 person-years; DASR, daytime corrected age-standardized rate per 100,000 person-years.
CASR, male
14.0-40.0 40.1-60.0 60.1-80.0 80.1-110.0 110.1-180.7
CASR, female
7.8-20.0 20.1-30.0 30.1-40.0 40.1-50.0 50.1-65.2
DASR, male
14.7-40.0 40.1-60.0 60.1-80.0 80.1-110.0 110.1-154.6
DASR, female
7.8-20.0 20.1-30.0 30.1-40.0 40.1-50.0 50.1-64.6
during the day may be associated with endogenous rhythms and environmental factors, including temperature (21, 22). Nu- merous epidemiological reports support the finding that there is circadian variability with a daytime excess and an overnight nadir in the occurrence of OHCA, as well as a seasonal variation with lower incidence rates in the summer and higher rates in the winter months in both hemispheres (5-7, 9, 21). Furthermore, this circadian and seasonal variability affected the survival out- comes with the lowest survival to discharge rate when the OHCA occurred during the 0001-0600 time interval and the highest during the 1201-1800 time interval, while the odds of survival to
discharge were statistically lower during the winter and spring (5, 9, 23). These results may be due to an association between the survival outcomes of OHCA and temporal variability in the capabilities of EMS and hospital resources (21, 22).
The nationwide OHCA registry includes geographic and tem-
poral information for all OHCAs. The two maps in this study show
the regional OHCA incidences by gender with the different po-
pulation denominators. The differences between the CASR and
the DASR of OHCA were greater in counties with a larger day-
time transient population. The regions with the greatest differ-
ence between the CASR and the DASR had large D index values,
indicating larger daytime population and smaller nighttime po- pulation, while the regions with the smallest differences between the CASR and the DASR had small D index values in both gen- ders, indicating smaller daytime population and larger nighttime population. Most (16 out of 20) of the regions with the greatest and smallest differences between the CASR and the DASR in both genders were in a metropolitan area (Gu) with a large mi- grating population. In other words, the CASR in a commercial and industrial area of a metropolitan city with a large daytime population influx and a nighttime outflow was overestimated, whereas the CASR in a residential area of a metropolitan city with a nighttime population influx was underestimated. In ad- dition, the Bland-Altman plots indicated that the differences be- tween the CASRs and the DASRs tended to increase as the inci- dence of OHCA increased. Many studies have identified high- risk hot spots of OHCA (11, 12). A previous study reported an unexpected cluster at town centers, railway stations and inter- national airports (8, 15). Although the incidences may have been affected by the daytime transient population and nonresident arrests, the daytime transient population was not considered due to the difficulty in measuring this population. In order to accurately estimate the burden of OHCA that integrates the char- acteristics of daytime excess and hot spots with daytime transient population, the denominator for calculating the OHCA regional incidences should be the true population at risk (2, 5-8, 15).
These findings have many public health implications such as resource allocation for the chain of survival including cost-effec- tive public access automatic external defibrillator (AED) strate- gy, planning ambulance deployment, organizing targeted car- diopulmonary resuscitation (CPR) training, raising community awareness, and mobilizing community action (5, 8). Recognition and consideration of temporal and geographical characteristics of OHCA is crucial in developing such public health measures and would greatly increase their effectiveness. Recent studies have demonstrated that the best outcomes are achieved when devices are placed in areas with a high incidence of cardiac ar- rests and when there is ongoing supervision of emergency plans.
However, operational decisions based on conventional incidence rate analysis can be limited. For example, AEDs had been dis- seminated in public places such as airports, train stations, and public buildings based on incidence rate with conventional me- thods (8, 24-26). However, the publicly placed AED could not cover the majority of OHCA, because the true incidence rates in residential areas were underestimated and 65% to 80% of OH- CAs occur in residential areas (27, 28). In this study, the conven- tional incidence rate was found to be overestimated in a com- mercial and industrial area of a metropolitan city with a large daytime population influx and a nighttime outflow, while the conventional incidence rate was underestimated in a residen- tial area of a metropolitan city with a nighttime population in- flux. Areas with a greater incidence rate of OHCA based on the
true at-risk population should be allocated more resources, such as bystander CPR education programs to reduce CPR initiation time, implementation of public access AED programs to short- en the time to defibrillation, and ambulances for the fastest am- bulance response times (1, 12, 29). Thus, community interven- tions such as neighborhood access defibrillators and commu- nity first responder programs for cardiac arrest should be con- sidered based on the true regional incidence rate.
Our study has limitations. Temporal variability studies of OH- CA are limited by their ability to accurately determine the pre- cise time of OHCA occurrence. The daytime transient popula- tion was not confirmed of its validity, as the data was based on the internal migration statistics, which were the reported statis- tics of 10% sampled population provided by the Korean Nation- al Statistical Office. We accounted the daytime transient popu- lation as circadian variability into two 12-hr time intervals. The present studies are a prelude to further analysis to understand the causes of these variations as well as the implementation of targeted interventions to reduce the variability (3, 4).
In conclusion, this study was conducted in a nationwide set- ting to demonstrate that the regional incidence rate consider- ing the daytime transient population is different from the con- ventional incidence rate of OHCA. Conventional incidence rate was found to be overestimated in counties that had many cases of cardiac arrest and in metropolitan cities with a large daytime population influx and a nighttime outflow, while the rate was underestimated in a residential area of a metropolitan city with a nighttime population influx. An accurate estimation of the burden of OHCA is essential for effective resource allocation strategies and appropriate resource planning for community support, which would enhance survival outcomes of cardiac arrest.
DISCLOSURES
All of the authors have no conflicts of interest to disclose.
AUTHOR CONTRIBUTION
Conception and design: Ro YS, Hwang SS. Performed the ex- periments: Ro YS, Hwang SS, Shin SD, Kang S. Analysis of data:
Ro YS, Hwang SS, Kang S. Contributed reagents/materials/anal- ysis tools: Ro YS, Hwang SS, Kang S. Writing: Ro YS, Hwang SS.
Shin SD, Han D, Song KJ, Cho SI. Agree with manuscript results and conclusions: all authors
ORCID
Young Sun Ro http://orcid.org/0000-0003-3634-9573
Seung-sik Hwang http://orcid.org/0000-0002-1558-7831
Sang Do Shin http://orcid.org/0000-0003-4953-2916
Daikwon Han http://orcid.org/0000-0001-7509-015X Sungchan Kang http://orcid.org/0000-0002-4876-3205 Kyoung Jun Song http://orcid.org/0000-0002-0027-6352 Sung-Il Cho http://orcid.org/0000-0003-4085-1494 REFERENCES
1. Soo L, Huff N, Gray D, Hampton JR. Geographical distribution of cardi- ac arrest in Nottinghamshire. Resuscitation 2001; 48: 137-47.
2. Berdowski J, Berg RA, Tijssen JG, Koster RW. Global incidences of out- of-hospital cardiac arrest and survival rates: Systematic review of 67 pro- spective studies. Resuscitation 2010; 81: 1479-87.
3. Nichol G, Thomas E, Callaway CW, Hedges J, Powell JL, Aufderheide TP, Rea T, Lowe R, Brown T, Dreyer J, et al. Regional variation in out-of- hospital cardiac arrest incidence and outcome. JAMA 2008; 300: 1423- 31.
4. Galea S, Blaney S, Nandi A, Silverman R, Vlahov D, Foltin G, Kusick M, Tunik M, Richmond N.; Resuscitation Outcomes Consortium Investi- gators. Explaining racial disparities in incidence of and survival from out-of-hospital cardiac arrest. Am J Epidemiol 2007; 166: 534-43.
5. Brooks SC, Schmicker RH, Rea TD, Aufderheide TP, Davis DP, Morri- son LJ, Sahni R, Sears GK, Griffiths DE, Sopko G, et al.; ROC Investiga- tors. Out-of-hospital cardiac arrest frequency and survival: evidence for temporal variability. Resuscitation 2010; 81: 175-81.
6. Willich SN, Goldberg RJ, Maclure M, Perriello L, Muller JE. Increased onset of sudden cardiac death in the first three hours after awakening.
Am J Cardiol 1992; 70: 65-8.
7. Thakur RK, Hoffmann RG, Olson DW, Joshi R, Tresch DD, Aufderheide TP, Ip JH. Circadian variation in sudden cardiac death: effects of age, sex, and initial cardiac rhythm. Ann Emerg Med 1996; 27: 29-34.
8. Ong ME, Earnest A, Shahidah N, Ng WM, Foo C, Nott DJ. Spatial varia- tion and geographic-demographic determinants of out-of-hospital car- diac arrests in the city-state of Singapore. Ann Emerg Med 2011; 58: 343- 51.
9. Yasunaga H, Miyata H, Horiguchi H, Tanabe S, Akahane M, Ogawa T, Koike S, Imamura T. Population density, call-response interval, and sur- vival of out-of-hospital cardiac arrest. Int J Health Geogr 2011; 10: 26.
10. Lerner EB, Fairbanks RJ, Shah MN. Identification of out-of-hospital car- diac arrest clusters using a geographic information system. Acad Emerg Med 2005; 12: 81-4.
11. Sasson C, Keirns CC, Smith D, Sayre M, Macy M, Meurer W, McNally BF, Kellermann AL, Iwashyna TJ; CARES (Cardiac Arrest Registry to En- hance Survival) Study Group. Small area variations in out-of-hospital cardiac arrest: does the neighborhood matter? Ann Intern Med 2010; 153:
19-22.
12. Sasson C, Cudnik MT, Nassel A, Semple H, Magid DJ, Sayre M, Keseg D, Haukoos JS, Warden CR; Columbus Study Group. Identifying high-risk geographic areas for cardiac arrest using three methods for cluster anal- ysis. Acad Emerg Med 2012; 19: 139-46.
13. Strömsöe A, Svensson L, Claesson A, Lindkvist J, Lundström A, Herlitz J.
Association between population density and reported incidence, charac- teristics and outcome after out-of-hospital cardiac arrest in Sweden. Re- suscitation 2011; 82: 1307-13.
14. Peberdy MA, Ornato JP, Larkin GL, Braithwaite RS, Kashner TM, Carey
SM, Meaney PA, Cen L, Nadkarni VM, Praestgaard AH, et al.; National Registry of Cardiopulmonary Resuscitation Investigators. Survival from in-hospital cardiac arrest during nights and weekends. JAMA 2008; 299:
785-92.
15. Iwami T, Hiraide A, Nakanishi N, Hayashi Y, Nishiuchi T, Uejima T, Mori- ta H, Shigemoto T, Ikeuchi H, Matsusaka M, et al. Outcome and charac- teristics of out-of-hospital cardiac arrest according to location of arrest:
A report from a large-scale, population-based study in Osaka, Japan. Re- suscitation 2006; 69: 221-8.
16. Ro YS, Shin SD, Song KJ, Lee EJ, Kim JY, Ahn KO, Chung SP, Kim YT, Hong SO, Choi JA, et al. A trend in epidemiology and outcomes of out-of-hos- pital cardiac arrest by urbanization level: a nationwide observational study from 2006 to 2010 in South Korea. Resuscitation 2013; 84: 547-57.
17. Na SH, Shin SD, Ro YS, Lee EJ, Song KJ, Park CB, Kim JY. Specific activity types at the time of event and outcomes of out-of-hospital cardiac arrest:
a nationwide observational study. J Korean Med Sci 2013; 28: 320-7.
18. Kim TH, Shin SD, Kim YJ, Kim CH, Kim JE. The scene time interval and basic life support termination of resuscitation rule in adult out-of-hospi- tal cardiac arrest. J Korean Med Sci 2015; 30: 104-9.
19. Ro YS, Shin SD, Song KJ, Park CB, Lee EJ, Ahn KO, Cho SI. A compari- son of outcomes of out-of-hospital cardiac arrest with non-cardiac etiol- ogy between emergency departments with low- and high-resuscitation case volume. Resuscitation 2012; 83: 855-61.
20. Jacobs I, Nadkarni V, Bahr J, Berg RA, Billi JE, Bossaert L, Cassan P, Coo- vadia A, D’Este K, Finn J, et al.; International Liaison Committee on Re- suscitation; American Heart Association; European Resuscitation Coun- cil; Australian Resuscitation Council; New Zealand Resuscitation Coun- cil; Heart and Stroke Foundation of Canada; InterAmerican Heart Foun- dation; Resuscitation Councils of Southern Africa; ILCOR Task Force on Cardiac Arrest and Cardiopulmonary Resuscitation Outcomes. Car- diac arrest and cardiopulmonary resuscitation outcome reports: update and simplification of the Utstein templates for resuscitation registries: a statement for healthcare professionals from a task force of the Interna- tional Liaison Committee on Resuscitation (American Heart Association, European Resuscitation Council, Australian Resuscitation Council, New Zealand Resuscitation Council, Heart and Stroke Foundation of Cana- da, InterAmerican Heart Foundation, Resuscitation Councils of South- ern Africa). Circulation 2004; 110: 3385-97.
21. Deo R, Albert CM. Epidemiology and genetics of sudden cardiac death.
Circulation 2012; 125: 620-37.
22. Empana JP, Sauval P, Ducimetiere P, Tafflet M, Carli P, Jouven X. Increase in out-of-hospital cardiac arrest attended by the medical mobile inten- sive care units, but not myocardial infarction, during the 2003 heat wave in Paris, France. Crit Care Med 2009; 37: 3079-84.
23. Arntz HR, Willich SN, Schreiber C, Brüggemann T, Stern R, Schultheiss HP. Diurnal, weekly and seasonal variation of sudden death. Population- based analysis of 24,061 consecutive cases. Eur Heart J 2000; 21: 315-20.
24. Caffrey SL, Willoughby PJ, Pepe PE, Becker LB. Public use of automated external defibrillators. N Engl J Med 2002; 347: 1242-7.
25. Valenzuela TD, Roe DJ, Nichol G, Clark LL, Spaite DW, Hardman RG.
Outcomes of rapid defibrillation by security officers after cardiac arrest in casinos. N Engl J Med 2000; 343: 1206-9.
26. Hallstrom AP, Ornato JP, Weisfeldt M, Travers A, Christenson J, McBur- nie MA, Zalenski R, Becker LB, Schron EB, Proschan M, et al.; Public Access Defibrillation Trial Investigators. Public-access defibrillation
and survival after out-of-hospital cardiac arrest. N Engl J Med 2004; 351:
637-46.
27. Eisenberg MS, Mengert TJ. Cardiac resuscitation. N Engl J Med 2001;
344: 1304-13.
28. Norris RM; UK Heart Attack Study Collaborative Group. Circumstances of out of hospital cardiac arrest in patients with ischaemic heart disease.
Heart 2005; 91: 1537-40.
29. Semple HM, Cudnik MT, Sayre M, Keseg D, Warden CR, Sasson C; Co- lumbus Study Group. Identification of high-risk communities for unat- tended out-of-hospital cardiac arrests using GIS. J Community Health 2013; 38: 277-84.
Supplementary Table. Nighttime residential and daytime population by county Gu code
Male Female
Residential
population Daytime
influx Daytime
outflow Daytime
population Residential
population Daytime
influx Daytime
outflow Daytime population
11010 72,607 141,155 21,100 192,662 77,228 103,056 15,342 164,942
11020 57,113 184,897 15,882 226,128 59,518 131,865 11,533 179,850
11030 102,709 70,368 36,192 136,885 114,118 45,456 25,974 133,600
11040 141,147 61,906 52,133 150,920 147,169 35,025 36,391 145,803
11050 171,652 53,560 63,629 161,583 183,831 37,019 46,900 173,950
11060 165,326 77,815 55,325 187,816 171,203 57,237 36,994 191,446
11070 192,673 26,524 73,791 145,406 203,021 18,375 49,871 171,525
11080 216,596 53,926 79,522 191,000 232,015 57,124 53,559 235,580
11090 154,574 20,447 56,026 118,995 165,126 18,703 37,408 146,421
11100 165,782 19,404 63,083 122,103 177,448 17,445 43,141 151,752
11110 278,279 45,324 101,400 222,203 300,025 40,284 60,277 280,032
11120 214,058 24,491 75,146 163,403 230,020 17,523 51,498 196,045
11130 145,596 58,126 51,319 152,403 159,805 68,298 36,510 191,593
11140 171,362 93,596 61,906 203,052 189,706 62,255 47,533 204,428
11150 224,554 37,963 89,877 172,640 236,906 28,012 53,163 211,755
11160 259,300 55,823 96,351 218,772 278,602 32,444 61,945 249,101
11170 197,161 89,380 72,059 214,482 201,868 47,886 46,750 203,004
11180 114,044 68,639 36,012 146,671 114,769 32,404 22,825 124,348
11190 183,136 156,930 63,115 276,951 189,754 88,920 41,282 237,392
11200 188,704 55,757 71,667 172,794 198,568 40,589 52,274 186,883
11210 252,791 42,277 92,462 202,606 254,785 30,934 65,377 220,342
11220 183,047 172,617 66,011 289,653 202,870 100,085 44,319 258,636
11230 242,717 337,376 73,525 506,568 275,216 218,630 47,804 446,042
11240 304,457 89,598 107,585 286,470 329,905 52,605 67,084 315,426
11250 223,933 35,167 84,382 174,718 233,412 23,227 51,882 204,757
21010 22,547 28,054 6,088 44,513 24,338 20,108 4,370 40,076
21020 55,137 14,869 17,035 52,971 59,829 14,040 11,497 62,372
21030 44,475 23,082 13,304 54,253 47,831 20,742 8,656 59,917
21040 67,500 14,292 16,816 64,976 69,798 5,207 11,370 63,635
21050 179,457 49,591 58,218 170,830 195,128 45,801 33,933 206,996
21060 125,982 24,886 44,621 106,247 136,115 21,326 28,245 129,196
21070 139,637 38,978 39,669 138,946 148,348 23,028 25,588 145,788
21080 144,757 13,823 55,009 103,571 152,241 9,876 29,025 133,092
21090 192,634 27,255 63,010 156,879 210,344 22,877 32,452 200,769
21100 164,246 33,157 44,536 152,867 172,448 17,168 24,730 164,886
21110 116,963 30,661 35,011 112,613 125,587 25,456 22,198 128,845
21120 25,887 54,135 5,842 74,180 25,666 13,856 3,516 36,006
21130 95,928 25,272 33,849 87,351 104,119 20,684 22,356 102,447
21140 78,781 12,529 28,151 63,159 88,393 11,358 17,851 81,900
21150 121,528 53,325 36,630 138,223 124,340 27,423 22,230 129,533
21310 44,761 15,344 11,560 48,545 47,512 5,325 6,347 46,490
22010 34,181 32,378 9,327 57,232 37,410 32,555 6,066 63,899
22020 153,009 24,830 42,698 135,141 161,515 12,685 26,472 147,728
22030 102,020 23,136 30,818 94,338 105,419 12,500 20,921 96,998
22040 78,577 18,780 22,950 74,407 87,409 15,549 16,459 86,499
22050 219,195 49,080 55,737 212,538 225,453 26,863 29,591 222,725
22060 211,021 27,945 64,223 174,743 226,664 21,574 36,133 212,105
22070 289,817 51,790 76,358 265,249 302,229 31,934 41,430 292,733
22310 81,907 22,440 23,377 80,970 83,333 8,532 13,514 78,351
23010 40,691 42,481 7,639 75,533 40,676 21,096 4,789 56,983
23020 35,556 16,723 12,165 40,114 36,680 6,811 7,585 35,906
23030 202,316 43,011 62,134 183,193 205,369 27,588 36,300 196,657
23040 134,135 29,944 47,732 116,347 136,888 17,092 24,838 129,142
23050 219,663 65,941 62,919 222,685 229,999 32,355 34,836 227,518
(continued to the next page)
Gu code
Male Female
Residential
population Daytime
influx Daytime
outflow Daytime
population Residential
population Daytime
influx Daytime
outflow Daytime population
23060 262,517 43,455 81,219 224,753 273,786 26,821 45,413 255,194
23070 162,160 22,534 53,427 131,267 168,808 16,172 30,105 154,875
23080 191,639 48,776 48,578 191,837 193,433 16,929 26,337 184,025
23310 26,698 5,123 2,238 29,583 29,059 1,782 1,383 29,458
23320 7,056 1,602 225 8,433 6,651 193 154 6,690
24010 50,387 23,998 9,916 64,469 52,621 22,765 6,792 68,594
24020 145,854 27,058 35,997 136,915 154,990 17,973 24,553 148,410
24030 101,341 12,639 27,675 86,305 110,797 13,044 18,823 105,018
24040 229,771 28,137 49,911 207,997 241,910 19,590 31,749 229,751
24050 178,838 31,668 34,412 176,094 183,259 16,282 20,574 178,967
25010 119,311 23,397 31,273 111,435 122,319 14,608 19,801 117,126
25020 121,984 21,141 32,480 110,645 129,538 19,796 19,070 130,264
25030 237,763 30,567 61,017 207,313 254,292 25,544 34,547 245,289
25040 146,502 42,244 25,691 163,055 139,860 24,770 14,136 150,494
25050 100,065 33,000 23,636 109,429 100,754 13,277 14,891 99,140
26010 109,287 8,418 40,909 76,796 109,001 6,622 18,583 97,040
26020 164,656 44,403 35,223 173,836 163,486 26,125 13,407 176,204
26030 84,044 19,186 9,708 93,522 77,741 5,512 5,289 77,964
26040 84,637 31,979 19,140 97,476 81,116 9,070 9,766 80,420
26310 92,890 36,273 22,072 107,091 91,212 10,058 11,503 89,767
31011 140,565 11,464 39,246 112,783 142,684 5,911 17,495 131,100
31012 146,132 15,142 39,828 121,446 149,390 7,721 19,013 138,098
31013 102,299 16,531 26,407 92,423 106,790 10,745 13,930 103,605
31014 128,360 31,035 32,141 127,254 127,547 12,137 14,219 125,465
31021 113,467 15,793 31,228 98,032 115,004 8,649 16,612 107,041
31022 121,673 12,723 28,288 106,108 123,106 4,821 13,685 114,242
31023 218,821 48,254 79,369 187,706 235,938 26,400 39,129 223,209
31030 199,661 27,085 63,494 163,252 211,256 18,121 32,311 197,066
31041 124,034 19,588 41,294 102,328 127,855 13,378 23,195 118,038
31042 164,754 34,299 62,222 136,831 173,572 17,425 33,155 157,842
31051 210,326 17,732 65,028 163,030 221,431 11,697 34,298 198,830
31052 105,579 10,265 35,021 80,823 110,708 6,383 19,491 97,600
31053 91,668 5,166 25,209 71,625 93,763 2,265 12,916 83,112
31060 157,492 22,985 63,875 116,602 166,161 10,532 37,205 139,488
31070 187,523 41,489 22,164 206,848 189,368 13,204 9,935 192,637
31080 43,682 6,002 10,352 39,332 45,933 3,498 5,463 43,968
31091 185,111 24,074 41,403 167,782 185,007 10,582 17,627 177,962
31092 163,880 41,204 32,092 172,992 160,693 14,863 13,983 161,573
31101 180,036 20,139 53,463 146,712 188,775 8,697 27,182 170,290
31103 120,106 15,083 34,850 100,339 131,645 7,824 18,169 121,300
31104 128,447 11,201 39,040 100,608 138,734 6,183 17,149 127,768
31110 31,729 18,681 12,585 37,825 33,777 9,996 7,660 36,113
31120 88,704 19,990 33,946 74,748 93,788 12,758 19,002 87,544
31130 255,972 27,682 77,189 206,465 265,694 10,682 40,969 235,407
31140 90,633 15,493 32,596 73,530 89,370 8,814 14,720 83,464
31150 201,324 63,999 48,483 216,840 189,303 19,090 22,216 186,177
31160 133,136 27,533 49,192 111,477 138,495 14,474 25,344 127,625
31170 69,945 16,454 28,688 57,711 72,047 8,877 16,434 64,490
31180 67,748 19,148 21,854 65,042 68,435 6,839 12,824 62,450
31191 96,821 24,689 14,052 107,458 96,923 10,800 6,327 101,396
31192 172,175 30,128 51,477 150,826 180,780 13,819 21,142 173,457
31193 143,750 9,313 52,989 100,074 151,620 6,660 22,001 136,279
31200 159,477 38,933 27,749 170,661 161,022 11,823 15,857 156,988
31210 93,047 17,605 9,586 101,066 97,626 7,703 4,325 101,004
(continued to the next page) Supplementary Table. Continued
Gu code
Male Female
Residential
population Daytime
influx Daytime
outflow Daytime
population Residential
population Daytime
influx Daytime
outflow Daytime population
31220 87,798 20,957 8,804 99,951 86,962 9,658 4,246 92,374
31230 106,383 36,943 24,009 119,317 108,667 11,501 12,326 107,842
31240 239,202 114,637 49,986 303,853 232,544 40,868 23,442 249,970
31250 111,197 34,834 24,385 121,646 111,227 9,943 13,932 107,238
31260 90,053 19,676 22,461 87,268 91,575 8,590 12,843 87,322
31270 66,600 24,949 4,923 86,626 67,420 9,875 3,061 74,234
31320 48,158 8,133 3,782 52,509 50,873 3,846 2,285 52,434
31350 19,791 3,578 1,736 21,633 20,247 1,187 1,108 20,326
31370 24,516 4,704 1,346 27,874 25,100 1,369 848 25,621
31380 39,506 4,240 4,441 39,305 41,580 1,510 2,518 40,572
32010 131,843 6,013 8,821 129,035 139,075 3,935 3,541 139,469
32020 150,461 8,885 10,243 149,103 155,242 3,859 3,730 155,371
32030 105,051 3,917 4,949 104,019 109,276 1,835 1,989 109,122
32040 43,679 1,939 4,004 41,614 44,444 805 1,287 43,962
32050 25,836 1,155 2,219 24,772 25,060 193 718 24,535
32060 37,949 1,895 3,939 35,905 41,530 1,214 1,435 41,309
32070 32,631 3,459 1,447 34,643 33,306 1,051 674 33,683
32310 30,124 3,551 679 32,996 31,141 1,306 441 32,006
32320 18,000 4,036 947 21,089 19,098 1,868 733 20,233
32330 17,035 2,628 555 19,108 17,496 471 263 17,704
32340 18,253 2,703 326 20,630 18,743 1,009 136 19,616
32350 17,958 2,826 278 20,506 17,510 699 139 18,070
32360 20,309 1,105 925 20,489 20,920 256 399 20,777
32370 9,261 1,675 167 10,769 9,517 497 100 9,914
32380 8,816 727 87 9,456 9,122 195 39 9,278
32390 13,651 1,047 124 14,574 13,387 191 64 13,514
32400 12,202 2,690 597 14,295 12,965 837 612 13,190
32410 12,031 2,003 771 13,263 12,472 703 511 12,664
33011 116,828 6,713 18,721 104,820 121,554 4,284 8,988 116,850
33012 204,344 9,099 32,479 180,964 211,296 5,374 14,067 202,603
33020 98,102 6,811 5,424 99,489 100,689 2,737 2,099 101,327
33030 65,348 4,395 5,569 64,174 66,969 1,862 1,209 67,622
33310 70,180 32,419 13,990 88,609 70,490 14,687 7,942 77,235
33320 14,139 1,914 285 15,768 15,900 1,008 122 16,786
33330 23,585 4,314 2,009 25,890 25,181 1,479 773 25,887
33340 21,786 2,673 505 23,954 23,575 859 292 24,142
33350 30,146 11,197 2,616 38,727 28,914 3,908 1,180 31,642
33360 14,778 3,528 662 17,644 16,093 1,040 451 16,682
33370 41,830 14,002 2,324 53,508 39,560 5,114 1,302 43,372
33380 13,513 2,828 510 15,831 14,260 533 231 14,562
33390 15,145 3,940 2,980 16,105 15,611 1,968 1,717 15,862
34010 282,346 22,871 35,029 270,188 278,695 13,541 13,734 278,502
34020 57,623 7,368 4,087 60,904 61,864 4,782 2,212 64,434
34030 46,910 2,112 1,211 47,811 49,122 344 602 48,864
34040 138,025 37,276 11,688 163,613 132,960 14,092 5,921 141,131
34050 77,622 6,922 3,340 81,204 75,700 2,472 1,661 76,511
34060 55,782 8,276 3,031 61,027 60,249 4,166 1,804 62,611
34070 19,240 3,538 4,576 18,202 20,623 1,460 2,476 19,607
34310 25,219 8,338 1,327 32,230 26,855 3,555 837 29,573
34320 40,488 11,223 4,457 47,254 39,346 4,908 2,335 41,919
34330 31,506 2,908 1,355 33,059 34,974 1,286 699 35,561
34340 24,952 2,407 683 26,676 28,131 864 337 28,658
34350 13,874 1,688 524 15,038 15,390 604 315 15,679
34360 39,180 3,799 1,457 41,522 41,873 2,363 484 43,752
Supplementary Table. Continued
(continued to the next page)
Gu code
Male Female
Residential
population Daytime
influx Daytime
outflow Daytime
population Residential
population Daytime
influx Daytime
outflow Daytime population
34370 36,837 3,453 2,037 38,253 39,594 1,159 1,121 39,632
34380 25,764 2,655 506 27,913 27,299 739 330 27,708
34390 69,687 11,079 1,958 78,808 64,484 2,243 827 65,900
35011 171,563 5,886 21,419 156,030 184,497 3,437 8,984 178,950
35012 138,124 7,696 19,793 126,027 144,332 4,347 7,827 140,852
35020 128,098 10,159 6,590 131,667 127,999 3,120 3,275 127,844
35030 141,903 12,320 12,879 141,344 149,003 7,017 5,338 150,682
35040 51,145 3,997 2,333 52,809 57,216 1,725 924 58,017
35050 36,516 2,087 1,129 37,474 41,117 951 475 41,593
35060 38,687 8,047 3,373 43,361 43,260 3,356 2,171 44,445
35310 40,832 17,621 6,176 52,277 40,638 7,452 4,161 43,929
35320 9,489 2,091 247 11,333 10,698 680 168 11,210
35330 10,222 1,045 177 11,090 11,352 244 75 11,521
35340 8,967 1,105 218 9,854 10,223 455 167 10,511
35350 10,755 2,983 579 13,159 12,585 1,121 338 13,368
35360 11,319 1,184 333 12,170 13,646 629 216 14,059
35370 24,506 2,126 512 26,120 28,143 771 394 28,520
35380 23,289 2,422 816 24,895 26,840 745 360 27,225
36010 121,495 5,565 22,547 104,513 124,666 3,969 8,424 120,211
36020 130,886 6,952 2,843 134,995 134,570 1,152 1,362 134,360
36030 124,232 6,233 17,954 112,511 130,443 3,462 4,367 129,538
36040 36,180 9,548 3,200 42,528 41,067 5,418 2,066 44,419
36060 68,917 13,278 3,979 78,216 66,770 2,305 2,197 66,878
36310 18,980 5,655 2,277 22,358 21,394 2,802 1,198 22,998
36320 12,128 3,700 304 15,524 14,666 1,149 204 15,611
36330 10,157 968 275 10,850 11,985 354 124 12,215
36350 28,365 1,531 288 29,608 34,304 465 263 34,506
36360 17,879 1,975 567 19,287 21,770 1,162 340 22,592
36370 28,705 4,528 4,616 28,617 32,690 2,901 2,339 33,252
36380 16,229 973 262 16,940 19,090 439 177 19,352
36390 15,418 1,111 327 16,202 18,284 422 127 18,579
36400 30,452 2,338 408 32,382 34,647 1,023 265 35,405
36410 27,807 16,756 1,190 43,373 27,378 4,047 995 30,430
36420 32,258 8,355 4,935 35,678 34,887 5,733 3,073 37,547
36430 14,112 2,379 466 16,025 16,466 930 266 17,130
36440 22,604 2,777 384 24,997 25,381 816 199 25,998
36450 17,564 5,439 1,148 21,855 19,555 2,008 820 20,743
36460 21,869 869 63 22,675 24,295 96 50 24,341
36470 12,972 547 109 13,410 15,206 122 31 15,297
36480 15,826 1,428 97 17,157 16,987 464 117 17,334
37011 125,624 6,194 3,866 127,952 120,979 1,217 2,078 120,118
37012 124,633 3,066 4,614 123,085 129,591 1,019 2,417 128,193
37020 122,090 20,028 8,251 133,867 127,880 7,443 3,559 131,764
37030 60,301 4,002 3,924 60,379 65,233 1,700 1,874 65,059
37040 78,720 3,212 4,237 77,695 84,919 1,003 1,337 84,585
37050 200,094 33,483 11,560 222,017 194,387 10,926 5,964 199,349
37060 52,055 1,913 2,441 51,527 54,999 668 678 54,989
37070 44,894 8,598 2,902 50,590 48,078 2,823 1,490 49,411
37080 46,046 3,440 1,461 48,025 50,628 1,249 897 50,980
37090 32,268 1,519 1,745 32,042 35,646 718 737 35,627
37100 128,309 41,719 21,101 148,927 129,878 27,484 11,530 145,832
37310 9,130 2,369 305 11,194 10,507 801 161 11,147
37320 23,005 2,346 396 24,955 27,491 921 204 28,208
37330 11,278 1,507 173 12,612 12,465 446 80 12,831
Supplementary Table. Continued
(continued to the next page)
Gu code
Male Female
Residential
population Daytime
influx Daytime
outflow Daytime
population Residential
population Daytime
influx Daytime
outflow Daytime population
37340 7,578 570 92 8,056 8,786 165 58 8,893
37350 16,349 1,098 297 17,150 19,582 483 204 19,861
37360 17,112 2,724 841 18,995 20,510 1,456 443 21,523
37370 14,912 5,636 1,821 18,727 15,898 1,812 981 16,729
37380 17,039 5,067 861 21,245 18,929 1,959 402 20,486
37390 56,211 17,387 16,218 57,380 55,115 8,032 6,674 56,473
37400 19,707 1,884 516 21,075 22,665 677 241 23,101
37410 14,870 1,780 416 16,234 15,964 417 287 16,094
37420 22,210 1,068 230 23,048 24,057 179 170 24,066
37430 3,860 70 2 3,928 3,759 11 20 3,750
38010 241,086 20,940 13,768 248,258 236,504 4,470 6,700 234,274
38020 190,816 7,361 14,553 183,624 197,189 3,067 4,612 195,644
38030 160,799 7,782 15,019 153,562 170,282 4,571 5,941 168,912
38040 82,164 5,219 8,790 78,593 82,336 1,026 3,000 80,362
38050 63,510 5,295 6,368 62,437 63,324 1,250 1,542 63,032
38060 51,580 8,927 5,254 55,253 53,432 2,582 2,520 53,494
38070 237,462 44,338 40,325 241,475 242,208 14,477 14,280 242,405
38080 46,053 4,010 2,643 47,420 51,467 1,290 1,022 51,735
38090 119,016 10,067 2,094 126,989 104,363 1,512 887 104,988
38100 121,707 28,478 23,971 126,214 125,505 10,274 11,173 124,606
38310 11,401 1,613 422 12,592 13,675 686 197 14,164
38320 28,666 12,013 3,503 37,176 30,270 2,866 1,815 31,321
38330 25,078 3,779 1,574 27,283 28,963 1,246 559 29,650
38340 24,803 5,884 2,243 28,444 25,813 1,338 625 26,526
38350 19,724 1,020 345 20,399 23,567 275 135 23,707
38360 19,055 2,754 930 20,879 22,225 834 371 22,688
38370 14,533 1,740 820 15,453 17,003 1,279 422 17,860
38380 17,252 852 313 17,791 20,238 322 177 20,383
38390 26,535 1,032 498 27,069 29,947 231 74 30,104
38400 19,280 1,813 335 20,758 23,788 621 231 24,178
39010 192,832 3,022 5,786 190,068 201,949 1,873 3,454 200,368
39020 62,614 5,697 2,938 65,373 65,866 3,454 1,877 67,443
Supplementary Table. Continued