INTRODUCTION
Physical inactivity is an important risk factor for all-cause, cardiovascular (CV) and cancer mortality in both men and women (1, 2). Epidemiologic evidences have shown strong associations between physical fitness (fitness), measured by maximal exercise testing, and survival from CV and non-CV causes (1-4).
Fitness, a physiologic attribute, quantifies the ability of the body to transport and use oxygen and is determined prin- cipally by training status and, to some extent, by genetic pre- disposition (5). Physical activity (PA) is a behavioral attribute and comprises the energy expenditure from volitional or non- volitional activity throughout the day (5). Whereas fitness can be directly and accurately quantified with graded exer- cise tests, the measure of PA pattern has relied on cruder methods, such as self-reports, motion detectors (i.e., Caltrac) (6), or structured interviews (7). Although fitness is often used as an indicator of PA, there has been recent debate as to whether daily PA patterns largely determine one’s fitness and therefore its inverse association with mortality, or whether fitness level predicts mortality, independent of PA patterns (8). Most of these issues have been evaluated in asymptomat- ic Caucasians and other ethnic population (9-11) or patients with existing cardiovascular disease (5). It has not been well studied as to whether PA and fitness are independent deter-
minants of all-cause mortality in Korean subjects.
Chronic smoking usually induces elevated myocardial work and reduces exercise capacity and thus impairs overall cardiopulmonary fitness (12). In addition, it is a well estab- lished risk factor for mortality. Accordingly, chronic smok- ing reduces one’s fitness level and therefore might influence on the association between physical fitness and mortality.
Furthermore, there has been debate as to whether the bene- ficial effects of physical activity are modified by the smoking status (13, 14). Therefore, the aim of this study was to exam- ine the association between fitness (measured by maximum oxygen uptake [VO2max]) and all-cause mortality, indepen- dent of regular PA or smoking status in Korean men.
MATERIALS AND METHODS Subjects
We collected data for 19,410 men who had undergone medical check-ups and graded exercise tests for obtaining VO2max at the Health Promotion Center at Seoul National University Hospital from May 1995 to December 2003. Of those, we excluded 148 subjects who had prior histories of cancer (N=78), stroke (N=44) or myocardial infarction (N=
26), and 487 subjects who had missing information on reg-
13
Min-Seon Park, So-Yeon Chung, Yoosoo Chang*, and Kyungwoo Kim�
Department of Family Medicine and Center for Health Promotion, Seoul National University, College of Medicine, Seoul; Health Screening Center*, Kangbuk Samsung Hospital, Sungkyunkwan University, School of Medicine, Seoul; Department of Family Medicine�, Inha University Hospital, Incheon, Korea
Address for correspondence Min-Seon Park, M.D.
Department of Family Medicine, Center for Health Promotion, Seoul National University, College of Medicine, 28 Yeongeon-dong, Jongno-gu, Seoul 110-744, Korea
Tel : +82.2-2072-3497, Fax : +82.2-766-3276 E-mail : [email protected] DOI: 10.3346/jkms.2009.24.1.13
Physical Activity and Physical Fitness as Predictors of All-Cause Mortality in Korean Men
We examined the associations between physical activity (PA), fitness and all-cause mortality and compared their contributions, taking smoking status into considera- tion. A retrospective cohort study of 18,775 men was carried out between May 1995 and December 2003. Fitness was measured by maximum oxygen uptake and regu- lar PA was defined as at least three times a week, for more than 30 min of leisure time PA. During the mean 6.4 yr of follow-up, 547 deaths were recorded. The haz- ard ratio (HR) (95% confidence interval [CI]) of regular PA for all-cause mortality was 0.63 (0.52-0.76). The HRs (95% CIs) for men with middle and highest tertile levels of fitness were decreased by 0.58 (0.47-0.70) and 0.58 (0.45-0.75) in com- parison to men with lowest one. The inverse association between fitness and mor- tality was significant among the men who did not engage in regular PA, but not among those who did (p for interaction=0.031). Smoking status did not influence on the associations between regular PA, fitness and mortality. Our result suggest- ed that regular PA and fitness predicted mortality in men. The influence of fitness on mortality was pronounced in the men who did not engage in regular PA.
Key Words : Motor Activity; Exercise; Physical Fitness; Mortality, Smoking
Received : 3 December 2007 Accepted : 23 April 2008
ular PA. A total of 18,775 men were included in the final analysis. The institution review board of Seoul National University Hospital reviewed and approved the protocol, retrospectively.
Baseline measurements
Information on age, education level, occupation, income, smoking status, alcohol consumption, regular leisure time PA (light moderate, or vigorous activities for more than 30 min at least three times a week) by a structured self-report- ed questionnaire, supervised by trained nurse. Smoking sta- tus were classified into 3 categories; current, former, or never smokers. Subjects who reported smoking at least one cigarette per day at present time were classified as current smokers.
Non-smokers were defined as those who had never smoked.
Subjects who reported as not smoking currently but had smoked ever were classified as former smokers. History for alcohol drinking was evaluated by the subject’s reported aver- age frequency (times per week) during the month before the screening examination. Regular drinker was defined as drink- ing alcoholic beverages at least once a week.
Height and weight were measured after an overnight fast while the subject wore a lightweight gown. Blood pressure was measured using an automated blood pressure device (Jawon, Busan, Korea) after the subject had rested for at least 20 min in a sitting position. Blood samples were obtained after an overnight fast of at least 12 hr for chemical analysis.
Hypertension was defined as systolic blood pressure ≥140 mmHg or diastolic blood pressure ≥90 mmHg at baseline examination, a reported history of previous hypertension, or current uses of antihypertensive medication (15). Diabetes was defined as fasting plasma glucose ≥126 mg/dL at enroll- ment, a reported history of previous diabetes mellitus, or cur- rent use of anti-diabetic agents.
Physical activity and physical fitness assessment
Leisure time PA was determined by assessing the results of a self-administered questionnaire that included questions regarding the subjects’ participation in any kind of regular physical exercise or walking, the duration and the frequency of each activity per week over a month prior to the exami- nation. This process was supervised by a trained nurse, and the subjects were encouraged to ask questions if they need- ed further clarification on any question. The PA of each sub- ject was confirmed by a doctor, face-to-face, just after the completion of the self-administered questionnaire. Those who reported engaging in leisure time PA once a week or more were asked about the average duration and intensity (light, moderate or vigorous) (16) of the activity. In this study, PA was classified into two categories: regular PA, defined as leisure time PA engaged in any intensity of PA for 30 min at least three times a week, and no regular PA group.
Graded exercise tests were performed on a cycle ergome- ter (Cateye Ergociser, EC 1600, Osaka, Japan), and VO2max was estimated by a skilled examiner in order to evaluate the subject’s physical fitness level. The subjects exercised to a car- diac frequency of 85% of their predicted maximum until stopping due to dyspnea, fatigue, chest pain or systolic blood pressure greater than or equal to 250 mmHg (17).
Mortality ascertainment
Participants were followed for mortality from baseline examination until death for decedents or until December 31, 2005 for survivors. Death was ascertained through record linkage with the national death certificate files in Korea. Fol- low-up for deaths was more than 98% complete (18). For all deaths, a computerized search of death certificate data from the National Statistical Office in Korea was performed using personal identification numbers assigned at birth. In- ternational Classification of Diseases (ICD) 10th Revision was used for coding the cause of death. Cardiovascular death was defined with codes I00-99 and cancer death was defined with codes C00-C97 (19) at the hospitals.
Data are mean (SD), *frequency (%).
Chi-square test or Student’s t-tests were used (missing information for smoking status=144).
VO2max was categorized as low (VO2max ≤22 mL/kg/min), moderate (23 mL/kg/min ≤VO2max ≤29 mL/kg/min) and high (VO2max ≥30 mL/kg/min).
Regular drinker means the men drinking alcoholic beverages at least once a week.
VO2max, maximum O2uptake measured by graded exercise test with bicycle ergometer. Regular physical activity (PA) means ‘engaging in light, moderate or vigorous activities for at least 30 min more than three times a week.’
PA, physical activity; BMI, body mass index.
Regular PA (N=7,157)
No regular PA
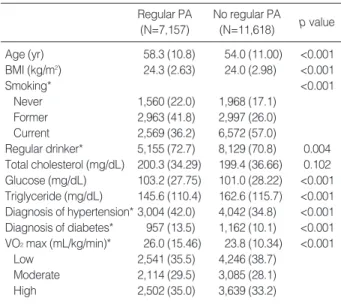
(N=11,618) p value Age (yr) 58.3 (10.8) 54.0 (11.00) <0.001 BMI (kg/m2) 24.3 (2.63) 24.0 (2.98) <0.001
Smoking* <0.001
Never 1,560 (22.0) 1,968 (17.1)
Former 2,963 (41.8) 2,997 (26.0)
Current 2,569 (36.2) 6,572 (57.0)
Regular drinker* 5,155 (72.7) 8,129 (70.8) 0.004 Total cholesterol (mg/dL) 200.3 (34.29) 199.4 (36.66) 0.102 Glucose (mg/dL) 103.2 (27.75) 101.0 (28.22) <0.001 Triglyceride (mg/dL) 145.6 (110.4) 162.6 (115.7) <0.001 Diagnosis of hypertension* 3,004 (42.0) 4,042 (34.8) <0.001 Diagnosis of diabetes* 957 (13.5) 1,162 (10.1) <0.001 VO2max (mL/kg/min)* 26.0 (15.46) 23.8 (10.34) <0.001
Low 2,541 (35.5) 4,246 (38.7)
Moderate 2,114 (29.5) 3,085 (28.1)
High 2,502 (35.0) 3,639 (33.2)
Table 1. Baseline characteristics of the study subjects accord- ing to the regularity of physical activity
Statistical analysis
SPSS for Windows 12.0 was used for statistical analysis.
All analyses were performed after excluding the subjects who died during the first two years of follow-up. The chi-square- tests or Student’s t-tests were used to analyze the statistical differences between the characteristics of the study partici- pants according to PA. Cox proportional hazard models were used to calculate the adjusted hazard ratios (HRs) with 95%
confidence intervals (CIs) in model for all-cause mortality.
Physical fitness level was first classified into tertile in total subjects: low (VO2max ≤22 mL/kg/min), moderate (23 mL/kg/min ≤VO2max ≤29 mL/kg/min) and high (VO2 max ≥30 mL/kg/min). Then, fitness was divided into tertile separately according to the regular or no regular PA groups:
low (VO2max ≤23 mL/kg/min), moderate (24 mL/kg/min
≤VO2 max ≤29 mL/kg/min) and high (VO2max ≥30 mL/kg/min) in the regular PA group; low (VO2max ≤22 mL/kg/min), moderate (23 mL/kg/min ≤VO2max ≤28 mL/kg/min) and high (VO2max ≥29 mL/kg/min) in the no regular PA group. Stratified by the regularity of PA, all- cause, CV and cancer mortality at the different levels of fit-
ness (by each tertile increase) were estimated after adjusting for age, study year, body mass index (BMI), total cholesterol, alcohol consumption, smoking status (never, former, or cur- rent) and diagnosis of hypertension or diabetes.
We also examined stratified analyses according to the cat- egories of smoking status in the multivariate analyses to exam- ine whether the associations between regular PA, fitness and mortality were modified by smoking status. p values are 2- sided, and p<0.05 was considered to be statistically signifi- cant.
RESULTS
During the mean follow-up period of 6.4 yr, 547 deaths were recorded, of which 262 (47.9%) were due to cancer and 101 (18.5%) were due to CV disease. The characteristics of the study subjects according to PA status at baseline were compared (Table 1). The mean (SD) age of the study partici- pants was 55.7 (11.1) yr, and the mean (SD) VO2max of the subjects in the regular PA group was 26.0 (15.5) mL/kg/
min and that of the subjects in the no regular PA group was
Regular physical activity (PA) means ‘engaging in light, moderate or vigorous activities for at least 30 min more than three times a week.’
VO2max was categorized as low (VO2max ≤23 mL/kg/min), moderate (24 mL/kg/min ≤VO2max ≤29 mL/kg/min) and high (VO2max ≥30 mL/kg/min) in the regular PA group and low (VO2max ≤22 mL/kg/min), moderate (23 mL/kg/min ≤VO2max ≤28 mL/kg/min) and high (VO2max ≥29 mL/kg/min) in the no regular PA group.
Regular drinking means drinking alcoholic beverages at least once a week.
VO2max, ~; maximum O2uptake measured by graded exercise test with bicycle ergometer; CI, confidence interval; CV, cardiovascular; BMI, body mass index.
All-cause mortality HR (95% CI)
Variables CV mortality
HR (95% CI)
Cancer Mortality HR (95% CI)
Age 1.08 (1.07-1.09) 1.11 (1.09-1.13) 1.08 (1.06-1.09)
BMI (per 1- unit increment) 0.96 (0.93-1.00) 0.97 (0.93-1.01) 0.94 (0.89-0.99)
Cholesterol (per 1 mg/dL increment) 1.00 (0.99-1.00) 1.01 (1.00-1.01) 1.00 (0.99-1.00)
Regular physical activity
No 1 1 1
Yes 0.63 (0.52-0.76) 0.42 (0.27-0.68) 0.72 (0.55-0.94)
Regular drinking
No 1 1 1
Yes 0.75 (0.63-0.90) 0.78 (0.52-1.18) 0.73 (0.57-0.94)
Smoking
No 1 1 1
Former 1.25 (0.96-1.64) 0.92 (0.47-1.98) 2.08 (1.34-3.25)
Current 1.97 (1.52-2.55) 1.44 (0.85-2.43) 3.00 (1.94-4.63)
Diagnosis of hypertension
No 1 1 1
Yes 1.44 (1.20-1.72) 2.27 (1.48-3.48) 1.26 (0.97-1.63)
Diagnosis of diabetes
No 1 1 1
Yes 1.30 (1.04-1.61) 1.16 (0.70-1.93) 1.48 (1.09-2.02)
VO2max
Low 1 1 1
Moderate 0.58 (0.47-0.70) 0.47 (0.29-0.77) 0.60 (0.45-0.80)
High 0.58 (0.45-0.75) 0.64 (0.35-1.19) 0.52 (0.36-0.76)
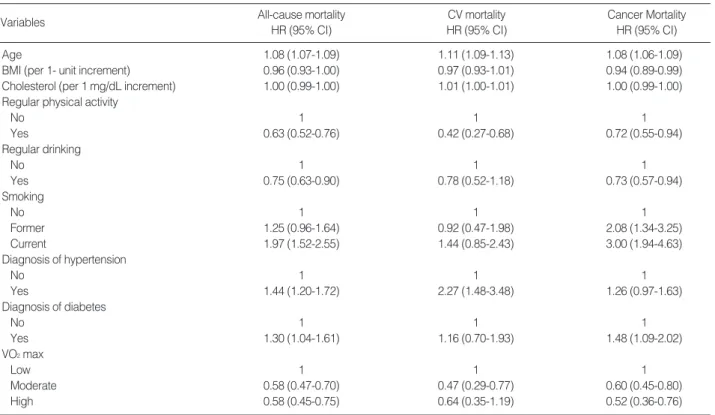
Table 2. Multivariate hazard ratios (HRs) (95% CI ) of all-cause, CV and cancer mortality among men
23.8 (10.3) mL/kg/min. The subjects who engaged in regu- lar PA were older and had higher fasting glucose levels and a lower prevalence of current smoker in comparison to those who did not.
The effects of regular PA and physical fitness on mortality
The adjusted HR (95% CI) of regular PA for all-cause mor- tality was 0.63 (0.52-0.76). The HRs (95% CI) of all-cause mortality for the men with moderate and high levels of fitness decreased to 0.58 (0.47-0.70) and 0.58 (0.45-0.75), respec- tively, in comparison to the men with a low level of fitness.
Engaging in regular PA and higher level of fitness also reduc- ed CV and cancer mortality. The HRs (95% CI) of men who engaged in regular PA was 0.42 (0.27-0.68) for CV mortal- ity and 0.72 (0.55-0.94) for cancer mortality. The adjusted HRs (95% CI) in men with moderate and high levels of fit- ness, using men with a low level of fitness as reference, were 0.47 (0.29-0.77) and 0.64 (0.35-1.19) for CV mortality and 0.60 (0.45-0.80) and 0.52 (0.36-0.76) for cancer mortality, respectively. Diagnosis of hypertension or Diabetes, BMI, smoking status and alcohol consumption were also signifi- cantly related to mortality (Table 2).
Combined effect of regular PA and fitness on mortality
The association between fitness and mortality was signifi- cantly stronger among the men who did not engage in reg- ular PA than those who did (p for interaction=0.031 for all- cause mortality, table not shown). When stratified by regu-
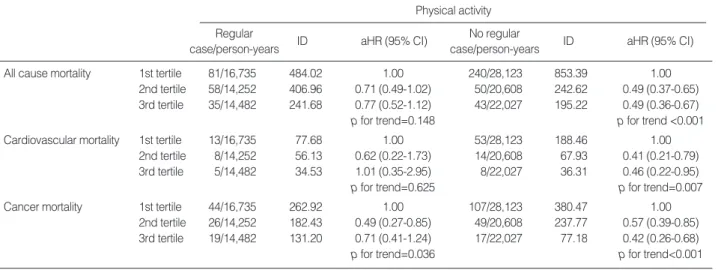
larity of PA, the men in higher level of fitness did not show significant reduction of the HRs for total mortality and CV mortality (p for trend=0.15 for total mortality, p for trend=
0.63 for CV mortality) compared to men in the lowest level of fitness. Cancer mortality decreased significantly in men with higher level of fitness in the regular PA group (p for trend=0.037) On the other hand, in the no regular PA group, all-cause, CV and cancer mortality decreased significantly with increased fitness level. The adjusted HRs in men with moderate and high levels of fitness, using men with a low level of fitness as reference, were 0.49 and 0.49 (p for trend
<0.001) for total mortality, 0.41 and 0.46 (p for trend=0.007) for CV mortality, and 0.57 and 0.42 (p for trend<0.001) for cancer mortality, respectively, after full adjustment for age, study year, total cholesterol, BMI smoking status, alcohol con- sumption and diagnosis of hypertension or diabetes (Table 3).
The effect of regular PA and fitness on mortality according to smoking status
In the analysis stratified by smoking status, there was sta- tistically significant decrease in all-cause mortality with in- creased fitness level in all smoking categories in the no reg- ular PA group. In the group of subjects who did not engage in regular PA, the HRs of men with moderate and high lev- els of fitness in never smokers for all-cause mortality were 0.21 and 0.53 (p for trend=0.007), those of former smokers were 0.58 and 0.45 (p for trend=0.018) and those of current smokers were 0.52 and 0.50 (p for trend<0.001), respective- ly, in comparison to the men with a low level of fitness in
Adjusting for age, study year, total cholesterol, body mass index, smoking status (never, former, current), regular drinking (drinking alcoholic bever- ages at least once a week ) and diagnosis of hypertension or diabetes
Regular physical activity (PA) means ‘engaging in light, moderate to vigorous activities for at least 30 min more than three times a week.’
VO2max was categorized as low (VO2max ≤23 mL/kg/min), moderate (24 mL/kg/min ≤VO2max ≤29 mL/kg/min) and high (VO2max ≥30 mL/kg/min) in the regular PA group and low (VO2max ≤22 mL/kg/min), moderate (23 mL/kg/min ≤VO2max ≤28 mL/kg/min) and high (VO2max ≥29 mL/kg/min) in the no regular PA group.
ID, incidence density (per 100,000 person-years); aHR, adjusted hazard ratio; CI, confidence interval.
Physical activity Regular
case/person-years ID aHR (95% CI) No regular
case/person-years ID aHR (95% CI)
All cause mortality 1st tertile 81/16,735 484.02 1.00 240/28,123 853.39 1.00
2nd tertile 58/14,252 406.96 0.71 (0.49-1.02) 50/20,608 242.62 0.49 (0.37-0.65) 3rd tertile 35/14,482 241.68 0.77 (0.52-1.12) 43/22,027 195.22 0.49 (0.36-0.67)
p for trend=0.148 p for trend <0.001
Cardiovascular mortality 1st tertile 13/16,735 77.68 1.00 53/28,123 188.46 1.00
2nd tertile 8/14,252 56.13 0.62 (0.22-1.73) 14/20,608 67.93 0.41 (0.21-0.79) 3rd tertile 5/14,482 34.53 1.01 (0.35-2.95) 8/22,027 36.31 0.46 (0.22-0.95)
p for trend=0.625 p for trend=0.007
Cancer mortality 1st tertile 44/16,735 262.92 1.00 107/28,123 380.47 1.00
2nd tertile 26/14,252 182.43 0.49 (0.27-0.85) 49/20,608 237.77 0.57 (0.39-0.85) 3rd tertile 19/14,482 131.20 0.71 (0.41-1.24) 17/22,027 77.18 0.42 (0.26-0.68)
p for trend=0.036 p for trend<0.001
Table 3. Hazard ratios for all-cause, cardiovascular and cancer mortality according to level of physical fitness and regularity of physi- cal activity
each smoking category (Table 4). The HRs (95% CIs) in men who engaged in regular PA and who were current smokers with moderate and high levels of fitness decreased to 0.50 (0.27-0.91) and 0.75 (0.41-1.36), in comparison to those with a low level of fitness.
DISCUSSION
The results of the present study demonstrated that both regular PA and physical fitness are inversely associated with the risk of death among relatively healthy men.
The extent how much the beneficial effects of PA on health are mediated through one’s fitness level has been a matter of debate. The association between PA pattern and fitness was reported with a correlation of 0.3-0.6 (20) and 0.09 (5) in different studies. Roman et al. examined the relationship between VO2max and PA energy expenditure using doubly labeled water method in free living older individuals (21).
They reported a low order of correlation (r=0.37) and only 13% of shared variance between VO2 max and PA energy expenditure. They also suggested that fitness and PA may act in a unique and independent manner to improve cardio- vascular and metabolic health (21).
Few studies have addressed both fitness and PA in the same study in subjects with clinical data. In this study, the associ- ation between fitness and mortality was significant among men who did not engage in regular PA, but not among those
who did. We observed that the subjects in the no regular PA group with the highest level of fitness showed a significant 51% risk reduction in all-cause mortality; meanwhile the risk of death in the subjects in the regular PA group with the high- est level of fitness was attenuated by 23%, compared to the lowest level of fitness, but this effect was not statistically sig- nificant. These finding might be originated from the result that the number of subjects who engaged in regular PA was relatively small (38.1% of total subjects), and the incidence rate of mortality in the men engaging in regular PA was lower than that in the men with no regular PA (484.02 per 100,000 person-years for lowest fitness in regular PA group, 853.39 per 100,000 person-years for lowest fitness in no regular PA group).
Regular PA in this study was defined as leisure time PA (engaging in any kind of leisure time PA for 30 min at least three times a week) over one month prior to the assessment of fitness. All subjects not included in the regular PA group were included in the no regular PA group. Regular PA in this study reflected regularly spent leisure time PA-related energy expenditure regardless of intensity of leisure time PA.
In regular PA, strength and power training like indoor golf or weight lifting and stretching exercise like yoga were all included based upon the frequency and duration of activity.
These activities are not enough to increase fitness level, but enough to spend PA-related energy expenditure and reduce total mortality related to non-CV causes such as fall, fracture and depression etc. Although there is a genetic component to fitness, the major modifiable determinant of fitness is phys- ical activity intense enough to increase heart rate above rest- ing levels and deliver more oxygen to the tissue.
Our study showed that all-cause mortality was affected by regular PA than fitness level. Regular PA is known to influ- ence not only metabolic health including improving insulin sensitivity and reducing body fatness, but also improving cardiopulmonary fitness (22). They also reported that PA- related energy expenditure, or the total dose of physical activ- ity is more important for health benefits than is the specific type of PA performed (e.g., walking, running, cycling) (22).
In general, the dose-response relationship between fitness and activity and the risk of death showed a relatively greater benefit in the lower fitness group than in the higher fitness group (23-24). In Korea, the 2001 Korean National Health and Nutrition Survey performed with a representative sam- ple of 7,838 subjects who completed questionnaires on PA and were over 20 yr old showed that 71.8% of the subjects did not exercise at all (25). However, the public transporta- tion system and walkways in Korea are well developed, and people in Korea spend an average 65.8 (±73.6) min per day walking (25). Therefore regardless of regularity of leisure time PA, Korean people might spend much time walking on average. This phenomenon might explain why the effect of fitness level on mortality was attenuated in subjects in the regular PA group.
Adjusting for age, study year, total cholesterol, fasting glucose, body mass index, regular drinking (drinking alcoholic beverages at least once a week ) and diagnosis of hypertension or diabetes.
Regular physical activity (PA) means ‘engaging in light, moderate or vigorous activities for at least 30 min more than three times a week.’
VO2max was categorized as low (VO2max ≤23 mL/kg/min), moderate (24 mL/kg/min ≤VO2max ≤29 mL/kg/min) and high (VO2max ≥30 mL/kg/min) in the regular PA group and low (VO2max ≤22 mL/kg/min), moderate (23 mL/kg/min ≤VO2max ≤28 mL/kg/min) and high (VO2 max ≥29 mL/kg/min) in the no regular PA group.
aHR, adjusted hazard ratio; CI, confidence interval.
Never smoker
Physical activity aHR (95% CI)
Former smoker Current smoker Regular
Low 1 1 1
Moderate 1.08 (0.43-2.75) 0.85 (0.50-1.82) 0.50 (0.27-0.91) High 1.47 (0.54-3.96) 0.61 (0.30-1.24) 0.75 (0.41-1.36)
p for trend 0.744 0.379 0.076
No regular
Low 1 1 1
Moderate 0.21 (0.07-0.59) 0.58 (0.34-0.97) 0.52 (0.36-0.74) High 0.53 (0.23-1.21) 0.45 (0.23-0.89) 0.50 (0.34-0.73)
p for trend 0.007 0.018 <0.001
Table 4. Hazard ratios for all-cause mortality according to level of physical fitness (VO2max) and regular physical activity and smoking status among men
We also assessed the influence of smoking status on the association between fitness level, regular PA and all-cause mortality. The risk of mortality in men who did not engage in regular PA with higher level of fitness, compared to the lowest level of fitness, was significantly reduced in all smok- ing categories. In the regular PA group, an increased fitness level seemed to have a protective effect on death risk reduc- tion, but this was statistically significant only in the current smokers.
Smoking is widely recognized as a major risk factor for all- cause mortality, as is physical inactivity (26). Cigarette smok- ing has been known to contain more than 4,000 toxic sub- stances, and engaging in physical activities that are intense enough to increase one’s fitness level would increase their body heat and eliminate the water-soluble toxic substances found in cigarettes from their body by heat dissipation (sweating).
Even the detrimental effect of smoking on all-cause mortal- ity might be preventable with strenuous physical activity.
Physical activity also provides the advantages of increased body fluid for heat dissipation (sweating) and thermoregu- latory stability as well as a larger vascular volume for greater cardiac filling and stroke volume and cardiovascular stabili- ty during exercise and orthostatic challenges (27). Therefore, PA and fitness may be protective against reduced blood vol- ume and the subsequent development of disease associated with aging. These findings suggest that human beings might be born with an innate need to be physically active to live healthy. We observed that physical fitness reduced the risk of all-cause mortality, especially in the high-risk group, such as those who did not engage in regular PA. According to our study results, men who do not engage in regular PA could reduce their mortality risk by engaging in daily activities that are intense enough to increase their fitness level.
Our study has several limitations. The study population was composed of relatively healthy people and did not include women because the number of female smokers was too small.
Although the sample size of this study was not small, the number of deaths may not have been large enough to obtain enough statistical power to demonstrate the health benefit of increased the fitness level of healthy subjects who engage in regular PA. Because the cause-specific mortality has been classified accurately since 2000, it might have chance of being misclassified between 1995 and 1999.
However, our study results are not different from those of previous studies that investigated physical fitness or activity separately (28-30). Few researches have focused on the asso- ciation between fitness level and all-cause mortality accord- ing to smoking status, mostly in former and current smok- ers. To the best of our knowledge, this is the first large study to directly measure VO2max by graded exercise testing in order to assess physical fitness in Korean men.
In conclusion, we observed that regular PA and physical fitness, as assessed by VO2max, were inversely associated with all-cause, CV and cancer mortality in Korean men. In
this study, the regular PA is more important than fitness in predicting the mortality. The combined effect of fitness and PA on mortality was more pronounced in the subjects who did not engage in regular PA. Our study suggested that even in the current smokers especially who did not engage in reg- ular PA, increasing one’s fitness level by participating intense activities such as running, fast walking or climbing stairs during normal daily activities, might provide health bene- fits to reduce the risk of mortality. Further studies are need- ed to investigate the association between free living PA and fitness on all-cause and cause-specific mortalities.
REFERENCES
1. Myers J, Prakash M, Froelicher V, Do D, Partington S, Atwood JE.
Exercise capacity and mortality among men referred for exercise testing. N Engl J Med 2002; 346: 793-801.
2. Gulati M, Pandey DK, Arnsdorf MF, Lauderdale DS, Thisted RA, Wicklund RH, Al-Hani AJ, Black HR. Exercise capacity and the risk of death in women: the St James Women Take Heart Project.
Circulation 2003; 108: 1554-9.
3. NIH Consensus Development Panel on Physical Activity and Car- diovascular Health. Physical activity and cardiovascular health.
JAMA 1996; 276: 241-6.
4. Goraya TY, Jacobsen SJ, Pellikka PA, Miller TD, Khan A, Weston SA, Gersh BJ, Roger VL. Prognostic value of treadmill exercise testing in elderly persons. Ann Intern Med 2000; 132: 862-70.
5. Dvorak RV, Tchernof A, Starling RD, Ades PA, DiPietro L, Poehl- man ET. Respiratory fitness, free living physical activity, and car- diovascular disease risk in older individuals: a doubly labeled water study. J Clin Endocrinol Metab 2000; 85: 957-63.
6. LaPorte RE, Adams LL, Savage DD, Brenes G, Dearwater S, Cook T.
The spectrum of physical activity, cardiovascular disease and health:
epidemiologic perspective. Am J Epidemiol 1985; 120: 507-17.
7. Taylor HL, Jacobs DR Jr, Schucker B, Knudsen J, Leon AS, Deback- er G. A questionnaire for the assessment of leisure time physical activities. J Chronic Dis 1978; 31: 741-55.
8. Myers J, Kaykha A, George S, Abella J, Zaheer N, Lear S, Yamaza- ki T, Froelicher V. Fitness versus physical activity patterns in pre- dicting mortality in men. Am J Med 2004; 117: 912-8.
9. Blair SN, Kohl HW 3rd, Paffenbarger RS Jr, Clark DG, Cooper KH, Gibbons LW. Physical fitness and all-cause mortality A prospective study of healthy men and women. JAMA 1989; 262: 2395-401.
10. Ekelund LG, Haskell WL, Johnson JL, Whaley FS, Criqui MH, Sheps DS. Physical fitness as a predictor of cardiovascular mortality in asymptomatic North American men; the Lipid Research Clinics Mor- tality Follow-up Study. N Engl J Med 1988; 319: 1379-84.
11. Lakka TA, Venalainen JM, Rauramaa R, Salonen R, Tuomilehto J, Salonen JT. Relation of leisure time physical activity and cardiores- piratory fitness to the risk of acute myocardial infarction in men. N Engl J Med 1994; 330: 1549-54.
12. Papathanasiou G, Georqakopoulos D, Georgoudis G, Spyropoulos P, Perrea D, Evangelou A. Effects of chronic smoking on exercise
. . . .
tolerance and on heart rate-systolic blood pressure product in young healthy adults. Eur J Cardiovasc Prev Rehabil 2007; 14: 646-52.
13. Fujita K, Takahashi H, Miura C, Ohkubo T, Sato Y, Ugajin T, Ku- rashima K, Tsubono Y, Tsuji I, Fukao A, Hisamichi S. Walking and mortality in Japan: the Miyagi Cohort Study. J Epideiol 2004; 14:
S26-32.
14. Leitzmann MF, Park Y, Blair A, Ballard-Barbash R, Mouw T, Hol- lenbeck AR, Schatzkin A. Physical activity recommendations and decreased risk of mortality. Arch Intern Med 2007; 167: 2453-60.
15. Chobanian AV, Bakris GL, Black HR, Cushman WC, Green LA, Izzo JL Jr, Jones DW, Materson BJ, Oparil S, Wright JT Jr, Rochel- la EJ; Joint National Committee on Prevention, Detection, Evalua- tion and Treatment of High Blood Pressure. National Heart, Lung and Blood Institute; National High Blood Pressure Education Pro- gram Coordinating Committee. Seventh report of the Joint National Committee on prevention, detection, evaluation, and treatment of high blood pressure. Hypertension 2003; 42: 1206-52.
16. Taylor CB, Coffey T, Berra K, Iaffaldano R, Casey K, Haskell WL.
Severn-day activity and self- report compared to a direct measure of physical activity. Am J Epidemiol 1984; 120: 818-24.
17. Miller GJ, Cooper JA, Beckles GL. Cardiorespiratory fitness, all- cause mortality, and the risk of cardiovascular disease in Trinidadi- an men-the St James survey. Int J Epidemiol 2005; 34: 1387-94.
18. National Statistical Office, Korea. 2005 Annual report on the cause of death statistics (based on vital registration). Available at: URL:
http://www.nso.go.kr/
19. Hu G, Tuomilehto J, Silventoinen K, Barengo NC, Peltonen M, Jousi- lahti P. The effects of physical activity and body mass index on car- diovascular, cancer and all-cause mortality among 47,212 middle aged Finnish men and women. Int J Obs (Lond) 2005; 29: 894-902.
20. Jacobs DR Jr, Ainsworth BE, Hartman TJ, Leon AS. A simultaneous evaluation of 10 commonly used physical activity questionnaires.
Med Sci Sports Exerc1993; 25: 81-91.
21. Dvorak RV, Tchernof A, Starling RD, Ades PA, Dipietro L, Poehl- man ET. Respiratory fitness, free living physical activity and cardio- vascular disease risk in older individuals: a doubly labeled water study. J Clin Endocrinol Metab 2000; 85: 957-63.
22. LaMonte MJ, Blair SN. Physical activity, cardiorespiratory fitness, and adiposity: contributions to disease risk. Curr Opin Clin Nutr Metab Care 2006; 9: 540-6.
23. Pate RR, Pratt M, Blair SN, Haskell WL, Macera CA, Bouchard C, Buchner D, Ettinger W, Heath GW, King AC. Physical activity and public health. A recommendation from the centers for disease con- trol and prevention and the American college of sports medicine.
JAMA 1995; 273: 402-7.
24. U.S. Department of Health and Human Services. Physical activity and health: a report of the surgeon general. Washington, D.C.: U.S.
Department of Health and Human Services; 1996.
25. Yang YJ, Yoon YS, Oh SW, Lee ES. The amount of physical activi- ty of Korean adults measured from the 2001 Korean national health and nutrition survey. J Korean Acad Fam Med 2005; 26: 22-30.
26. Jee SH, Samet JM, Ohrr H, Kim JH, Kim IS. Smoking and cancer risk in Korean men and women. Cancer Causes Control 2004; 15:
341-8.
27. Convertino VA. Blood volume response to physical activity and inac- tivity. Am J Med Sci 2007; 334: 72-9.
28. Oguma Y, Sesso HD, Paffenbarger RS Jr, Lee IM. Physical activity and all-cause mortality in women: a review of the evidence. Br J Sports Med 2002; 36: 162-72.
29. Rockhill B, Willett WC, Manson JE, Leitzmann MF, Stampfer MJ, Hunter DJ, Colditz GA. Physical activity and mortality: a prospec- tive study among women. Am J Public Health 2001; 91: 578-83.
30. Andersen LB, Schnohr P, Schroll M, Hein HO. All-cause mortality associated with physical activity during leisure time,work, sports, and cycling to work. Arch Intern Med 2000; 160: 1621-8.