Effect of bone marrow-derived
mesenchymal stem cells
on hepatic fibrosis
Yoon Ok Jang
The Graduate School
Yonsei University
Effect of bone marrow-derived
mesenchymal stem cells
on hepatic fibrosis
Directed by Professor Soon Koo Baik
A Dissertation
Submitted to the Department of Medicine
and the Graduate School of Yonsei University
in partial fulfillment of the
requirements for the degree of
Doctor of Philosophy
Yoon Ok Jang
This certifies that the dissertation
of Yoon Ok Jang is approved.
Thesis Supervisor: Prof. Soon Koo Baik
Thesis Committee Member: Prof. Sei Jin Chang
Thesis Committee Member: Prof. Mee Yon Cho
Thesis Committee Member: Prof. Kyu-Sang Park
Thesis Committee Member: Prof. Moon Young Kim
The Graduate School
Yonsei University
ACKNOWLEDGEMENTS
First of all, I would like to express my sincere gratitude to my supervisor, Professor Soon Koo Baik, who gave me the opportunity to challenge the degree of doctor during the past several years. He has advised me with his heartful encouragement and generous support throughout my doctoral course. Without his generous personality, excellent guidance, patient instruction and insightful criticism, the completion of this thesis would not be possible.
I would also like to express my heartfelt gratitude to the members of my dissertation committee, Professor Sei Jin Chang, Professor Mee Yon Cho, Professor Kyu-Sang Park, Professor Moon Young Kim for their generous encouragement, invaluable advice and thoughtful suggestions.
Especially, I gratefully thank Professor Sang Ok Kwon, Professor Hyun Soo Kim, Professor Jae Woo Kim, Professor Hong Jun Park for their heartful encouragement and generous support.
I would like to thank all members of department of internal medicine and laboratory, friends, for their helps, concerns and supports.
Last but not least, I feel a deep sense of gratitude to my family, for their love, support and encouragement, which gave me the strength and courage to mount greater heights and pursue my dreams.
Yoon Ok Jang
January 2014
i
TABLE OF CONTENTS
ABSTRACT
·································································································viiI. INTRODUCTION
·····················································································1II. MATERIALS AND METHODS
··························································71. In vivo study······························································································8
1.1. Chemical material····················································································8 1.2. Animals···································································································9 1.3. Induction of hepatic fibrosis with thioacetamide·········································9 1.4. BM aspiration, isolation of MSCs, and cell culture····································11 1.5. Immunophenotypes and differentiation assays of BM-MSCs······················12 1.6. Injection of BM-MSCs in thioacetamide-induced hepatic fibrosis rat model·14 1.7. Imaging after direct injection labeled BM-MSCs in hepatic fibrosis············16 1.8. Histomorphological and immunohistochemical analysis····························171.9. Hepatic hydroxyproline content·······························································20
1.10. Quantitative Real-time PCR analysis······················································21 1.11. Western blot························································································23
2. In vitro study····························································································24
2.1. HSC culture···························································································24ii
2.2. Coculture system····················································································25 2.3. Cytokine levels analysis··········································································26 2.4. Cell viability analysis·············································································27 2.5. Apoptosis analysis··················································································28
3. In clinical study·······················································································29
3.1. Patients·································································································29 3.2. BM aspiration, isolation of MSCs, and cell culture···································33 3.3. Immunophenotypes and differentiation assays of BM-MSCs······················33 3.4. Autologous BM-MSCs Injection······························································343.5. Follow-up······························································································35 3.6. Primary and secondary outcomes·····························································36 3.7. Histomorphological and immunohistochemical analysis·····························37 3.8. Quantitative Real-time PCR analysis·······················································39
4. Statistical analysis····················································································41
4.1. In vivo study··························································································41 4.2. In vitro study·························································································41 4.3. In clinical study·····················································································41III. RESULTS···································································································
421. In vivo study·····························································································42
1.1. Immunophenotypes and differentiation potentials of the BM-MSCs············42iii
1.2. Imaging of injection labeled BM-MSCs in hepatic fibrosis·························44 1.3. Histological and immunohistochemical analysis in vivo·····························47 1.4. Measurement of hepatic hydroxyproline content in vivo·····························51 1.5. The mRNA levels of TGF-1, type 1 collagen and α-SMA in vivo·············53 1.6 The protein levels of TGF-1 and a α-SMA in vivo···································55
2. In vitro study····························································································58
2.1. The cytokine levels of TGF-1, HGF, IL-6, IL-10 in vitro··························58 2.2. BM-MSCs inhibit proliferation and induce apoptosis in activated HSCs······60
3. In clinical study·······················································································62
3.1. Primary Outcome···················································································63 3.1.1. Histological and immunohistochemical analysis···································63 3.2. Secondary outcome················································································673.2.1. Changes in laboratory data after BM-MSCs therapy······························67 3.2.2. Gene expression associated with fibrosis··············································68
3.3. Safety····································································································70
IV. DISCUSSION·································································································
71V. CONCLUSION·······························································································
78REFERENCE········································································································79
iv
LIST OF FIGURES
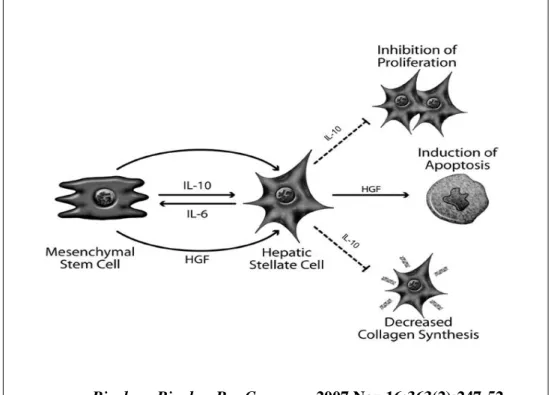
Figure 1. The paracrine effects of MSC-derived factors on activated HSCs········5
Figure 2. Liver section presenting normal liver (A) and cirrhosis (B) induced by
intraperitoneal injections of thioacetamide for 12 weeks.·························10
Figure 3. Direct injection of BM-MSCs in thioacetamide-induced hepatic
fibrosis rat model···············································································15
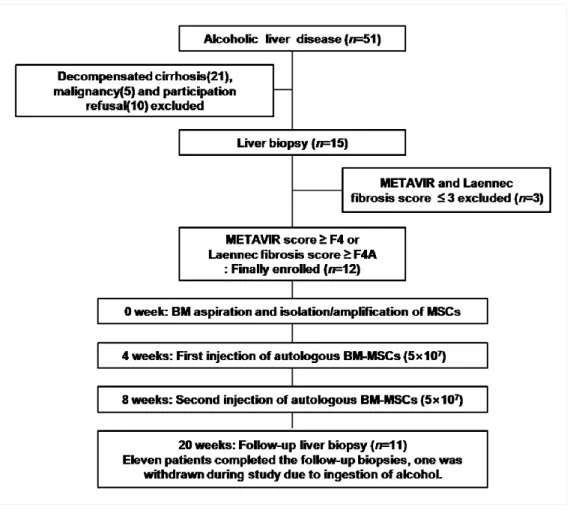
Figure 4. Flow chart of the inclusion of patients and the study design.········31
Figure 5. Immunophenotypes and differentiation potentials of the BM -
MSCs·······························································································43
Figure 6. Cell tracking of BM-MSCs in hepatic fibrosis·····································45
Figure 7. Histological and Immunohistochemical analysis in vivo·······················49
Figure 8. The relative expression of the collagen proportionate area in vivo··········50
Figure 9. The content of hepatic hydroxyproline in vivo·····································52 Figure 10. The mRNA levels of TGF-1, type 1 collagen and α-SMA in vivo······54
Figure 11. The protein levels TGF- β1, α-SMA, Smad 2 and Smad 3 in vivo········56
Figure 12. The cytokine levels of TGF-B1, HGF, IL-6, IL-10 in vitro··················59
v
Figure 14. Histological and Immunohistochemical Analysis.······························66
vi
LIST OF TABLE
Table 1. Laennec scoring system for staging fibrosis in Liver biopsy specimens······19
Table 2. Primers for real-time PCR······································································22
Table 3. The general characteristics of the patients················································32
Table 4. Primers for real-time PCR······································································40
Table 5. The histological sub-classification according to the Laennec fibrosis scoring system.·······························································································48
Table 6. Changes in clinical histological markers induced by BM-MSCs therapy·····64
(Pre, before BM-MSCs therapy; Post, after BM-MSCs therapy)
vii
ABSTRACT
Effect of bone marrow-derived mesenchymal stem cells
on hepatic fibrosis
Yoon Ok Jang
Dept. of Medicine
The graduate School
Yonsei University
Background: Cirrhosis, the end stage of progressive hepatic fibrosis, is leading to
loss of liver function and the development of hepatocellular carcinoma. Studies from experimental models suggest that bone marrow-derived mesenchymal stem cells (BM-MSCs) have the capacity to differentiate into hepatocytes and exhibit antifibrotic effects.
Purpose: The aim of this study was to elucidate the antifibrotic effect of BM-MSCs
on hepatic fibrosis in experimental model and patients with cirrhosis.
Methods: In pre-clinical studies, we investigated the effect of BM-MSCs to attenuate
viii
modulate the activation of HSCs indirectly via paracrine stimulation with specific cytokines and growth factors in vitro. As a clinical study, we evaluated the antifibrotic effect of BM-MSCs on alcoholic cirrhosis as a phase II trial.
Results: BM-MSCs treated group showed histologically significant improvement of
hepatic fibrosis in vivo compared to untreated cirrhotic group (P<0.01). The percentage of collagen proportionate area decreased from 16.7 ± 1.1 to 5.1 ± 0.3 after BM-MSCs treatment (P<0.01). The mRNA levels of TGF-1, collagen-1, and α-SMA significantly decreased in the BM-MSCs treated group compared to untreated cirrhotic group (P<0.01). The content of hepatic hydroxyproline was significantly lower in the BM-MSCs treatment group compared to untreated cirrhotic group (P<0.01). The protein levels of TGF-1, α-SMA, Smad2 and Smad3 were decreased in the BM-MSCs treated group compared to untreated cirrhotic group (P<0.01). Indirect coculture of activated HSCs with MSCs decreased the production of TGF-1 (24.7%) (P<0.01) and IL-6 (8.4%) in vitro (P<0.01). Conversely, coculture of activated HSCs with MSCs increased the production of HGF (33.5%) and IL-10 (31.6%) (P<0.01). HSC viability was decreased by 66% and apoptosis was increased by 43% with direct coculture of activated HSCs with MSCs (P<0.01).
In clinical study, according to the Laennec fibrosis system, histological improvements were observed in 6 out of 11 patients (54.5%) after BM-MSCs therapy. The percentage of collagen proportionate area decreased significantly from 22.6 ± 8.4 to 17.7 ± 6.9 after BM-MSCs therapy (P<0.01). The mRNA levels of TGF-1, collagen-1, and α-SMA were significantly decreased in the BM-MSCs therapy. The MELD score decreased from 9.2 ± 2.8 to 8.3 ± 2.4 after BM-MSCs therapy (P<0.01).
ix
The Child-Pugh scores improved in 10 out of 11 patients (90.9%) after BM-MSCs therapy (P<0.01). The other biochemical parameters like ALT, AST, bilirubin and creatinine have been improved after BM-MSCs therapy. No significant complications or side effects were observed during this study.
Conclusions: BM-MSCs could attenuate hepatic fibrosis in rats with TAA-induced
cirrhosis in vivo. The paracrine effects produced by BM-MSCs were identified by coculture with hepatic stellate cells (HSCs) in vitro. Immunomodulation of HSCs by MSC soluble factors provides the first mechanistic evidence that MSCs could exert a protective role through paracrine signaling to HSCs. In clinical study, BM-MSCs therapy in patient with alcoholic cirrhosis induces a histological and quantitative improvement of hepatic fibrosis. Bone marrow-derived mesenchymal stem cells therapy in cirrhosis is considered as a new strategy for an antifibrosis treatment.
Key words: bone marrow-derived mesenchymal stem cell, cirrhosis, hepatic fibrosis,
1
Effect of bone marrow-derived mesenchymal stem
cells on hepatic fibrosis
(Directed by Professor Soon Koo Baik)
The Graduate School
Yonsei University
Department of Medicine
Yoon Ok Jang
I. INTRODUCTION
Hepatic fibrosis is the wound-healing response of the liver to chronic injury. Following repeated injury, the liver undergoes a tissue remodeling and forms fibrosis. It is usually initiated by hepatocyte damage, and produces several mediators, such as reactive oxygen species and fibrogenic cytokines that induce the activation and
2
proliferation of hepatic stellate cells (HSC) and/or other fibrogenic cells and the production of excess extracellular matrix (ECM). In addition, liver injury leads to the recruitment of immune cells into the liver and to the activation of local Kupffer cells, the macrophages of the liver, which can further promote the fibrotic process via secretion of inflammatory and fibrogenic cytokines.
The increased deposition of ECM is mainly caused by the increased production of matrix proteins by activated HSC. These processes result in accumulation of ECM and profound changes in its protein composition, which in turn can further promote the activation and proliferation of HSC and thus contribute to the progression of fibrosis. Fibrogenesis represents a wound healing response to injury, and ultimately leads to cirrhosis. Cirrhosis, the end stage of progressive hepatic fibrosis, is characterized by distortion of the hepatic architecture and the formation of regenerative nodules, angiogenesis, and shunt formation, leading to the loss of liver function and the development of hepatocellular carcinoma 1-5.
Concomitantly, perturbation of transforming growth factor (TGF)-β signaling by pro-inflammatory cytokines in the epithelial cells of the liver (hepatocytes) promotes both fibrogenesis and carcinogenesis (fibro-carcinogenesis). Smad proteins, which convey signals from TGF-β receptors to the nucleus, have intermediate linker regions between conserved Mad homology (MH) 1 and MH2 domains. TGF-β type I receptor and pro-inflammatory cytokine-activated kinases differentially phosphorylate Smad2 and Smad3 to create phosphoisoforms phosphorylated at the COOH-terminal, linker, or both (L/C) regions. During the progression of liver disease, pre-neoplastic hepatocytes are persistently affected by TGF-β together with pro-inflammatory
3
cytokines come to exhibit the same carcinogenic (mitogenic) pSmad3L and fibrogenic pSmad2L/C signaling as do myofibroblasts, thereby accelerating hepatic fibrosis. As this process progresses, morbidity and mortality due to disease related complications will increase unless the causal factor is removed 6-8.
Currently, the most effective therapy for patients with acute hepatic failure or cirrhosis is liver transplantation. However, this procedure has several limitations, including lack of donors, surgical complications, immunological suppression, and high medical cost 9. Hence, alternative approaches that circumvent the use of the whole organ, such transplantation of cells of various origins, have recently been accepted 10, 11. Alternatively cell sources have raised expectations research for using stem cells as a new type of cellular therapy in regenerative medicine. And stem cell transplantation has been suggested as an effective alternate therapy for hepatic disease
12, 13
.
Several previous studies using animal models of liver diseases have demonstrated that bone marrow (BM) cell transplantation may accelerate the liver regeneration process, reduce hepatic fibrosis, and improve liver function and the survival rate 14-17. The prospects for stem cell transplantation as a therapy for hepatic disease, as determined by initial translational pilot studies testing the direct hepatic administration of BM-derived stem cells, have been encouraging and have suggested enhanced liver regeneration prior to partial hepatectomy, showing improved liver function in advanced chronic liver disease 18-24. Among the stem cells, mesenchymal stem cells (MSCs) in particular have practical advantages in regenerative medicine
4
due to their high capability for self-renewal and differentiation without ethical or tumorigenic problems.
It has been shown that MSCs indirectly modulate the activity of activated HSCs in
vitro via paracrine stimulation with specific cytokines and growth factors.
Suppression of proliferation and collagen synthesis was mediated by MSC-derived interleukin (IL)-10 which is a dynamic response to IL-6 secreted by activated HSCs. In addition, secretion of hepatocyte growth factor (HGF) by MSCs led to the apoptotic death of activated HSCs (Fig. 1) 25.
5
Biochem Biophys Res Commun. 2007 Nov 16;363(2):247-52.
Figure 1. The paracrine effects of MSC-derived factors on
activated HSCs.
6
Hence, BM-MSCs have been considered as an important source of stem cells for hepatic fibrosis. However, there has been no report regarding the effect of autologous BM-MSCs therapy on humans with cirrhosis. Therefore, this study aimed to evaluate the effect of bone marrow-derived mesenchymal stem cells (BM-MSCs) on hepatic fibrosis thoroughly in cirrhotic patients as well as experimental model.
In pre-clinical studies, we investigated whether BM-MSCs can attenuate a thioacetamide (TAA)-induced cirrhotic rat model in vivo and can indirectly modulate the activity of activated HSCs via paracrine stimulation with specific cytokines and growth factors in vitro. In clinical study, we determined the antifibrotic effect of BM-MSCs on alcoholic cirrhosis as a phase II trial.
7
II. MATERIALS AND METHODS
Study design
This study was consist of three parts. In the first part, we investigated the effects of bone marrow-derived mesenchymal stem cells (BM-MSCs) on hepatic fibrosis in a TAA (thioacetamide)-induced cirrhotic rat model in vivo. In the second part, we determined the pathway in which the BM-MSCs modulate the activity of activated HSCs via paracrine stimulation with specific cytokines and growth factors in vitro. In the third part, we evaluated the antifibrotic effect of BM-MSCs on alcoholic cirrhosis as a phase II clinical study.
8
1. In vivo study
1.1Chemical material
Thioacetamide (TAA) is a potent hepatotoxin that causes centrilobular necrosis and nephrotoxic damage following acute administration. Prolonged exposure to TAA can result in bile duct proliferation and liver cirrhosis histologically similar to that caused by viral hepatitis infection. TAA contains a thiono-sulfur group, which undergoes an extensive metabolism to produce acetamide and TAA-S-oxide by a microsomal monooxygenase requiring NADPH and cytochrome P450. In a further step, TAA-S-oxide is transformed in TAA-S, S-diTAA-S-oxide, an unstable reactive metabolite that is thought to initiate necrosis by covalently binding to liver macromolecules. Biotransformation of TAA precedes oxidative damage-associated liver injury 26, 27.
9
1.2.
Animals
All animal procedures were performed in accordance with the Ethics Committee of Animal Experimentation at Yonsei University Wonju College of Medicine. Male Sprague-Dawley rats at 7 weeks with weight of 230-250g were utilized in vivo experiment. Animals were maintained under standard conditions at room temperature of 25°C with 12hrs light/dark cycle, and were allowed free access to diets and water throughout the 12 weeks experiment.
1.3. Induction of hepatic fibrosis with thioacetamide
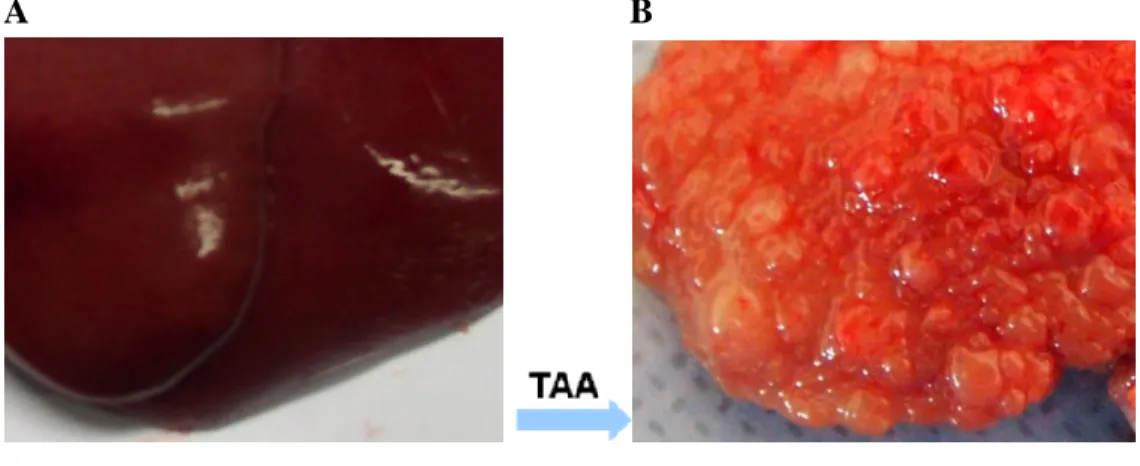
Hepatic fibrosis was induced in Sprague-Dawley rats by intraperitoneal (i.p.) injections of thioacetamide (TAA; Sigma, St. Louis, MO, USA) (300 mg/kg body weight, twice per week) for 12 weeks. (Fig. 2)
Animals were randomly allocated into three groups (each group, n = 15) as follows: Group I (G1; Sham group); Group II (G2; Untreated cirrhotic group): TAA injection; Group III (G3; BM-MSCs treated group): TAA injection and BM-MSCs treatment.
10
A B
Normal liver Cirrhosis
Figure 2. Liver section presenting normal liver (A) and cirrhotic
liver (B) induced by intraperitoneal injections of thioacetamide for
12 weeks.
11
1.4. BM aspiration, isolation of MSCs, and cell culture
Approximately 10–20 mL of BM was aspirated from the posterior iliac crest of patients or human under local anesthesia. BM mononuclear cells were isolated by density-gradient centrifugation (Histopaque-1077, Sigma-Aldrich, St. Louis, MO, USA). Mononuclear cells (2–3×10⁵cells/cm2) were plated in a 75 cm2 flask (Falcon, Franklin Lakes, NJ, USA) with Dulbecco’s modified Eagle’s medium (DMEM; Gibco, Grand Island, NY, USA) containing 10% fetal bovine serum (FBS; Gibco) and 1% penicillin/streptomycin (Gibco), and cultured at 37°C in a 5% CO2 atmosphere.
After 5 days, nonadherent cells were removed by replacing the medium. When the cultures approached 80% confluence, the cells were harvested by treatment with a trypsin/EDTA solution (Gibco) and replated at a density of 4–5×10³cells/cm2 in 175 cm2 flasks. Cells for injection were serially subcultured up to passages four or five. During culture, some passage 2 cells were harvested and cryopreserved in 10% dimethyl sulfoxide (Sigma-Aldrich) and 90% fetal bovine serum (FBS) for the second injection.
12
1.5. Immunophenotypes and differentiation assays of BM-MSCs
The immunophenotypes of the BM-MSCs (CD14, CD34, CD45, CD73, and CD105) were analyzed on the day of injection, and their differentiation potentials were determined (osteogenesis and adipogenesis; Fig. 1). For immunophenotype analysis, BM-MSCs were stained with antibodies conjugated with fluorescein isothiocyanate (FITC) or phycoerythrin (PE): CD14-FITC, CD34-FITC, CD45-FITC, CD73-PE, and CD105-PE (BD Biosciences, San Jose, CA, USA). Briefly, 5×10⁵ cells were resuspended in 0.2 mL phosphate-buffered saline (PBS) and incubated with FITC- or conjugated antibodies for 20 min at room temperature. FITC- or PE-conjugated mouse IgGs were used as the control isotype at the same concentration as the specific primary antibodies. The fluorescence intensity of the cells was evaluated by flow cytometry (Epics XL; Beckman Coulter, Miami, FL, USA).
The osteogenic differentiation was determined by first plating the cells at 2×10⁴cells/cm2 in six-well plates and then leaving them in the following osteogenic medium for 2–3 weeks: DMEM medium supplemented with 10% FBS, 10mM β-glycerophosphate, 10–7M dexamethasone, and 0.2mM ascorbic acid (Sigma-Aldrich)
28
. The osteogenic differentiation was quantified from the release of p-nitrophenol from p-nitrophenyl phosphate by the enzyme alkaline phosphatase 29.
For adipogenic differentiation, BM-MSCs were plated at 2×10⁴cells/cm2 in six-well plates, cultured for 1 week, and then differentiation was induced with an adipogenic medium (10% FBS, 1μM dexamethasone, 0.5mM 3-isobutyl-1-methylxanthine, 10μg/mL insulin, and 100μM indomethacin in high-glucose DMEM) for an additional
13
3 weeks. The differentiated cells were fixed in 4% paraformaldehyde for 10min and stained with fresh Oil Red-O solution (Sigma-Aldrich) to show lipid droplets (Fig. 5C).
Criteria regarding the use of MSCs included viability greater than 80%, absence of microbial contamination (bacteria, fungus, virus, or mycoplasma) when tested 3– 4days before administration, expression of CD73 and CD105 by more than 90% of the cells, and absence of CD14, CD34, and CD45 in less than 3% of the cells, as assessed by flow cytometry.
14
1.6. Injection of BM-MSCs in thioacetamide-induced hepatic
fibrosis rat model
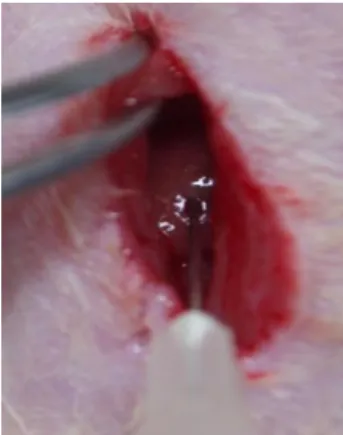
With aseptic techniques, a 1-cm incision was made caudal to the costal arch on the right flank to expose the right lobe of the liver. With a syringe, 2×10⁶ human BM-MSCs were injected directly into the right lobe of the liver, at 6 and 8 weeks in Group III (Fig. 3). After 12 weeks, specimens of liver tissue were taken, fixed, and immediately snap frozen and stored at −80°C for analysis from sacrificed animals.
15
Figure 3. Direct injection of BM-MSCs in thioacetamide-induced
hepatic fibrosis rat model
16
1.7. Imaging after direct injection labeled BM-MSCs in hepatic
fibrosis
Stem cell tracking in animal models has revealed that the track stem cell movement and differentiation due to stem cell their strong signals. To facilitate the identification of BM-MSCs tracking, BM-MSCs were labeled with fluorescent spherical silica nanoparticles with CELL-STALKERTM-CSR (Biterials) that contained Rhodamine B isothiocyanate (RITC) according to manufacturer’s protocol. CELL-STALKER was centrifuged at 12000rpm for 10 min then supernatant was discarded except pellet and sonicated for 5 min at 40khz-300w to evenly distribute particles, placed into BM-MSCs culturing 75T flask and incubated at 37°C for 24hrs. After incubation, the cells were harvested by treatment with a trypsin/EDTA solution. The 2×10⁶ BM-MSCs labeled with CELL-STALKER were injected directly into the right lobe of the liver and observed under a confocal microscope on 0, 3, 7, 14 days. Fluorescence images were obtained using a laser scanning confocal microscope (TCS SPE, Leica Microsystems GmbH, Wetzlar, Germany) at 588nm .
17
1.8. Histomorphological and immunohistochemical analysis
Five micrometer thick sections of paraffin-embedded liver tissues were prepared and stained with hematoxylin and eosin (H&E), Masson’s trichrome (MTC), a-smooth muscle actin (a-SMA) and Picrosirius Red.
Fibrosis was evaluated using both the Laennec fibrosis scoring system (Table 1) and the METAVIR fibrosis scoring system. In using the Laennec system, the thickness of the predominant type of septae in each specimen was chosen and the smallest nodule was selected for scoring.
The Laennec fibrosis scoring system was used because this system divides cirrhosis into three subclasses, allowing for a more detailed estimation of fibrosis after intervention 30. In addition, to estimate any treatment induced change in liver fibrosis, the fibrosis area was quantified as a percentage of the total area that was positive for MTC stain in the digital photomicrographs using a computerized image-analysis system (Analysis 3.0, Soft Imaging System, Münster, Germany). To quantify the fibrosis area, microscopic areas were selected randomly at an original magnification of X 100. For immunohistochemical analysis, tissue sections were incubated with primary antibody against α-SMA (diluted 1:800, Neomarkers, Fremont, CA, USA) for 90 min at room temperature after washing with buffer. Tissue sections were incubated with the chromogen 3-amino-9-ethylcarbazole (BioGenex, San Ramon, CA, USA) for 5–7 min. Prior to mounting, the sections were counterstained with hematoxylin and then dehydrated. An UltraVision LP Large Volume Detection System (Lab Vision, Runcorn, UK) was used as the detection system. Morphological
18
analysis of immunopositive cells was also performed with a computerized image-analysis system.
Picrosirius Red staining was performed to quantify the total amount of collagen. Five micrometer thick sections of paraffin-embedded liver tissues were deparaffinized and rehydrated with distilled water and stained with a Picrosirius Red staining kit (Polysciences, Warrington, PA, USA) according to the manufacturer’s instructions. In addition, the amount of collagen (the main component of fibrous tissue) was estimated from the collagen proportionate area, expressed as the percentage of the total area that was positive for Picrosirius Red stain on microscopy (Olympus BX51, Tokyo, Japan) using a computerized image-analysis system (IMT i solution, Vancouver, Canada). While measuring the collagen proportionate area, we eliminated image artifacts and structural collagen in large portal tracts and blood vessel walls 31.
19
Table 1. Laennec scoring system for staging fibrosis in Liver biopsy
specimens.
Stage Name Septa (thickness and number) Criteria Score 0 No definite fibrosis0 1 Minimal fibrosis +/−
No septa or rare thin septum; may have portal expansion or mild sinusoidal fibrosis
1
2 Mild fibrosis + Occasional thin septa; may have portal expansion or mild sinusoidal fibrosis 2
3 Moderate
fibrosis ++
Moderate thin septa; up to incomplete
cirrhosis 3 4A Mild, definite, or probable cirrhosis +++
Marked septation with rounded
contours or visible nodules. Most septa are thin (one broad septum allowed)
4
4B Moderate
cirrhosis ++++
At least two broad septa, but not very broad septa and less than half of biopsy length composed of minute nodules
5
4C Severe
cirrhosis +++++
At least one very broad septum or more than half of biopsy length composed of minute nodules (micronodular
cirrhosis)
6
20
1.9. Hepatic hydroxyproline content
Hepatic collagen content was assessed by hydroxyproline concentration. Liver tissues (15–20 mg wet weight) were hydrolyzed in 300 μl of 6 N HCl at 120°C overnight, and hydrolysates were evaporated under vacuum four times. The hydrolysate was centrifuged at 8000 g for 10 min, and 500 μl of the supernatant was evaporated under vacuum. Supernatant were titrated to pH 5–6 with HCl and 6 N NaOH. These solutions were then supplemented with 7% chloramine T, acetate/citrate buffer (5.7 g sodium acetate 3H2O, 3.75 g trisodium citrate 2H2O, 0.55 g citric acid H2O, and 38.5 ml isopropanol) and 150 μl of Ehrlich’s solution, consisting of p-dimethylaminobenzaldehyde dissolved in perchloric acid and
isopropanol. After cooling, absorbance was measured at 560 nm with an Emax
Precision Microplate Reader (Molecular Devices, Sunnyvale, CA, USA). Hydroxyproline levels were expressed in micrograms of hydroxyproline per gram of liver tissue.
21
1.10. Quantitative Real-time PCR analysis
Total RNA was isolated from liver tissues using TRIzol reagent (Invitrogen, Carlsbad, CA, USA) according to the manufacturer’s protocol. RNA purity and concentration were determined using a spectrophotometer (Ultrospec 2100 pro UV/Visible, Amersham Bioscience, Freiburg, Germany). Total RNA 1μg was synthesized to cDNA using the GeneAmp RNA PCR Kit (Applied Biosystems, Foster City, CA, USA) with oligo-dT (Applied Biosystems). For polymerase chain reaction (PCR) amplification was performed to measure the mRNA levels of transforming growth factor β1, type 1 collagen, and α-smooth muscle actin using sequence-specific primers (Table 2). Quantitative Real-time PCR using SYBR Green PCR Master Mix (Applied Biosystems) was performed in an ABI PRISM 7900HT Sequence Detection System (Applied Biosystems) according to the manufacturer’s instructions. Data were analyzed using SDS2.2.2 software (Applied Biosystems). The cycle threshold (Ct) values of the target genes were normalized to the Ct values of the endogenous control (glyceraldehyde-3-phosphate dehydrogenase). Relative changes were calculated using the equation 2–ΔΔCt.
22
Table 2. Primers for real-time PCR
Gene Forward/reverse Primer sequence
Rat GAPDH Forward 5′-AGCCCAGAACATCATCCCTG-3′ Reverse 5′-CACCACCTTCTTGATGTCATC-3′ Rat TGF- β1 Forward 5′-CCTGGAAAGGGCTCAACAC-3′ Reverse 5′-CAGTTCTTCTCTGTGGAGCTGA-3′ Rat collagen-1 Forward 5′-CATGTTCAGCTTTGTGGACCT-3′ Reverse 5′-GCAGCTGACTTCAGGGATGT-3′ Rat a-SMA Forward 5′-CGATAGAACACGGCATCATCAC-3′ Reverse 5′-GCATAGCCCTCATAGATAGGCA-3′ GAPDH, glyceraldehyde-3-phosphate dehydrogenase; TGF-β1, transforming growth factor-beta 1; collagen-1, type 1 collagen; α-SMA, α-smooth muscle actin
23
1.11. Western blot
For total protein extracted from liver tissues, tissues homogenized by the TissueLyser II (QIAGEN GmbH, Haan, Germany) with a tissue protein extraction reagent (T-PER; Pierce, Rockford, IL, USA). The lysates were centrifuged at 13,000 rpm for 15 min at 4°C and supernatants were collected and used for Western blotting. Protein concentration was determined using the Bio-Rad protein assay kit (Bio-Rad Laboratories Inc., Hercules, CA).
Thirty micrograms of each protein sample were electrophoresed on 10% sodium dodecylsufate-polyacrylamide gel and then transferred to polyvinylidene difluoride (PVDF) membrane (Millipore, Bedford, MA, USA). The membranes were blocked with 5% skim milk in Tris-Buffered Saline (TBS) containing 0.05% Tween-20 for 1 hr at room temperature and primary antibody incubation at 4°C overnight. Primary antibodies are TGF-ß1(Abcam, Cambridge, MA, USA), α-SMA (Abcam, Cambridge, MA, USA), Smad 2/3 (Cell Signaling Technology, Danvers, MA, USA) and phospho Smad2/3 (Cell Signaling Technology, Danvers, MA, USA).
Horseradish peroxidase (HRP)-conjugated secondary antibody against either mouse IgG (Abcam, Cambridge, MA, USA) or rabbit IgG (Cell Signaling Technology, Danvers, MA, USA) was incubated for 1 hr at room temperature. Specific protein bands on the membranes were visualized by the enhanced chemiluminescence (ECL) detection kit (Amersham, Piscataway, NJ, USA). To normalize between experiments, membranes probed with a β-actin (Abcam, Cambridge, MA, USA) and the intensity of each protein band was normalized to the intensity of β-actin.
24
2. In vitro study
2.1. HSC culture
It has been proven that immortalized HSCs with hTERT (human telomerase reverse transcriptase) are useful in the research of hepatic fibrogenesis. Characterization by immunofluorescence for α-SMA revealed a purity of >96%. Human HSCs were plated in a 75cm2 flask with DMEM containing 10% FBS and 1% penicillin/streptomycin, and cultured at 37°C in a 5% CO2 atmosphere.
25
2.2. Coculture system
For direct coculture of HSCs and MSCs, cells were seeded at a 1:1 ratio in each well of a 12 or 96 well plate (Corning, NY, USA). Cocultures were maintained in DMEM medium for 4 days.
An indirect coculture system between HSCs and MSCs was assembled using Transwell membranes (12 mm diameter, 0.4 m pore size, Corning, NY, USA). Approximately 5 X 10⁴ HSCs were placed in the lower chamber with 5 X 10⁴ BM-MSCs placed on the membrane insert. Indirect cocultures were maintained in DMEM medium for 2days.
26
2.3. Cytokine levels analysis
The indirect coculture system, the transwell insert containing MSCs was removed and the medium on the HSCs was replaced with fresh medium. Supernatants were collected after 48 hrs of indirect coculture system. Quantification of human TGF-ß1, IL-6, IL-10, and HGF from culture supernatant was determined using enzyme-linked immunosorbent assay kit (R&D Systems, Minneapolis, MN, USA), following the manufacturer's instructions. The absorbance of each well was measured at 490nm wavelength using a microplate reader ELX 800 (Bio-Tek Instruments, Inc., Winooski, VT, USA).
27
2.4. Cell viability analysis
Cell viability assays performed using a CellTiter 96® AQueous One Solution Reagent ELISA kit (Promega, Madison, WI, USA). The CellTiter 96 Aqueous One Solution contains MTS [3-(4,5-dimethylthiazol-2-yl)-5-(3-carboxymethoxyphenyl)-2-(4-sulfophenyl)-2H-tetrazolium, inner salt] compound and an electron coupling reagent PES [phenazine ethosulfate]. The MTS compound is bioreduced by mitochondrial enzymes of cells into a colored formazan product that is soluble in cell culture medium. Briefly, for direct coculture of HSCs and MSCs, cells were seeded at a 1:1 ratio in each well of a 96 well plate (Corning, NY, USA). Cocultures were maintained in DMEM medium for 4 days. Assays are performed by adding a small amount of the CellTiter 96® AQueous One Solution Reagent directly to culture wells, incubating for 2 hrs and then recording the absorbance at 490nm wavelength using a microplate reader ELX 800 (Bio-Tek Instruments, Inc., Winooski, VT, USA).
28
2.5. Apoptosis analysis
Quantification of cell apoptosis was measured using a Cell Death Detection ELISA kit (Roche Applied Science, Indianapolis, IN). Cell Death Detection ELISA kit was used to quantify histone-complexed DNA fragments (nucleosomes) in cytoplasm of the apoptotic cells after induction of apoptosis.
Briefly, for direct coculture of HSCs and MSCs, cells were seeded at a 1:1 ratio in each well of a 12 well plate (Corning, NY, USA). After direct coculture of HSCs and MSCs for 4 days, cells were lysed with cell lysis buffer. Mouse monoclonal antibodies against single-strand DNA and histones (H1, H2a, H2b, H3, and H4) specifically detected and bound mononucleosomes and oligonucleosomes derived from cells undergoing apoptosis. Biotinylated antihistone antibodies then fixed the antibody-nucleosome complexes to the streptavidin-coated microtiter plate. The anti-DNA antibodies were conjugated with a peroxidase that reacted with the substrate ABTS [2,2V-azino-di(3-ethylbenzthiazolinsulfonate)] to form a colored product. The remaining steps were carried out according to the instructions supplied by the manufacturer. The absorbance of each well was measured at 405nm wavelength using a microplate reader ELX 800 (Bio-Tek Instruments, Inc., Winooski, VT, USA).
29
3. In clinical study
3.1. Patients
This study was conducted prospectively as an open-label trial involving one center in Korea. The Institutional Review Board of the hospital and the Korea Food and Drug Administration (KFDA) approved the protocol (KFDA clinical trial no. 687), and written informed consent to participate in the study was received from all of the participating patients. The registered number of Clinicaltrial. gov is NCT01741090. The study was conducted following the principles of the Declaration of Helsinki (revised in Edinburgh 2000).
Patients between 37 and 60years of age with biopsy-proven AC who visited the Yonsei University Wonju College of Medicine, Wonju Christian Hospital between May 2010 and Jan 2011 and discontinued alcohol intake for at least 6months prior to participating in this study (to exclude the influence of inflammation by recent alcohol consumption) were considered eligible for the study 32, 33. We presumed that 6months of abstinence from alcohol might further reduce the active inflammation and allow stabilization of the liver histology in most of our participants, and play an essential role in eliminating the bias that may occur with severe inflammation resulting from recent consumption of alcohol.
Patients who did not provide informed consent were excluded from the study. In addition, patients younger than 20 or older than 65years, with hepatitis B or C virus-related cirrhosis, severe liver failure (serum bilirubin >85µmol/L), hepatic
30
encephalopathy, hepatorenal syndrome, recurrent gastrointestinal bleeding, spontaneous bacterial peritonitis, presence of liver tumor or history of other cancer, and pregnant or lactating were also excluded from this study. (Fig. 4)
Radiological imaging studies including ultrasonography and computed tomography scan, and laboratory studies were conducted on each patient to determine the Child-Pugh score and the model for end-stage liver disease (MELD) score. Other causes of liver disease were excluded by performing serologic tests for hepatitis B and C infection, and autoantibodies.
According to these criteria, 12 consecutive patients were initially considered for the study. One patient who had continued to consume alcohol (continuous alcohol intake of more than 60g/week) was withdrawn from this study. Thus, 11 patients were ultimately enrolled. The general characteristics of the patients are listed in Table 3.
31
32
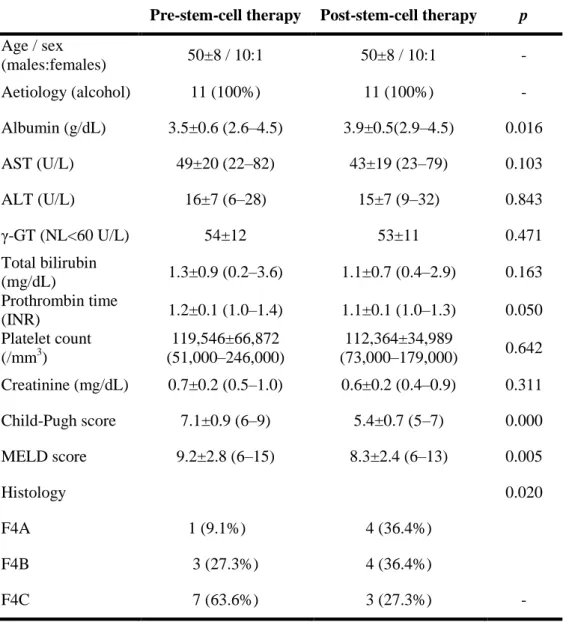
Table 3. General characteristics of the patients
Pre-stem-cell therapy Post-stem-cell therapy p
Age / sex (males:females) 50±8 / 10:1 50±8 / 10:1 - Aetiology (alcohol) 11 (100%) 11 (100%) - Albumin (g/dL) 3.5±0.6 (2.6–4.5) 3.9±0.5(2.9–4.5) 0.016 AST (U/L) 49±20 (22–82) 43±19 (23–79) 0.103 ALT (U/L) 16±7 (6–28) 15±7 (9–32) 0.843 γ-GT (NL<60 U/L) 54±12 53±11 0.471 Total bilirubin (mg/dL) 1.3±0.9 (0.2–3.6) 1.1±0.7 (0.4–2.9) 0.163 Prothrombin time (INR) 1.2±0.1 (1.0–1.4) 1.1±0.1 (1.0–1.3) 0.050 Platelet count (/mm3) 119,546±66,872 (51,000–246,000) 112,364±34,989 (73,000–179,000) 0.642 Creatinine (mg/dL) 0.7±0.2 (0.5–1.0) 0.6±0.2 (0.4–0.9) 0.311 Child-Pugh score 7.1±0.9 (6–9) 5.4±0.7 (5–7) 0.000 MELD score 9.2±2.8 (6–15) 8.3±2.4 (6–13) 0.005 Histology 0.020 F4A 1 (9.1%) 4 (36.4%) F4B 3 (27.3%) 4 (36.4%) F4C 7 (63.6%) 3 (27.3%) -
AST, aspartate aminotransferase; ALT, alanine aminotransferase; γGT, gamma glutamyl transferase; MELD, Model for End-stage Liver Disease
33
3.2. BM aspiration, isolation of MSCs, and cell culture
Approximately 10–20mL of BM was aspirated from the posterior iliac crest of patients under local anesthesia. BM mononuclear cells were isolated by density-gradient centrifugation (Histopaque-1077, Sigma-Aldrich, St. Louis, MO, USA). Mononuclear cells (2–3×10⁵cells/cm2) were plated in a 75 cm2 flask (Falcon, Franklin Lakes, NJ, USA) with low-glucose Dulbecco’s modified Eagle’s medium (DMEM; Gibco, Grand Island, NY, USA) containing 10% fetal bovine serum (Gibco) and 1% penicillin/streptomycin (Gibco), and cultured at 37°C in a 5% CO2 atmosphere.
3.3. Immunophenotypes and differentiation assays of BM-MSCs
The immunophenotypes of the BM-MSCs (CD14, CD34, CD45, CD73, and CD105) were analyzed on the day of injection, and their differentiation potentials were determined (osteogenesis and adipogenesis; Fig.5). For immunophenotype analysis, BM-MSCs were stained with antibodies conjugated with fluorescein isothiocyanate (FITC) or phycoerythrin (PE): CD14-FITC, CD34-FITC, CD45-FITC, CD73-PE, and CD105-PE (BD Biosciences, San Jose, CA, USA).
34
3.4. Autologous BM-MSCs injections
On the day of the injection, MSCs were harvested using trypsin/EDTA, washed twice with PBS and once with saline solution, and then resuspended at a final concentration of 5×10⁶cells/mL in 10mL of saline solution (i.e., 5×10⁷ cells). Criteria regarding the clinical use of MSCs included viability greater than 80%, absence of microbial contamination (bacteria, fungus, virus, or mycoplasma) when tested 3– 4days before administration, expression of CD73 and CD105 by more than 90% of the cells, and absence of CD14, CD34, and CD45 in less than 3% of the cells, as assessed by flow cytometry. Each time the 5×10⁷ cells in 10mL of saline were injected at 4 and 8 weeks via the right hepatic artery by a coaxial angiographic catheter (Boston Scientific, Natick, MA, USA). Injections of BM-MSCs were performed using coaxial angiographic catheters (Boston Scientific) placed in the hepatic artery. Continuous monitoring was performed via leukapheresis as well as the injection procedure, and any hemodynamic changes were recorded.
35
3.5. Follow-up
After enrollment, patients were followed-up according to the study design. The patients did not receive any other medications in the study. Alcohol side effects were monitored every week by phone call to the patients and their family, and during their monthly visits to the hospital. Clinical and biochemical tests for the assessment of the side effects present were also performed at each hospital visit. Any evidence of drinking alcohol would result in the subject being withdrawn from the study. A follow-up liver biopsy was performed 12 weeks after the second therapeutic BM-MSCs injection. (Fig. 4)
36
3.6. Primary and secondary outcomes
The primary outcome was the improvement of histological findings, which required improvement of at least 1 point on the Laennec fibrosis scoring system. The secondary outcome included changes in the Child-Pugh score, direct markers related to hepatic fibrosis, and the development of side effects.
37
3.7 Histomorphological and immunohistochemical analysis
Paired liver biopsies were performed at baseline and 12 weeks after the second therapeutic autologous BM-MSCs injection. Five micrometer thick sections of paraffin-embedded liver biopsy samples were prepared and stained with hematoxylin and eosin (H&E), Masson’s trichrome (MTC), α-smooth muscle actin (α-SMA), and Picrosirius Red. Fibrosis was evaluated using both the Laennec fibrosis scoring system (Table1, Fig. 14) and the METAVIR fibrosis scoring system by two liver pathologists were blinded to the clinical data of the patients 30, 34. To estimate the chance adjusted agreement, the kappa value was calculated for inter-observer agreement equaling the value of 0.87. When the two pathologists disagreed, they discussed and reached a consensus on the fibrosis score.
Liver biopsy specimens that were ≥15mm long and ≥1.2mm wide were required for the study. In fragmented biopsies, the total length was estimated by adding the maximum dimensions of each individual fragment. In using the Laennec system, the thickness of the predominant type of septae in each specimen was chosen and the smallest nodule was selected for scoring. The Laennec fibrosis scoring system was used because this system divides cirrhosis into three subclasses, allowing for a more detailed estimation of fibrosis after intervention 30. In addition, to estimate any treatment-induced change in liver fibrosis, the fibrosis area was quantified as a percentage of the total area that was positive for MTC stain in the digital photomicrographs using a computerized image-analysis system (analySIS 3.0, Soft Imaging System, Münster, Germany). To quantify the fibrosis area, microscopic areas
38
were selected randomly at an original magnification of ×100. For immunohistochemical analysis, tissue sections were incubated with primary antibody against α-SMA (diluted 1:800, Neomarkers, Fremont, CA, USA) for 90 min at room temperature after washing with buffer. Tissue sections were incubated with the chromogen 3-amino-9-ethylcarbazole (BioGenex, San Ramon, CA, USA) for 5–7 min. Prior to mounting, the sections were counterstained with hematoxylin and then dehydrated. An UltraVision LP Large Volume Detection System (Lab Vision, Runcorn, UK) was used as the detection system. Morphological analysis of immunopositive cells was also performed with a computerized image-analysis system. Picrosirius Red staining was performed to quantify the total amount of collagen. Five micrometer thick sections of paraffin-embedded liver biopsy specimens were deparaffinized and rehydrated with distilled water and stained with a Picrosirius Red staining kit (Polysciences, Warrington, PA, USA) according to the manufacturer’s instructions. In addition, the amount of collagen (the main component of fibrous tissue) was estimated from the collagen proportionate area, expressed as the percentage of the total area that was positive for Picrosirius Red stain on microscopy (Olympus BX51, Tokyo, Japan) using a computerized image-analysis system (IMT i solution, Vancouver, Canada). While measuring the collagen proportionate area, we eliminated image artifacts and structural collagen in large portal tracts and blood vessel walls 31.
39
3.8. Quantitative Real-time PCR analysis
Total RNA was isolated from paired liver biopsy samples using TRIzol reagent (Invitrogen) according to the manufacturer’s protocol. Total RNA 1μg was synthesized to cDNA using the GeneAmp RNA PCR Kit (Applied Biosystems, Foster City, CA, USA) with oligo-dT (Applied Biosystems). For polymerase chain reaction (PCR) amplification, sequence-specific oligonucleotide primers for the genes of interest were designed based on human specific sequences in the GenBank database (Table 4). Quantitative Real-time PCR using SYBR Green PCR Master Mix (Applied Biosystems) was performed in an ABI PRISM 7900HT Sequence Detection System (Applied Biosystems) according to the manufacturer’s instructions. Data were analyzed using SDS2.2.2 software (Applied Biosystems). The cycle threshold (Ct) values of the target genes were normalized to the Ct values of the endogenous control (glyceraldehyde-3-phosphate dehydrogenase). Relative changes were calculated using the equation 2–ΔΔCt.
40
Table 4. Primers for real-time PCR
Gene Forward/reverse Primer sequence
Human GAPDH Forward 5′-AATGAAGGGGTCATTGATGG-3′ Reverse 5′-AAGGTGAAGGTCGGAGTCAA-3′ Human TGF- β1 Forward 5′-TTTTGATGTCACCGGAGTTG-3′ Reverse 5′-AACCCGTTGATGTCCACTTG-3′ Human collagen-1 Forward 5′-CACACGTCTCGGTCATGGTA-3′ Reverse 5′-AAGAGGAAGGCCAAGTCGAG-3′ Human a-SMA Forward 5′-CACTGCCTTGGTGTGTGACAAT-3′ Reverse 5′-CGTAGCTGTCTTTTTGTCCCATTC-3′
GAPDH, glyceraldehyde-3-phosphate dehydrogenase; TGF-β1, transforming growth factor-beta 1; collagen-1, type 1 collagen; α-SMA, α-smooth muscle actin
41
4. Statistical analysis
4.1. In vivo study
Values are expressed as means ± standard deviation. Analysis was conducted using nonparametric analysis with the Kruskal-Wallis H tests. All analyses were performed using SPSS software version 12.0 (SPSS, Chicago, IL, USA). For all tests, P values of <0.01 were considered statistically significant.
4.2. In vitro study
Values are expressed as means ± standard deviation. Analysis was conducted using nonparametric analysis with the Mann-Whitney U tests. All analyses were performed using SPSS software version 12.0 (SPSS, Chicago, IL, USA). For all tests, P values of <0.01 were considered statistically significant.
4.3. In clinical study
The outcomes were analyzed using per-protocol (PP) analysis. Comparisons were made using Fisher’s exact test, Mann-Whitney U test, and Wilcoxon signed-rank test. Values are expressed as means ± standard deviation. All analyses were performed using SPSS software version 12.0 (SPSS, Chicago, IL, USA). For all tests, P values of <0.01 were considered statistically significant.
42
III. RESULTS
1. In vivo study
1.1 Immunophenotypes and differentiation potentials of the
BM-MSCs.
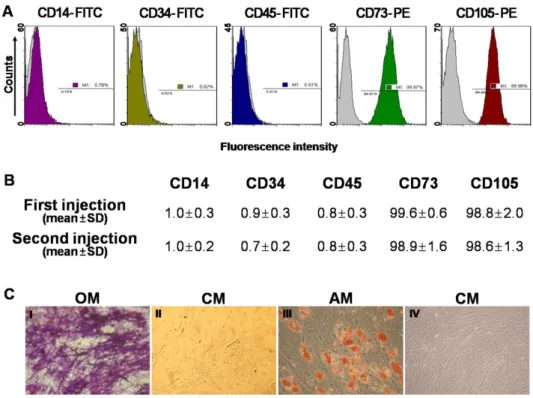
The immunophenotypes for CD14, CD34, CD45, CD73, and CD105 cells were determined and osteogenic or adipogenic differentiation was induced on the day of autologous BM-MSCs injection (Fig. 5). In both the first and second injected cell populations, CD73 or CD105 (which are positive markers of BM-MSCs) were expressed in more than 98% of the cells. However CD14, CD34, or CD45 (which are known to be negative markers of BM-MSCs) were expressed in less than 1% of the cells (Fig. 5B). BM-MSCs could be differentiated into osteocytes and adipocytes (Fig. 5C).
43
Figure 5. Immunophenotypes and differentiation potentials of the
BM-MSCs.
(A) The expressions of cell-surface antigens (CD14, CD34, CD45, CD73, and CD105) were evaluated by flow cytometry. (B) Representative histograms for the positive populations represent averages for patients with the indicated standard deviations. (C) BM-MSCs stained positively for endogenous alkaline phosphatase activity, indicating osteogenic differentiation within an osteogenic medium (OM; I), or stained negatively in control medium (CM; II). BM-MSCs stained positively for lipid droplets, indicating adipogenic differentiation within adipogenic medium (AM; III), or stained negatively in CM (IV) (×200).
44
1.2. Imaging of injection labeled BM-MSCs in hepatic fibrosis
CELL-STALKER was selected as the labeling system for in vivo cell tracking of BM-MSCs. To facilitate the identification of BM-MSCs tracking, we first labeled BM-MSCs with CELL-STALKER and then injected in hepatic fibrosis rats, which were sacrificed 0, 3, 7, 14 days after injection. Fluorescence red labeled BM-MSCs were observed at 0, 3, 7, 14 days after direct injection to hepatic fibrosis rats. Fluorescence was maintained for 14 days in liver tissue. However fluorescence intensity from labeled BM-MSCs was gradually reduced and disappeared at 14 days (Fig. 6).
45
DIC labeled BM-MSCs Merge
(A) TAA+MSCs 0day
(B)TAA+MSCs3days
(C) TAA+MSCs 7days
(D)TAA+MSCs14days
46
Fluorescence red labeled BM-MSCs were observed at 0, 3, 7, 14 days after direct injection to hepatic fibrosis rats (X200).
47
1.3. Histological and immunohistochemical analysis in vivo
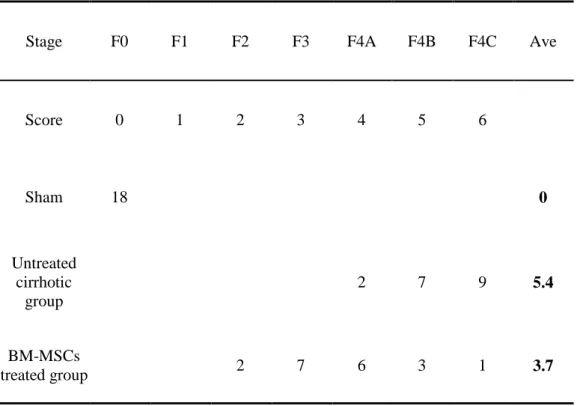
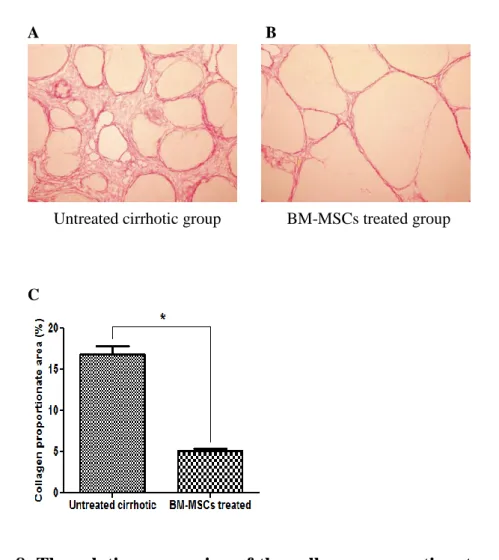
The Laennec fibrosis scoring system revealed detailed individual changes within the cirrhotic tissue (F4A–F4C; Table 1). Histological analysis was evaluated by H&E and MTC staining (Fig. 7). In untreated cirrhotic group, liver sections were strongly stained by H&E and MTC showed definite cirrhosis (stage 4 fibrosis) with regenerating nodules and fibrous septae (Fig. 7A, 7B), whereas BM-MSCs treated group showed mild fibrosis (Fig. 7C, 7D). To compare these findings, the degree of fibrosis was scored according to the Laennec fibrosis scoring system. The BM-MSCs treated group had a significantly lower mean score than that of the untreated cirrhotic group (Table 5). According to the Laennec fibrosis system, histologically, BM-MSCs treated group showed significant improvement of hepatic fibrosis compared to untreated cirrhotic group (P<0.01). These results were further confirmed by immunohistochemical staining revealing α-SMA expression and Picrosirius Red staining (Fig. 8). The relative expression of the collagen proportionate area stained by Picrosirius Red was analyzed using an image-analysis program. The percentage of collagen proportionate area significantly decreased from 16.72 ± 5.51 to 5.06 ± 1.27 after BM-MSCs treatment (P<0.01) (Fig. 8).
48
Table 5. The histological sub-classification according to the Laennec
fibrosis scoring system.
Stage F0 F1 F2 F3 F4A F4B F4C Ave
Score 0 1 2 3 4 5 6 Sham 18 0 Untreated cirrhotic group 2 7 9 5.4 BM-MSCs treated group 2 7 6 3 1 3.7
49
A B
Untreated cirrhotic group
C D
BM-MSCs treated group
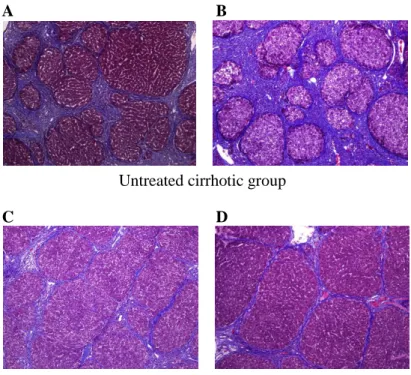
Figure 7. Histological and Immunohistochemical analysis in vivo
Histological analysis was evaluated by MTC staining (×100). (A) show cirrhosis with at least two broad septa and minute nodules (F4B), (B) show cirrhosis with at least one broad septum with minute nodules (F4C). (C) and (D) show cirrhosis with marked septation with rounded contours or visible large nodules (F4A). BM-MSCs treatment induced an improvement of cirrhosis from F4B (A) or F4C (B) to F4A (C, D) according to the Laennec fibrosis scoring system.50
A B
Untreated cirrhotic group BM-MSCs treated group
C
Figure 8. The relative expression of the collagen proportionate area
in vivo
Collagen deposition by Picrosirius Red stain of liver sections with (A) untreated cirrhotic group and (B) BM-MSCs treatment (×100). (C) Quantification of the collagen proportionate area by Picrosirius Red stain was analyzed with image analysis. Quantification of the collagen proportionate area was done by morphometry in 5 high-power fields. The percentage of collagen proportionate area decreased from 16.72 ± 5.51 to 5.06 ± 1.27 after BM-MSCs treatment (P<0.01) (Fig. 8C). Values are expressed as means ± standard deviation. *P<0.01.
51
1.4. Measurement of hepatic hydroxyproline content in vivo
The content of hepatic hydroxyproline was quantified colorimetrically from liver tissues. Quantitative analysis showed that the content of hepatic hydroxyproline of the liver tissue were 16.44 ± 4.07, 85.81 ± 17.62 and 46.25 ± 13.19 (P<0.01) in G1, G2 and G3, respectively (Fig. 9). The content of hepatic hydroxyproline was significantly lower in the BM-MSCs treated group than in the untreated cirrhotic group.
52
Figure 9. The
content of hepatic hydroxyproline
in vivo
The content of hepatic hydroxyproline was quantified colorimetrically from liver tissues. Quantitative analysis showed that the content of hepatic hydroxyproline of the liver tissue were 16.44 ± 4.07, 85.81 ± 17.62 and 46.25 ± 13.19 (P<0.01) in G1, G2 and G3, respectively. Values are expressed as means ± standard deviation. *P<0.01.
53
1.5. The mRNA levels of TGF-
1, type 1 collagen and α-SMA in vivo
After stem cells administration, the mRNA relative expressions of transforming growth factor β1 (TGF-1), type 1 collagen (collagen-1), and α-smooth muscle actin (α-SMA) were measured by quantitative real-time reverse transcription-polymerase chain reaction (RT-PCR) analysis. The mRNA relative expressions of type 1 collagen were 1 ± 0.39, 14.04 ± 4.54, 4.74 ± 2.46 (P<0.01) in G1, G2 and G3, respectively (Fig. 10B). Also, the mRNA relative expressions of TGF-β1 and α-SMA in real-time PCR were 1 ± 0.27, 4.61 ± 0.61, 2.14 ± 0.35 (P<0.01) and 1 ± 0.32, 8.83 ± 3.12, 2.62 ± 0.41 (P<0.01) in G1, G2 and G3, respectively (Fig. 10A, C). The mRNA relative expressions of transforming growth factor β1 (TGF-1), type 1 collagen (collagen-1), and α-smooth muscle actin (α-SMA) in the BM-MSCs treated group were significantly decreased compared to the untreated cirrhotic group (P<0.01).
54
A B
C
Figure 10. The mRNA levels of TGF-
1, type 1 collagen and α-SMA
in vivo
After administration of BM-MSCs therapy, the relative expressions of (A) TGF-1, (B) collagen-1, and (C) α-SMA by real-time PCR were decreased significantly 1 ± 0.27, 4.61 ± 0.61, 2.14 ± 0.35 and 1 ± 0.39, 14.04 ± 4.54, 4.74 ± 2.46 and 1 ± 0.32, 8.83 ± 3.12, 2.62 ± 0.41 (P<0.01) in G1, G2 and G3, respectively (Fig. 10). Values are expressed as means ± standard deviation. *P<0.01.