Zoom-FFT 기반 FMCW 레이더 레벨미터의 설계 및 성능분석
누완*, 김원호* 종신회원
Design and Performance Analysis of Zoom-FFT Based FMCW Radar Level Meter
Nuwan Sanjeewa*, Won-Ho Kim* Lifelong Member
요 약
본 논문은 FMCW(Frequency Modulated Continuous Wave) 레이더 레벨 측정기 설계와 시뮬레이션을 통한 성능분석에 대하여 기술 한다. 설계된 레벨미터는 FMCW radar를 이용하여 최대 20m 거리를 측정하며, 거리 계산을 위한 비트신호 분석기법으로 FFT(Fast Fourier Transform)와 Zoom-FFT를 적용하였다. 성능 분석을 위해 시뮬레이션을 통하여 두가지 기법을 비교 분석한 결과, 측정오류 를 최소화하고 측정의 분해능을 향상시키기 위해서는 Zoom-FFT 기법이 보다 적절한 기법임을 확인하였다. 시뮬레이션은 주파수 분해능과 측정거리 분해능의 최적 값을 얻기 위해 다양한 조건에서 분석하였고, 1.024GHz 주파수 조건에서 2.2mm의 측정 분해능을 확인하였다.
Key Words : FMCW Radar, Radar level meter, Fast Four Transform, Zoom-FFT
ABSTRACT
This paper presents design of a FMCW (Frequency Modulated Continuous Wave) level meter as well as simulation result of the designed system. The system is designed to measure maximum range of 20m since FMCW radar can be used for measuring short range distance. The distance is measured by analyzing the beat signal which is generated as result of mixing transmitting signal with the reflected received signal. The Fast Fourier Transform is applied to analyze the beat signal for calculating the displacement and Zoom FFT technique is used to minimize measurement error as well as increase the resolution of the measurement. The resolution of the measurement of the designed system in this paper is 2.2mm and bandwidth of 1.024GHz is used for simulation. Thus the simulation results are analyzed and compared in various conditions in order to get a comprehensive idea of frequency resolution and displacement resolution.
※ 본 연구는 미래창조과학부(구 교육과학기술부)의 재원으로 과학벨트기능지구지원사업(2013K000490)과 지경부의 한국에너지기술평가원 에너지 인력양성사업의 지원을 받아 수행된 연구임.
*공주대학교 전기전자제어공학부, 교신저자 : 김원호 ([email protected])
접수일자 : 2014년 5월 6일, 수정완료일자 : 2014년 5월 26일, 최종게재확정일자 : 2014년 5월 28일
I. Introduction
Developing any type of level meter is an essential task in modern industry since high accuracy measurement is needed due to the variations and complexity of available applications when liquids, powders and solids are considered[1]. There are two major types of method for level measuring in liquid tanks, contact and non contact type. Contact type is the method that a part of the measuring instrument is directly connected to the surface of the fluid. It is easy to implement since the system is not complex and low cost depending on the applications.
However there are some disadvantages of this method.
This method can’t be used in all the applications as it is since some of the liquids are chemically react with the measuring devices and also it makes system to be danger.
Also the number of sensors should be increased and the physical structure or the position of the measuring device should be changed in order to obtain high accuracy readings. Oppositely, the non contact method has advantages such as relatively high accuracy rate than contact method, and the measurement devices should not connected physically to the surface of the fluid. Thus the non contact level measuring devices easy to use since it
can be used continuously once properly installed. But some errors can be included in the measurements since speed of the radio waves changed depending on temperature and pressure in the tank. Also the structure complexity of the tank affects to the level measurements[2]. However there is anon contact method which called as radar level transmitter and it tends to have low error rate since it is not affected by the inside state of the tank. This method is widely used in industrial application such as chemical tank, cargo tank, oil vessels, vehicle security systems, etc. FMCW (Frequency Modulated Continuous Wave) radar is usually used for level gauging in many industrial applications [3]. Single frequency CW radar can’t be used for distance measurements because there is no time reference mark to gauge the delay in the return echo from the target. A time reference can be achieved by modulating the frequency in a known manner. If the frequency of the transmitted signal is ramp up in a linear fashion, the difference between the transmitting frequency and the frequency of the returned signal will be proportional to the distance to the target. The difference signal is called beat signal and its frequency is called beat frequency and the distance is measured by analyzing the beat frequency using Fast Fourier Transform (FFT)[4][5]. The accuracy and resolution of the distance reading is proportionally affected by the frequency resolution of the system. The frequency resolution of the traditional FFT is limited depending on the sampling frequency and the number of sampling data that used to compute FFT. Therefore the frequency resolution must be more precise. But the frequency resolution unable to be changed by adjusting those two parameters that mentioned above since most of systems have some hardware limitations such as memory, processing speed, etc. Furthermore, the beat signal is highly damaged by noise and it is not easy to get the real beat frequency by only using FFT. There for it needs to develop another method to improve the frequency resolution.. In this paper, it has proposed Zoom FFT processing for improving the system resolution. The simulation was done by assuming the designing system has some hardware limitations. The simulation result shows that the distance resolution of the proposed system is in range of 2.2mm.
II. FMCW Radar System and Theory of Distance Measurements
1. Hardware Design of the Radar System
Figure 1 shows the hardware block diagram of most common FMCW radar system. The essential component of frequency modulated continuous wave radar is the linear sweep control circuitry. A linear ramp generator feeds a voltage controller which in turn ramps up the voltage controlled Oscillator. A very accurate linear sweep is required. The frequency modulated signal is directed to the antenna and hence towards the product in the vessel.
Fig. 1. Hardware block diagram of FMCW radar system
The received echo signals ± are mixed with a part of the transmission signal where represents the Doppler frequency and ‘+’ means the target moves to the antenna and oppositely ‘-‘ means the target moves away from antenna[7]. These difference signals ± filtered and amplified before doing the AD conversion.
Then the sampled signal is sent to the DSP processor and FFT is carried out in DSP, then the measurements are calculated. The FFT analysis produces a frequency spectrum on which the echo processing and echo decisions are made. The is ignored since the target is assumed to be stationary at the measuring time.
2. Distance Measurements of the Radar System
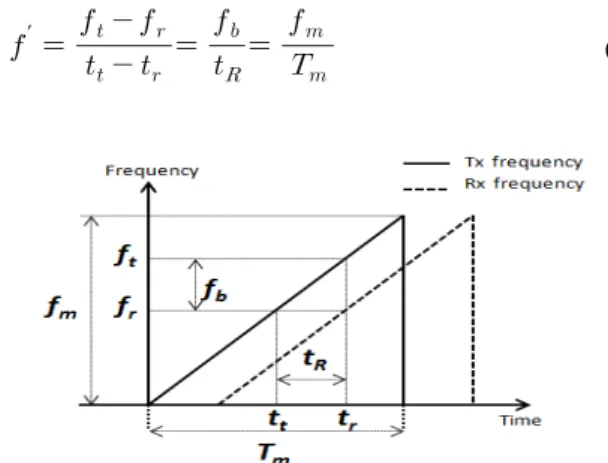
The principle of the distance measurements of FMCW radar can be arranged based on figure 2. Usually the FMCW radar system uses frequency difference also known as beat frequency to calculate the distance to the target. If the distance to target is R, and speed of light is
then the time for return journey is given by
or as in figure 2[6]. The gradient of the frequency
over time ′is given by equation (1).
′
(1)
Fig. 2. Tx frequency and Rx frequency over time
Where is the bandwidth of the frequency modulation and is the modulation period. Equation (2) can be derivate from equation (1) as follow.
(2)
Therefore the distance to target can be calculated as equation (3) that obtained from equation (2).
(3)
The distance to target can be easily calculated by just obtaining the since , and is constant.
According to the equation (3), the value of is very important and highly affected to the final measurement since value of the is proportional to the distance of the target. In order to obtain the exact value for the , the frequency resolution of the FFT must be improved. The frequency resolution of point FFT is given by equation (4).
∆
(4)
The frequency resolution ∆ can be improved by reducing sampling frequency and also increasing data points . But those parameters are unable to be change freely because there some hardware limitations such as processing speed, sampling rate of ADC, memory, etc.
Therefore it needs to develop some method to improve the
frequency resolution under specific conditions. In this paper the sampling frequency is 10KHz and 1024 data points are applied to the FFT. Therefore the given frequency resolution of the designed system is as bellow.
∆
(5)
Since the of the designedsystem is 1.024GHz and sweeping time is 0.0256s, the distance resolution can be calculated as follow.
× ×
× × ×
(6)
The basic resolution of the designed system is 36.6mm and this resolution is unable to apply in industrial applications since those application need the resolution to be in range of 10mm. Therefore the distance resolution must be improved under the mentioned condition above. In order to improve distance resolution, the frequency resolution must be improved. In this paper the Zoom FFT technique is used for improving frequency resolution of the system under specific conditions that mentioned above.
3. Improving the Distance Resolution
The duty of zoom FFT is to zoom out the frequency band that is interested[7]. That makes the frequency scale to be more precise. The steps of zoom FFT is shown in figure 3.
Fig. 3. The process of zoom FFT
At the first step the sampled signal is divided into channel and channel by multiplying with
and where the is center frequency (interested frequency) and it is given by equation (7).
∆ (7)
The is the base frequency that obtained from the first FFT
and ∆ determinate by user and it is 10Hz in this paper. In this step, the base frequency of the sampled signal is shifts to the based band as much as possible. Then the low pass filter is applied to remove the high frequencies such as noise and then this low frequency signal is decimated by . This means the low frequency signal is down sampled. And then add channel and
channel together and reconstruct the signal and then apply the FFT. Then add to the base frequency component of the zoom FFT to get the original base frequency component. The new sample frequency is given by and the decimate factor that used in designed system is 16 since the Niquist theory should be satisfied. Then the new frequency resolution under the conditions is 0.61Hz.
∆ ×
×
(8)
The improved distance resolution can be obtained by applying new frequency resolution to the equation (3) and it is shown bellow.
× ×
× × ×
(9)
The new distance resolution is 2.2mm. the figure 4 shows the part of frequency spectrum of FFT with 1024 data points and zoom FFT with same parameters that written above.
Fig. 4. FFT Vs Zoom FFT
The is obtained from fist FFT that shown by dot stem and it is 48.82Hz in the figure 4. Then is calculated according to equation (7) and then zoom FFT is applied and result can be seen by solid stems and zoomed base frequency is 3.05Hz. To obtain the frequency of original beat signal from zoom FFT, the zoomed base frequency should be added to the . Therefore the beat frequency that obtained from zoom FFT is 51.87Hz and
frequency resolution has improved. All over simulation result is discussed in next section.
Ⅲ. Simulation and Result Analysis
The simulation scheme is shown in figure 5 and simulation result for each step is shown bellow.
Fig. 5. Simulation scheme
Step 1: The transmission signal is modulated in bandwidth of 1.024GHz and sweep time is 0.025s.
Step 2: Add some noise delay to the transmissions signal at the air channel and reflects the signal from surface of the liquid as well as from the bottom of the tank, and walls.
Step 3: Mix the received signal with transmission signal and get the beat signal that gives frequency difference signal
Step 4: Sample the beat signal at 10KHz of sampling rate
Step 5: Apply FFTas well as Zoom FFT and compare the results
A part of transmission signal is shown in figure 6. The transmission signal has varying frequency over time and constant amplitude. The designed system transmits sine wave that frequency is swept as a linear ramp function and it shows in figure 7. The bandwidth is 1.024GHz that starts from 1GHz and end at 2.024GHz in period of 0.0256s.
Fig. 6. Part of transmission signal
Fig. 7. Frequency sweeping over time
Fig. 8. Part of received signal
Figure 8 shows a part of received signal and it contains noise and delay due to the two way journey. The noise is added depending on power of transmission signal. In the next step the received signal is mix with the transmission signal to get the beat signal that gives the frequency difference. Figure 9 shows part of beat signal that obtaining by mixing the signal in figure 6 and 8.
Fig. 9. Part of beat signal
In the next step, the beat signal is sampled at 10KHz.
Then the FFT is applied with 1024 data points. Figure 10 shows frequency distribution of the beat signal. The highest stem is occurred from the signal that reflected from surface of the liquid and the second highest stem is related to reflected from bottom of the tank. Also other stems are related to the reflected signal components form
the walls and other part of tank. The value of the base frequency stem is 498.064Hz and it was obtained due to the delay of 0.025us which means that the target level is 1875.00mm away from the antenna. But calculated distance according to equation (3) is 1867.72mm and it has error of 7.28mm. Now the interested frequency has obtained from first FFT and it can be used for the Zoom FFT.
Fig. 10. Amplitude spectrum of the beat signal
Figure 11 shows the Zoom FFT result and it was computed with decimate factor of 16 as explained in previous part.
Fig. 11. Result of Zoom FFT
Highest stem has values of 1.83Hz. Therefore the original beat frequency can get by adding 498.06Hz. The new value for the beat frequency 499.89Hz and newly calculated distance according the equation (3) is 1874.58mm and it has error of 0.42mm. The error of the measurements that got from Zoom FFT is fallen in range of 2.2mm and error has reduced considerably in method of Zoom FFT.
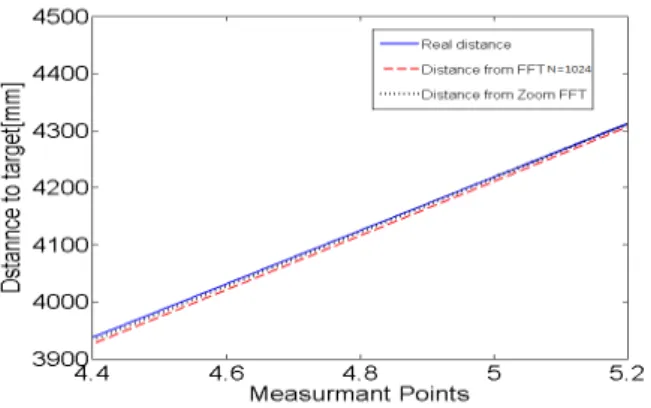
Figure 12 shows the simulation result for various target distance. The figure shows that measurements that taken from Zoom FFT are almost overlap with the real distance while the measurements that taken from FFT with 1024 points is considerably deviate from real distance.
Fig. 12. Result Comparison
Figure 13 shows the error of the measurements for both method. The dot line shows the measurement's error of FFT method and solid line represent the measurement's error over distance to target. of Zoom FFT method. The reading error of FFT method is fall in ±18mm while Zoom FFT method has error in ±1.1mm.
Fig. 13. Error Comparison
Therefore the performance of Zoom FFT method in distance measuring is far better than FFT method.
Ⅳ. Conclusion
This paper has designed and simulate FMCW level meter. The simulation result shows that Zoom FFT method can be applied for precise distance measurements, the system has some hardware limitations though. That means the level meter can be implemented with low cost and high accuracy. The reading's error of the Zoom FFT method is fallen in range of 2.2mm and it has distance resolution of 2.2mm under the specific conditions those are mentioned above. The system can uses a small memory device since this method needs just 1024 data points. it cause system to be low cost and high performance.
Next task is to develop the algorithm to have distance resolution of 1mm in same conditions. of course some algorithms are already introduced those have distance resolution of 1mm, but some of them need some high performance hardware flat form to compute them. If the algorithm is more developed, the measurement's error that due to the hardware failure such as noise, memory limitation, size of the system, etc can be avoided.
REFERENCES
[1] Guilin Zheng, Hongyan Zong,Xiangtao Zhuan, Lijuan Wang,“High-Accuracy Surface-Perceiving Water Level Gauge With Self-Calibration for Hydrography”, Sensors Journal of EEE , Vol. 10, pp. 1893-1900, 2010
[2] Weiss, Knochel, Reinhard, “A sub-millimeter accurate microwave multilevel gauging system for liquids in tanks”, IEEE Transactions on Microwave Theory and Techniques, Vol. 49, pp 381-384, 2001
[3] Gulden, Vossiek, Stelzer, “Application of state-space frequency estimation to a 24-GHz FMCW tank level gauging system”, Conference on Microwave, Vol. 3, pp.
995-998, 2003
[4] Eugin Hyun, Sang-Dong Kim, Yeong-Hwan Ju, Jong-Hun Lee, “FPGA based signal processing module design and implementation for FMCW vehicle radar systems”, IEEE CIE International Conference on Radar, Vol. 1, pp 273-275, 2011
[5] Hyun, Jonghun Lee, “Moving target range detection algorithm for FMCW radar” 14th International Radar Symposium (IRS), Vol. 2, pp. 758-761, 2013
[6] Hai Chen, Yan Li, Xin-Min Wang, “Digital Signal Processing for A Level Measurement System Based on FMCW Radar”, IEEE International Conference on Control and Automation, pp 2843-2847, 2007
[7] Suk-Jun Ji, Woo-Jin Choi, Kyung-Yup Kim, Lee, “A study on the precise distance measurement for radar level transmitter of FMCW type using correlation analysis method”, 13th International Symposium on Advanced Intelligent Systems (ISIS), pp 2009-2014, 2012
[8] Armbrecht, Zietz, Denicke, Rolfes, “Antenna Impact on the Gauging Accuracy of Industrial Radar Level Measurements”, IEEE Transactions on Microwave Theory and Techniques, vol. 59, pp 2554-2562, 2011
[9] Weiss, " Low-cost, low-power nanosecond pulse radar for industrial applications with mm accuracy", International Symposium on Electron Devices for Microwave and Optoelectronic Applications, pp. 199-204, 2001.
[10] Stuchly, Hamid, Andres, “Microwave Surface Level Monitor”, IEEE Transactions on Industrial Electronics and Control Instrumentation, vol. 18, pp. 85-92, 2006
저자
누 완 (Nuwan Sanjeewa) 정회원
․2013년 2월:공주대 전기전자제어공 학부 (공학사)
․2013년 3월~현재:공주대 대학원 전 기전자제어공학과 석사과정
<관심분야> : 영상신호처리, DSP응용
김 원 호 (Won-Ho Kim) 종신회원
․1987년 2월:경북대 전자공학 석사
․1999년 2월:충남대 전자공학 박사
․1989년 2월∼1999년 8월:한국전자 통 신연구원(ETRI) 선임연구원
․1999년 8월~현재:공주대학교 전기전 자제어공학부 교수
<관심분야> : 디지털신호처리, 위성멀티미디어통신, 지능형 영상감시 및 비젼센서