Effects of Fertilizer on Growth, Carbon and Nitrogen Responses of Foliage in a Red Pine Stand
Choonsig Kim*, Nam-Gyu Ju, Hye-Yeon Lee, and Kwang-Soo Lee
1Department of Forest Resources, Gyeongnam National University of Science and Technology, Jinju 660-758, Korea
1
Southern Forest Research Center, Korea Forest Research Institute, Jinju 660-300, Korea
This study was to examine growth, carbon and nitrogen responses in foliage following forest fertilization in a red pine stand. Two types of fertilizer (N:P:K=113:150:37 kg ha
-1; P:K=150:37 kg ha
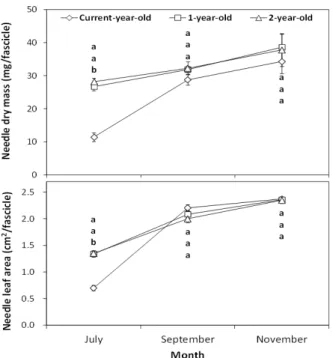
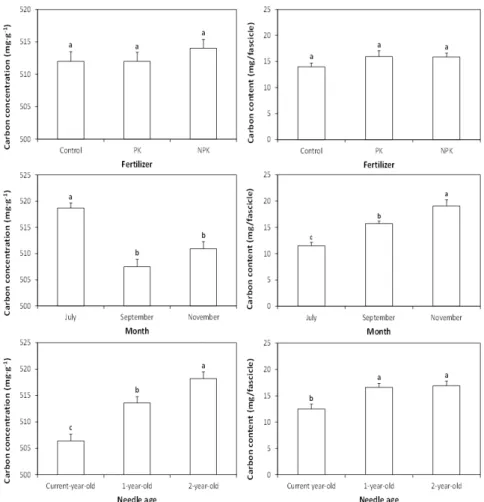
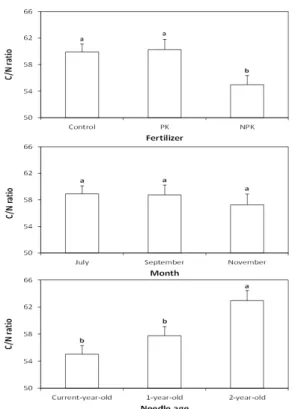
-1) were applied on late April 2011. Growth, carbon and nitrogen responses of foliage were monitored 3 times (July, September, November) after fertilization. Morphological growth responses (dry mass, leaf area, specific leaf area) with foliage age were not significantly ( P > 0.05) affected by fertilizer application, while needle dry mass and leaf area of July were significantly lower in current-year-old than in one-year-old or two-year-old needles of September or November. Carbon concentration and content in foliage was little affected by fertilizer application compared with sampling month or needle age, while the NPK fertilizer produced high nitrogen concentration and content of foliage. The results indicate that nitrogen concentration and content in foliage may serve as an indicator of the nitrogen status by fertilization in a red pine stand.
Key words: Carbon, Fertilization, Foliage analysis, Nitrogen, Red pine
Received : 2012. 10. 2 Accepted : 2013. 1. 9
*Corresponding author : Phone: +82557513247 E-mail: [email protected]
Introduction
Needle analysis following fertilizer application has received considerable research attention because the nutrient concentrations of foliage are an important parameter to assess the nutrient requirements and deficiencies in forest stands (Weetman and Wells, 1990; Barron-Gafford et al., 2003; Tausz et al., 2004). Generally, nutrient concentrations of foliage have been accepted as good indicators of growth and soil fertility on site (Bauer et al., 1997), although the nutrient status in foliage could be attributed to many environmental factors, such as soil properties, season length, water supply, and other environmental factors (Weetman and Wells, 1990).
Fertilizer application increased tree growth by the positive effects on leaf area and foliar photosynthetic rate (Garrison et al., 2000; Amponsah et al., 2005). Also, the nutrient concentrations in the living parts (needles, leaves, bark, and root) of trees increased following fertilizer application because the nutrient status of the tree is dependent on the nutrient status of the soil (Miller et al., 2006). However, the status of nutrient in foliage was depended on fertilizer types and dose, site characteristics, and tree species (Mugasha et al., 1999; Brockley, 2000; Miller et al., 2006).
There have been a myriad of nutritional problems such as nitrogen and phosphorus deficiency on forest stands in Korea (Byun et al., 2006; Son et al., 2007; Park et al., 2008). Despite of many studies on the nutrient status of forest stands following fertilizer application, there still is a lack of knowledge about growth, carbon and nitrogen responses of foliage involved in the fertilizer reaction in Korea forest stands. In addition, an understanding of nutrient status is essential for designing and timing of fertilizer application in forest stands. The objective of this study was to determine the growth, carbon and nitrogen responses of the foliage by fertilizer application, sampling month, and needle age in red pine (Pinus densiflora S. et Z.) which is the most widespread conifer tree species throughout the country.
Materials and Methods
This study was conducted in about 40-year-old natural
red pine stands in the Wola National Experimental Forest
administered by the Southern Forest Research Center,
Korea Forest Research Institute. The annual average
precipitation and temperature in this area are 1,490 mm
y
-1and 13.1 ℃, respectively. The soil is slightly dry,
dark-brown forest soil (mostly Inceptisol, United States
Soil Classification System) originating from sandstone
or shale with a silt loam texture (Table 1 and 2). The
Table 1. Stand characteristics in the study site (n=6).
Treatments Stand density DBH
†Basal area
trees ha
-1cm m
2ha
-1Control 1200 15.51 22.35
(141)
‡(0.81) (1.96)
PK 1283 16.32 22.61
(149) (1.48) (2.01)
NPK 1150 15.80 20.62
(193) (1.11) (2.38)
†
DBH: diameter at breast height (1.2 m).
‡Standard errors in parenthesis.
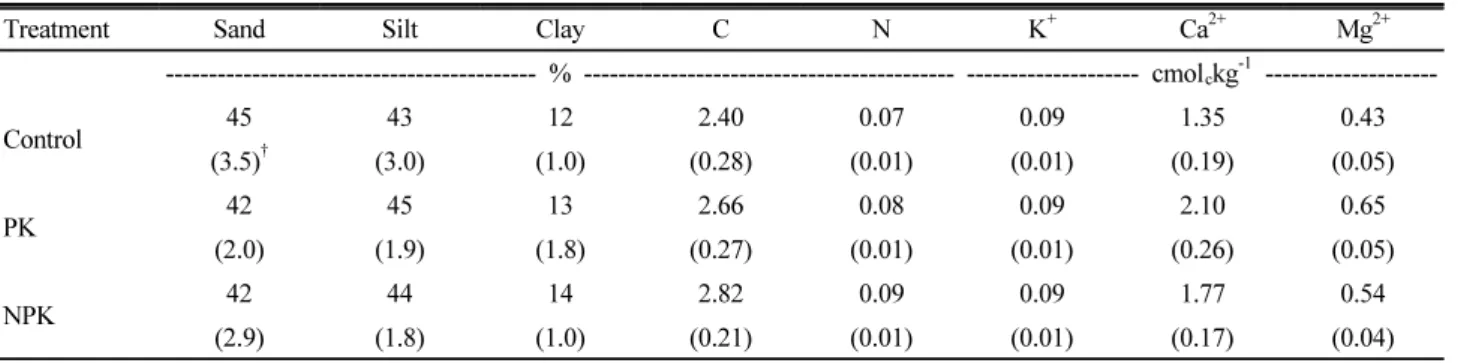
Table 2. Soil properties of the study site before fertilizer application (n=6).
Treatment Sand Silt Clay C N K
+Ca
2+Mg
2+--- % --- --- cmol
ckg
-1---
Control 45 43 12 2.40 0.07 0.09 1.35 0.43
(3.5)
†(3.0) (1.0) (0.28) (0.01) (0.01) (0.19) (0.05)
PK 42 45 13 2.66 0.08 0.09 2.10 0.65
(2.0) (1.9) (1.8) (0.27) (0.01) (0.01) (0.26) (0.05)
NPK 42 44 14 2.82 0.09 0.09 1.77 0.54
(2.9) (1.8) (1.0) (0.21) (0.01) (0.01) (0.17) (0.04)
†
Standard errors in parenthesis.
site index indicates low forest productivity (site index, 8-10 at 20-year-old base age) suggesting poor soil fertility.
The treatment plots were established on the same facing slopes and aspects under a similar environmental condition to minimize spatial variation in soil properties. The experimental design consisted of a completely randomized design with 2 blocks (35°12' 32" N, 128° 10' 23" E, 180 m; 35°
12' 26" N; 128° 10' 25" E, 195 m) involving total 18 plots [3 treatments (NPK, PK, Control) × 2 blocks × 3 replicated plots] in a mature red pine stand.
Treatment plots (plot size=10 x 10m) were randomly assigned with a 5 m buffer zone between each plot.
The combination of fertilizer types was based on the guideline (N:P:K = 113:150:37 kg ha
-1) of forest fertilization in Korea forests (Joo et al., 1982) and without nitrogen fertilizer (P:K=150:37 kg ha
-1). Urea, fused superphosphate, and potassium chloride fertilizers were used as sources of nitrogen (N), phosphorus (P), and potassium (K), respectively.
Fresh foliage samples following fertilizer application were collected at three times (1st of July, 8th of September, and 7th of November, 2011) with pole pruners from the mid-crown of two or three dominant trees per each treatment plot. The foliage samples with plastic zipper bags were transported to the laboratory and sorted by
several foliage age classes (current-year-old, one-year-old, and two-year-old needles) from twigs or small branches.
For each treatment, three repetitions of 10 fascicles were counted and weighted. Needle leaf area was measured by fresh needle samples by using scanned leaf meter (CI-202 area meter CID, Inc. USA). Specific leaf area of needle was determined by leaf area (cm
2) and dry mass (mg) of ratio (Bauer et al., 1997).
The needle leaf samples were oven-dried at 65 ℃ for 48 h and the dried samples were ground in a Wiley mill to pass a 40-mesh stainless steel sieve. Carbon and nitrogen concentrations from the ground materials were determined on an elemental analyzer (Thermo Scientific, Flash 2000, Italy).
All data were analyzed by three-way analysis of variance (ANOVA) to determine the significance of main effects [fertilizer type (F), sampling month (M), needle age (A)] and their interactions (F×M, M×A, F×A, F×M×A).
The model describing the data analysis is as follows:
Y
ijk= u + F
i+ M
j+ A
k+ (FM)
ij+ (FA)
ik+ (MA)
jk+ (FMA)
ijk+ e
ijkwhere u is the overall mean effect, F is fertilizer type
(k=1, 2, 3), M is sampling month (i=1, 2, 3), and A
is needle age (j=1, 2, 3). All ANOVA were executed
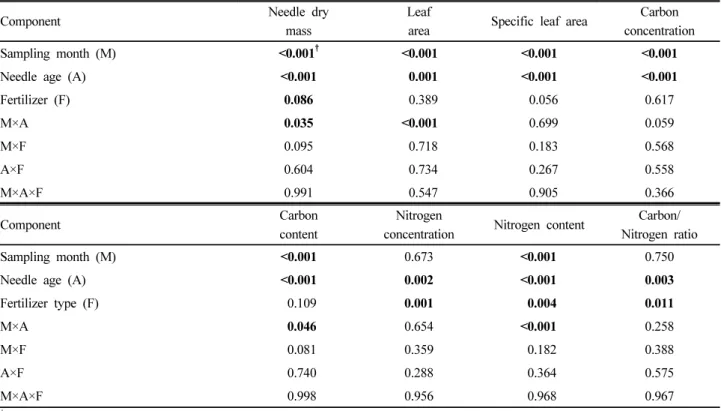
Table 3. P-value from results of ANOVA on sampling month, needle age and fertilizer type on growth and carbon and nitrogen responses of foliage in red pine stands.
Component Needle dry
mass
Leaf
area Specific leaf area Carbon
concentration
Sampling month (M) <0.001
†<0.001 <0.001 <0.001
Needle age (A) <0.001 0.001 <0.001 <0.001
Fertilizer (F) 0.086 0.389 0.056 0.617
M×A 0.035 <0.001 0.699 0.059
M×F 0.095 0.718 0.183 0.568
A×F 0.604 0.734 0.267 0.558
M×A×F 0.991 0.547 0.905 0.366
Component Carbon
content
Nitrogen
concentration Nitrogen content Carbon/
Nitrogen ratio
Sampling month (M) <0.001 0.673 <0.001 0.750
Needle age (A) <0.001 0.002 <0.001 0.003
Fertilizer type (F) 0.109 0.001 0.004 0.011
M×A 0.046 0.654 <0.001 0.258
M×F 0.081 0.359 0.182 0.388
A×F 0.740 0.288 0.364 0.575
M×A×F 0.998 0.956 0.968 0.967
†