Kor. J. Mater. Res.
Vol. 23, No. 9 (2013)
537
Point Defects and Photoluminescence of Green Phosphors Ca(1-1.5x)WO4: and Ca(1-2x)WO4:
Seon-Woog Cho†
Department of Materials Science and Engineering, Silla University, Busan 617-736, Korea (Received August 14, 2013 : Received in revised form September 10, 2013 : Accepted September 10, 2013)
Abstract Two types of Tb- and Na-substituted green phosphors Ca(1-1.5x)WO4: and Ca(1-2x)WO4: were synthesized with various x values, using a solid-state reaction. The former phosphors contained both substitutional and vacancy point defects, while the later had only substitutional defects. X-ray diffraction results showed that the main diffraction peak, (112), was centered at 2θ = 28.72o and indicated that there was no basic structural deformation caused by substitutions or vacancies. The photoluminescence emission and photoluminescence excitation spectra revealed the optical properties of trivalent terbium ions, Tb3+. Typical transitions, 5D3→7F6, 7F5, 7F4 and 5D4→7F6, 7F5, 7F4, 7F3, and cross relaxations were observed.
Subtle differences in the photoluminescence of green phosphors were observed as a result of the point defects. The FT-IR spectra indicated that some of the ungerade vibrational modes had shifted positions and changed shapes, spreading out over a wide range of frequencies. This change can be attributed to the different masses of Tb3+ and Na+ ions and VCa" vacancies compared to Ca2+ ions. The gerade normal modes of the Raman spectra exhibited subtle differences resulting from point defects in Ca(1-1.5x)TbxWO4 and Ca(1-2x)TbxNaxWO4.
Key words scheelite CaWO4, Ca(1-1.5x) WO4, Ca(1-2x) WO4, green phosphor, point defect.
1. Introduction
In a series of previous papers,1,2) we presented the phys- ical properties of red phosphors Ca(1-1.5x)WO4: and
Ca(1-2x)WO4: . We have seen some distinctions
of point defects, i.e. vacancies and substitutions, through pycnometric and spectroscopic studies. Here in this work we report the point defects and photoluminescence of green phosphors Ca(1-1.5x)WO4: and Ca(1-2x)WO4:
. Scheelite CaWO4 itself is a very efficient lumines- cent material at room temperature, and is used commer- cially as X-ray phosphor.3,4) Terbium can be substituted for Ca2+ in scheelite as trivalent Tb3+ ions. The substitution of trivalent Tb3+ for divalent Ca2+ requires a charge com- pensating mechanism to maintain electrical neutrality. If it enters as trivalent Tb3+, it enters scheelite by either the vacancy VCa" or alkaline(such as Na+) coupled substitution mechanism:
(1)
and
(2) in Kröger-Vink notation,5) respectively. Mechanism (1) pro- duces one vacancy VCa" for every substitution of two Tb3+ ions into three Ca2+ sites. However, in mechanism (2) one Tb3+ ion and one Na+ ion occupy two Ca2+ sites, individually. So both mechanisms (1) and (2) satisfy the charge balance as well as site balance, which should be fulfilled in defect chemistry.
One of the main purposes of this paper is to disclose point defects, such as vacancies or substitutions, in the green phosphors Ca(1-1.5x)WO4: and Ca(1-2x)WO4:
. Then we will see how the different nature of defects appears in the photoluminescence. Both (1) and (2) mech- anisms, being efficient charge compensations, create point defects, and result in as an enhanced luminescence.1,2,6) For mechanism (2), we selected sodium among candidate alkali metal elements because of its similarity with calcium in size as well as other chemical properties such
Tbx3+ Tbx3+,Nax+
Tbx3+ Tbx3+,Nax+
Tbx3+ Tbx3+Nax+
Eux3+
Eux3+,Nax+
Tbx3+ Tbx3+
Nax+
3CaCax = 2Tb Ca• +VCa″
2CaCax = Tb Ca• +NaCa′
Tbx3+ Tbx3+
Nax+
†Corresponding author
E-Mail : [email protected] (S. -W. Cho, Silla University)
©Materials Research Society of Korea, All rights reserved.
This is an Open-Access article distributed under the terms of the Creative Commons Attribution Non-Commercial License (http://creative- commons.org/licenses/by-nc/3.0) which permits unrestricted non-commercial use, distribution, and reproduction in any medium, provided the original work is properly cited.
as electronegativity. The similarity between Na+ and Ca2+
is understood as an example of diagonal relationships7) that exist in the periodic table.
2. Experimental
Using the solid-state reaction method we reported previ- ously in Ref. 2, Ca(1-1.5x)TbxWO4 and Ca(1-2x)TbxNaxWO4 were synthesized with various Tb3+ contents, x. The con- centrations of terbium were x = 0.005, 0.010, 0.015, 0.020, 0.025, and 0.030. All the starting chemicals were pur- chased from Sigma-Aldrich Korea. Heating and cooling rates were less than 4oC/min. In the mean time of heating, 3 hours setting at 350oC were provided to allow enough time for terbium(III,IV) oxide Tb4O7 to change into another form of terbium(III) oxide Tb2O3. Terbium (III,IV) oxide can thermally decompose to terbium (III) oxide according to the reaction of Tb4O7(dark brown)
→ 2Tb2O3(white) + (1/2)O2.8,9) Basic scheme of the syn- thesis is calcination of CaCO3 to intermediate CaO, then CaO and WO3 combine to form CaWO4. Following calcination, the highest temperature reached up to 1,100oC and stayed there for 4 hours for Ca(1-1.5x)TbxWO4. This temperature was lowered to 950oC for Ca(1-2x)TbxNaxWO4, because we found that they form partly fused clusters of powder on a high temperature. The chemical reactions are as follows:
(1−1.5x)CaCO3+ WO3+ (x/4)Tb4O7→
Ca(1-1.5x)TbxWO4+(1−1.5x)CO2+ (x/8)O2 (3) and
(1−2x)CaCO3+ WO3+ (x/4)Tb4O7+ (x/2)Na2CO3→ Ca(1-2x)TbxNaxWO4+(1−1.5x)CO2+ (x/8)O2 (4)
Crystal structure was determined by a X-ray diffrac- tometer, Philips PANalytical X'Pert PRO MPD. Optical properties were studied by photoluminescence excitation (PLE) and photoluminescence(PL) emission spectroscopy using a fluorescence spectrometer, Scinco FS-2. Also presented are the Fourier transform infrared(FT-IR) and Raman studies of the green phosphors(Vertex 80 V, Bruker).
3. Results and Discussion
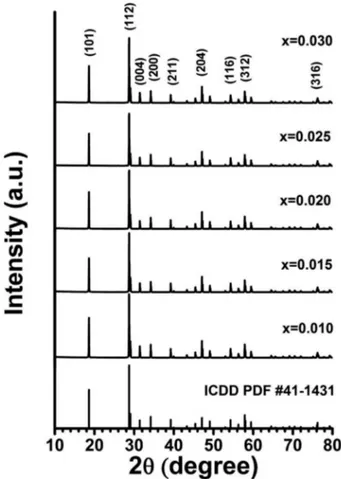
Fig. 1 shows the XRD spectra of Ca(1-1.5x)TbxWO4 cer- amic powders. The XRD spectra of the Ca(1-2x)TbxNaxWO4 samples were essentially the same as the Ca(1-1.5x)TbxWO4 results, so they are not presented here. The XRD patterns of the prepared phosphors correspond to the International Centre for Diffraction Data (ICDD) Powder Diffraction
File (PDF) 41-1431, without showing any significant dif- ference on the concentration x of Tb. Diffraction angles 2θ for the planes (101), (112), (004), (200), (211), (204), (116), (312), and (316) are 18.61o, 28.72o, 31.43o, 34.17o, 39.18o, 47.10o, 54.31o, 57.88o, and 76.22o, respectively. It belongs to the body-centered tetragonal system and space group I41/a.
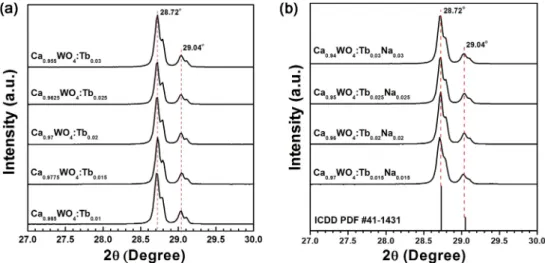
Figs. 2(a) and 2(b) present the expanded version of XRD spectra in the range of diffraction angle 2θ = 27o to 30o. The main peaks at 28.72o correspond to (112) planes, and the peaks at 29.04o represent (103) planes. The smaller shoulder peaks nearby those two peaks are probably traces of unreacted reactants or intermediates CaCO3, WO3, etc.
leftover in the products after synthesis. Not reacted excess CaCO3, CaO, or WO3 are readily diffused in CaWO4 in small amounts and permit growth despite the undesired nonstoichiometry in the semi-liquid melt stage.10) Calcium carbonate CaCO3 has its main (104) peak at 2θ = 29.072o (PDF 86-2343). We found little difference in the d-spacing values of the (112) planes due to the distinct ionic radii among Ca2+(112 pm), Tb3+(104 pm), and Na+(118 pm).11) If we follow Vegard's law,12) the lattice parameter of the solid solution is directly proportional to the atomic per- centage of solute present. However, the positions of main Fig. 1. XRD patterns of Ca(1-1.5x)WO4: samples with various x values, and the pattern of CaWO4, ICDD PDF 41-1431.
Tbx3+
peak at 2θ = 28.72o practically do not move at all even after the substitution with increased value of x. We are not surprised in the case of Na co-doped Ca(1-2x)TbxNaxWO4, because the sum of two calcium ions almost nicely matches with the sum of terbium and sodium ions in matter of size. On the other hand, we are phenomen- ologically led to a conclusion from the results of Ca(1-1.5x) TbxWO4, in which x Tb3+ ions replace (3/2)x Ca2+ ions creating (1/2)x VCa" vacancies. If the lattice does not shrink around a missing Ca2+ ion, we can estimate the size of vacancy VCa" that replaces the calcium site from the difference between the radii of Ca2+ and Tb3+ as follows: 3rCa2+= 2rTb3++rVCa. Using effective ionic radii from Shannon11) for eight-fold coordination we obtain the radius of vacancy: rVCa= 3rCa2+− 2rTb3+= 3(112 pm)− 2(104 pm) = 128 pm. This number suggests that in Ca(1-1.5x)Tbx WO4 the cation vacancies have its own rather roomy space with some size. Vegard's law is simply an ex- pression of the idea that the cell parameters are a direct consequence of the sizes of the component atoms in the
solid solution. The ideal form of Vegard's law is not obeyed here. Atomic interactions, which offset the size effects, are responsible for this deviation.13) It is tempting to assume that a lattice will shrink around a vacancy, but it must be kept in mind that the removal of a cation causes the nearest neighbor anions to experience increased electrostatic repulsion from one another, unshielded by the cation.14)
Figs. 3(a) and 3(b) show excitation spectra of Ca(1-1.5x) TbxWO4 and Ca(1-2x)TbxNaxWO4 phosphors. The PLE spectra of these systems (λem= 546 nm and 545 nm, re- spectively) consist of a broad band and some weak lines:
(1) The broad band 220-300 nm is attributed to O2−→ W6+
ligand to metal charge transfer (LMCT)15) and energy transfer from group to the Tb3+ ions16) showing maximum at 266 nm and 262 nm, respectively. These different positions of maxima may be resulted in by the small difference of hardness of lattice structure between a sparsely vacant type Ca(1-1.5x)TbxWO4 and a fully occupied type Ca(1-2x)TbxNaxWO4. (2) In addition to this broad and
WO42 –
Fig. 2. (a) Expanded version of XRD spectra of Ca(1-1.5x)WO4: with various x values of terbium ions Tb3+, from 2θ = 27o to 30o, (b) Expanded XRD spectra of Ca(1-2x)WO4: with various x values of Tb3+ and Na+ ions. Also marked is ICDD PDF 41-1431 pattern of CaWO4.
Tbx3+
Tbx3+,Nax+
Fig. 3. (a) Excitation spectra of the Ca(1-1.5x)WO4:Tbx3+ samples, (b) Excitation spectra of the Ca(1-2x)WO4:Tbx3+,Nax+ samples.
strong LMCT, the f-f transitions within the Tb3+ 4f8 con- figuration are observed with weak intensities at longer wavelengths. The small peak at 318 nm is ascribed to the transitions from the ground state 7F6 to a higher energy level 5D0.16,17) Regarding the ground state term symbol, for electron configurations with a more than half filled shell the multiplet with largest L+S = J (for example, in 4f8 7F terms, 3 + 3 = 6) is the lowest state, following Hund's third rule.18) Even though the concentration quenching appears to start at around x = 0.025 for both formulae, we found from Figs. 3(a) and 3(b) some delicate discrepancy between Ca(1-1.5x)TbxWO4 and Ca(1-2x)TbxNaxWO4 in optical excitation, with small difference of maximum positions.
In PL emission, Figs. 4(a) and 4(b), we found some differences between Ca(1-1.5x)TbxWO4 and Ca(1-2x)TbxNaxWO4
regarding their photoluminescence characteristics. Both show typical transitions 5D3→7F6, 7F5, 7F4 and 5D4→7F6,
7F5, 7F4, 7F3 of Tb3+, having peaks at 382, 414, 437 nm for the former set and 489, 546(545), 588, 622 nm for the latter set, respectively. Emission from 5D4 to 7FJ(J = 6, 5, 4, 3, 2, 1, 0) are stronger than those from 5D3 to 7FJ. This may attributed to the cross-relaxation of Tb3+ ions:3,17,19,20)
Tb3+(5D3) + Tb3+(7F6)→ Tb3+(5D4) + Tb3+(7F0) (5) Electrons in 5D3 relax to 5D4, then electrons in 7F6 of neighboring Tb3+ are excited to 7F0. The cross-relaxation between two adjacent Tb3+ ions weakens the 5D3→7FJ
transitions and enhances the 5D4→7FJ transitions at the same time. In the range of wavelength 483 nm <λ < 650 nm, the concentration quenching occurs to start at around x = 0.025 for both formulae. However, in 320 nm < λ <
483 nm, the x values for concentration quenching are different. It starts at x = 0.01 for Ca(1-1.5x) TbxWO4, but it appears at a later stage of x = 0.02 for Ca(1-2x)TbxNaxWO4. We understand that cross-relaxation and concentration quenching are both examples of energy transfer of identical luminescent centers3) (between Tb3+ and another nearby Tb3+ in this case). It seems that energy migration in a va- cancy included Ca(1-1.5x)TbxWO4 starts at slightly earlier stage of concentration x than in a fully occupied Ca(1-2x)
TbxNaxWO4, which has only substitutional point defects.
Also we see an overlapped broad band envelope covering 340-540 nm, a remnant emission of host CaWO4.1,19,20)
Fig. 5 presents the FT-IR spectra of CaWO4, Ca(1-1.5x) TbxWO4, and Ca(1-2x)TbxNaxWO4. And Fig. 6 shows the Fig. 4. (a) PL emission spectra of Ca(1-1.5x)WO4:Tbx3+ phosphors, (b) PL emission spectra of Ca(1-2x)WO4:Tbx3+,Nax+ phosphors.
Fig. 5. FT-IR spectra of CaWO4, Ca0.9625Tb0.025WO4, and Ca0.95 Tb0.025Na0.025WO4.
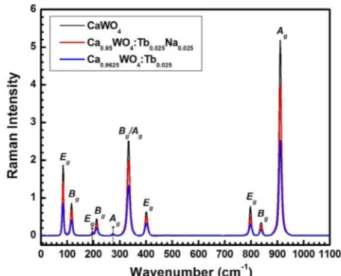
Fig. 6. Raman spectra of CaWO4, Ca0.9625Tb0.025WO4, and Ca0.95 Tb0.025Na0.025WO4.
Raman spectra of CaWO4, Ca(1-1.5x)TbxWO4, and Ca(1-2x) TbxNaxWO4. Here we present only x = 0.025 cases, because this is the concentration showing the highest luminous intensity. The CaWO4 crystals have twenty-six distinct vibrational modes.2,21) Among these, eight vibra- tional modes are IR active ΓIR= 4Au+ 4Eu, and thirteen modes are expected to be Raman active ΓRaman= 3Ag+ 5Bg+ 5Eg. Here the subscripts u (ungerade) and g (gerade) indicate the parity under inversion in centrosymmetric crystals CaWO4.
In the host material calcium tungstate (Ca2+ ), the Ca2+ ions are eight-fold coordinated to oxide ions from eight separate tetrahedra. It can, therefore, be re- garded as being composed of clusters of [CaO8] and [WO4]. Calcium and tungsten atoms do not bond directly, so the bonding sequence is -Ca-O-W-O- throughout the whole crystal. IR results in Fig. 5 reveal that ungerade vibrations are very different after the replacement of Ca2+. The positions of Eu+ Au, Eu, and Au modes in CaWO4
are 439, 754, and 822 cm−1, respectively.2) The Eu and Au vibrations of 754 and 822 cm−1 drastically change following the substitution. Both peaks become swollen bands spreading over wide range of frequencies. These defor- mations seem more severe in the blue curve (Ca(1-1.5x)Tbx WO4) than the red (Ca(1-2x)TbxNaxWO4). We suggest, based on the data presented in Fig. 5, that the bonding sequences -Tb-O-W-O-, -Na-O-W-O-, and -VCa-O-W-O- created by the substitution of Ca2+ with Tb3+, etc. disrupt the bonding sequence of the host crystal CaWO4 and appear as anti- symmetric ungerade vibrations in Ca(1-1.5x)TbxWO4 and Ca(1-2x)TbxNaxWO4. This local distortion is more sensitive in Ca(1-1.5x)TbxWO4, in which both vacancies and sub- stitutional point defects co-exist, than in Ca(1-2x)TbxNax WO4, in which only substitutional point defects fully occupy all the site with different masses.
The Raman spectra presented in Fig. 6 show that the frequencies of all the gerade modes are unchanged upon replacement of Ca2+ with Tb3+, Na+, or VCa", but showing somewhat lower intensities. The positions and shapes of the Raman peaks are very similar those observed by Gracia, et al.22) and Cavalcante, et al.23) obtained from dif- ferently synthesized CaWO4 crystals. Here we note, again, that the blue curve (Ca(1-1.5x)TbxWO4) shows less intense peaks than the red (Ca(1-2x)TbxNaxWO4), although the peaks of both appear at identical positions and have similar shapes. This observation leads us to conclude that, for gerade vibrations, different types of points defects produce different Raman intensities.
4. Conclusion
Using a solid-state reaction, two kinds of green ceramic phosphors Ca(1-1.5x)TbxWO4 and Ca(1-2x)TbxNaxWO4 were
synthesized with various concentrations of Tb3+ ions. XRD results showed that there was no structural shrinkage due to the Tb3+ or Na+ ions, or the vacancies VCa". Point defects, especially vacancies, were detected successfully through XRD and spectroscopic measurements.
We estimated the size of the vacancies in the Ca(1-1.5x) TbxWO4 samples to be rVCa= 128 pm. PL emission spectra showed typical transitions 5D3→7F6,7F5,7F4 and 5D4→
7F6, 7F5, 7F4, 7F3 of trivalent Tb3+ ions with cross relax- ations. We found that the nature of point defects is deli- cately related to photoluminescence and the energy transfer mechanisms of these green phosphors. FT-IR spectra showed that, due to the different masses of Tb3+ and Na+ ions, and VCa" vacancies compared to Ca2+, some of the ungerade normal modes had shifted positions and different shapes. The [TbO8], [NaO8], and [VCaO8] clusters created within after the substitution of Ca2+ with Tb3+, Na+, and VCa" resulted in symmetry breaking of the host crystal CaWO4, which appeared as antisymmetric ungerade vibra- tions in both Ca(1-1.5x)TbxWO4 and Ca(1-2x)TbxNaxWO4 samples. Raman spectra revealed that, without showing any difference before and after the doping of activators to the host material CaWO4, all the gerade normal modes occur at identical frequencies with the same shapes and diminished peak intensities after substitution. Intensity weakening was more apparent in the Ca(1-1.5x)TbxWO4
samples, which contained (1/2)x vacancies, than in the Ca(1-2x)TbxNaxWO4 samples, which had no vacancies.
Acknowledgements
The XRD and FT-IR/Raman spectra were obtained using the facilities of Korea Basic Science Institute (KBSI). The author is grateful to Professor Shinho Cho (Silla Univer- sity) for his suggestion at an early stage of this study. He also thanks his student Jun Lee for producing neat and clear figures for this paper.
References
1. S. Cho and S. -W. Cho, Kor. J. Mater. Res., 22, 215 (2012) (in Korean).
2. S. -W. Cho, Bull. Korean Chem. Soc., 34(9), 2769 (2013).
3. G. Blasse and B. C. Grabmaier, Luminescent Materials, Springer-Verlag, Berlin, Germany, (1994).
4. T. E. Warner, Synthesis, Properties and Mineralogy of Important Inorganic Materials, p. 228-239, John Wiley and Sons, U. K., (2011).
5. N. G. Connelly, T. Damhus, R. M. Hartshorn and A. T.
Hutton, Nomenclature of Inorganic Chemistry, IUPAC Recommendations 2005, p. 238-241, RSC Publishing, Cambridge, U. K., (2005).
6. S. Shi, J. Gao and J. Zhou, Optical Materials, 30, 1616 (2008).
WO42 – WO42 –
7. P. Atkins, T. Overton, J. Rourke, M. Weller and F.
Armstrong, Inorganic Chemistry, 4th ed., p.259, Oxford University Press, Oxford, U. K., (2006).
8. Z. C. Kang and L. Eyring, J. Alloy. Compd., 249, 206 (1997).
9. G. Qiu, D. Wang, X. Jin and G. Z. Chen, Electrochemica Acta, 51, 5785 (2006).
10. K. Nassau and G. M. Loiacono, J. Phys. Chem. Solds, 24, 1503 (1963).
11. R. D. Shannon, Acta Cryst., A32, 751 (1976).
12. B. D. Cullity and S. R. Stock, Elements of X-Ray Diffraction, 3rd ed., p.339, Prentice Hall, U. S. A., (2001).
13. R. J. D. Tilley, Defects in Solids, p. 13-14, John Wiley &
Sons, U. S. A., (2008).
14. Y. -M. Chiang, D. Birnie, III and W. D. Kingery, Physical Ceramics p.131, John Wiley & Sons, U. S. A., (1997).
15. C. A. Kodaira, H. F. Brito and M. C. F. C. Felinto, Journal of Solid State Chemistry, 171, 401 (2003).
16. J. Liao, B. Qiu, H. Wen and W. You, Optical Materials,
31, 1513 (2009).
17. H. Wu, Y. Hu, F. Kang, L. Chen, X. Wang, G. Ju and Z.
Mu, Materials Research Bulletin, 46, 2489 (2011).
18. B. Di Bartolo, Optical Interactions in Solids, 2nd ed., p.188, World Scientific, Singapore, (2010).
19. E. Cavalli, P. Boutinaud, R. Mahiou, M. Bettinelli and P.
Dorenbos, Inorg. Chem., 49, 4916 (2010).
20. Y. Tian, B. Chen, H. Yu, R. Hua, X. Li, J. Sun, L. Cheng, H. Zhong, J. Zhang, Y. Zheng, T. Yu and L. Huang, Journal of Colloid and Interface Science, 360, 586 (2011).
21. D. L. Rousseau, R. P. Bauman and S. P. S. Porto, J.
Raman Spectrosc., 10, 253 (1981).
22. L. Gracia, V. M. Longo, L. S. Cavalcante, A. Beltran, W.
Avansi, M. S. Li, V. R. Mastelaro, J. A. Varela, E. Longo and J. Andrs, J. Appl. Phys., 110, 043501 (2011).
23. L. S. Cavalcante, V. M. Longo, J. C. Sczancoski, M. A.
Almeida, J. A. Batista, J. A. Varela, M. O. Orlandi, E.
Longo and M. S. Li, CrystEngComm, 14, 853 (2012).