Kor J Fish Aquat Sci 46(6),957-965,2013
한수지 46(6), 957-965, 2013Original Article
957
서 론고등어
(Scomber japonicus)
는멸치,
오징어,
갈치와함께국 내연근해어업생산량에서차지하는비율이가장높은종일뿐 아니라대중성이커서경제적가치또한높은어종이다.
국내고등어의연간어획량은
1970
년대부터1980
년대중반까지10
만톤내외였으나이이후부터증가추세를보여
1996
년에는약42
만톤까지어획되었다.
하지만1997
년부터15
만톤수준으 로다시감소추세에있어2000
년부터는TAC (Total Allowable
Catch)
대상어종으로지정되어고등어의자원회복에대한관심이높아져있는상황이다
.
제주도와대마도주변해역은고등어의산란장이며
,
산란기간 은3-6
월,
주산란기는4-5
월이다(Cha et al., 2002).
산란을마친고등어는
7-11
월동안서해와동해에서섭이활동을하다가12
월부터다음해2
월까지월동을위해제주도를포함한남해로회유한다
(Choi et al., 2003).
고등어는부화후1
년이면성숙체 장28.6 cm (NFRDI, 2010)
에이를정도로초기성장률이매우빠르므로환경변화에취약한초기생활사시기의생존율은다 음해고등어가입에직접적으로영향을줄수있다
. Kim et al.
(1999)
의연구에따르면,
먹이생물인동물플랑크톤의현존량은1-2
년이후의고등어가입과양의상관관계가있는것으로나타 났다.
지금까지국내고등어초기생활사연구는난발생과자치 어의형태발달(Kim et al., 2008; Park et al., 2008)
과난발생과 자어에미치는수온및염분의영향(Hwang et al., 2008)
등이 있다.
따라서고등어생활사와생태학적특징을바탕으로한가 입량예측을통해효과적으로자원을관리하기위하여초기생 활사연구가절실히요구된다.
알의수직분포에대한정보는알의산란장에서의분포
,
보육 장으로의운송,
초기생존율등과같은생태학적특징을이해하 는데중요하게쓰인다.
이러한수직분포를결정짓는생물학적 요인중의하나가알비중(Sundby, 1991)
이며,
여러연구에서 알비중과관련된산란전략이나타난다.
예를들면,
벵겔라북 부용승지역에출현하는케이프민대구(Merluccius capensis)
는산란수심,
알비중,
중규모의와류가서로상호작용을하여Article history;
Received 18 October 2013; Revised 27 November 2013; Accepted 28 November 2013
*Corresponding author: Tel: +82. 51. 720. 2287 Fax: +82. 51 .720. 2337 E-mail address: [email protected]
Kor J Fish Aquat Sci 46(6) 957-965, December 2013 http://dx.doi.org/10.5657/KFAS.2013.0957 pISSN:0374-8111, eISSN:2287-8815
ⓒ The Korean Society of Fishereis and Aquatic Science. All rights reserved
한국 연근해 고등어(Scomber japonicus) 알의 비중과 수직분포
정경미·강수경
*·차형기
1·최광호·Mari S. Myksvoll
2국립수산과학원 자원관리과, 1국립수산과학원 아열대수산연구센터, 2노르웨이 해양연구소
Buoyancy and Vertical Distribution of Mackerel Scomber japonicus Eggs in Korean Waters
Kyung-Mi Jung, Sukyung Kang
*
, Hyung Kee Cha1
, Kwang Ho Choi and Mari S. Myksvoll2
Fisheries Resources Management Division, National Fisheries Research & Development Institute, Busan 619-705, Korea
1
Subtrophic Fisheries Research Center, National Fisheries Research & Development Institute, Jeju 690-192, Korea
2
Oceanography, Institute of Marine Research, Bergen N-5817, Norway
This study simulated the egg vertical distribution of mackerel Scomber japonicus in Korean waters using general numerical mod- els. All eggs were spawned naturally by raising broodfishes (May-June 2013), and the egg specific gravity was measured by a density-gradient column. CTD surveys provided environmental data (e.g., temperature and salinity) in May near Jeju Island, Korea.
The egg specific gravity during the early stages ranged from 1.0203-1.0211. In general, the fertilized eggs showed a gradual decline in egg specific gravity until full development of the main organs, with a sudden increase just before hatching. Modeled egg vertical distributions were influenced more by wind speed than by egg buoyancy and vertical structure of the sea water. During calm and normal wind speeds, the eggs were distributed from the surface to 25-m depths. Under strong wind conditions (three times higher than the normal speed), the egg concentration on the surface decreased, and the egg distributional depth was deeper (~50 m).
Key words: Mackerel, Egg specific gravity, Vertical distribution, Wind speed, Scomber japonicus
민대구알이외해로손실되지않고연안으로수송되어먹이생 물이풍부한곳에서부화하도록 적응되어져있다
(Sundby et al., 2001).
발트해대구(Gadus morhua)
알은인접해역의대서 양대구알보다크기가크고비중이낮으므로발트해표층의저 염분과저층의저산소를피하여대구알이중층의염분약층부 근에뜰수있도록하여알의생존율을높인다(Nissling, 2004).
최근에는개체기반모델
(Individual-based model; IBM)
의발 달로초기생활사의운송(transport)
과정체(retention),
가입기 작등(Parada et al., 2003; Myksvoll et al., 2011, 2013; Ospina- Álvarez et al., 2012)
을연구하기위해알비중을포함한생물학 적정보에대한관심이증대되어져있다.
본연구에서는실험을통해얻은고등어알의비중을모델에 반영시켜물리적환경변화에따른알의수직적분포특성을이 해함으로써고등어의자원회복과관련된초기생활사
,
가입기 작,
자원량추정등을밝히는연구에기여하고자한다.
재료 및 방법
고등어 알 채집
본실험은국립수산과학원미래양식연구센터에서
2013
년5
월(22
일-26
일)
에2
회(S1, S2)
와6
월(10
일-14
일)
에5
회(S3-S7)
에걸쳐수행되었다(Table 1).
자연산란된고등어알을얻기 위해약300
개체의고등어를한개의실내수조로옮겨사육하 였다.
실험기간동안사육조수온은17.5-20.1℃,
염분은33.0- 34.8 psu
범위로변동하였다.
모든개체는성숙체장인28.6 cm
이상이었다.
자정무렵에산란된고등어알은새벽6
시경수조 의배수관에연결된채집망을통해수거되었다.
알은즉시실험 실로옮겨져실체현미경(Zeiss stemi DV4)
을이용하여발생단 계와난질의상태가파악되었다.
알의발생단계는수정이후경 과시간(hours after fertilization, haf)
으로표시되었고,
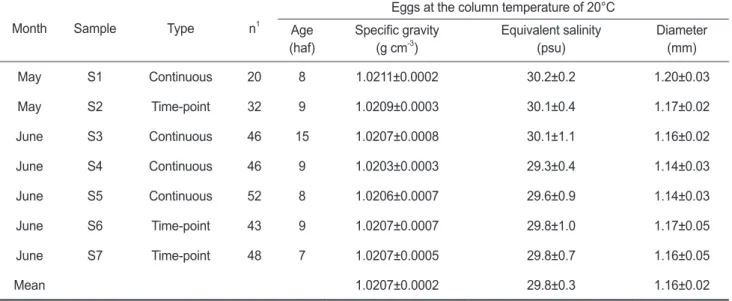
난경은 gravity was also expressed as equivalent salinity units of egg neutral buoyancy. Age means egg stages shown as hours after fertilization (haf). Values are mean±one standard deviationMonth Sample Type n1
Eggs at the column temperature of 20°C
Age Specific gravity Equivalent salinity Diameter
(haf) (g cm-3) (psu) (mm)
May S1 Continuous 20 8 1.0211±0.0002 30.2±0.2 1.20±0.03
May S2 Time-point 32 9 1.0209±0.0003 30.1±0.4 1.17±0.02
June S3 Continuous 46 15 1.0207±0.0008 30.1±1.1 1.16±0.02
June S4 Continuous 46 9 1.0203±0.0003 29.3±0.4 1.14±0.03
June S5 Continuous 52 8 1.0206±0.0007 29.6±0.9 1.14±0.03
June S6 Time-point 43 9 1.0207±0.0007 29.8±1.0 1.17±0.05
June S7 Time-point 48 7 1.0207±0.0005 29.8±0.7 1.16±0.05
Mean 1.0207±0.0002 29.8±0.3 1.16±0.02
1n, number of eggs used in each measurement.
Table 2. Changes in egg specific gravity during development of S1, S4 and S5 continuous measurements. Initial, Min and Hatch indicate the mean egg specific gravity at the time of initial stage of experiments, minimum specific gravity, hatching, respectively
Sample Initial Min Hatch The amount of changes in egg specific gravity
Decrease (Initial-Min) Increase (Hatch-Min)
S1 1.0211 1.0202 1.0212 0.0009 0.0010
S4 1.0203 1.0188 1.0203 0.0015 0.0015
S5 1.0206 1.0191 1.0216 0.0014 0.0025
고등어 알의 비중과 수직분포
959
만능투영기
(Nikon profile projector V-10)
를이용하여0.001 mm
까지측정되었다.
고등어 알 비중측정
고등어 알의 비중실험은 연속측정법
(continuous measure- ments; S1, S3-S5)
과 순간측정법(time-point measurements;
S2, S6-S7)
의두가지방법으로수행되었다.
연속측정법은수정후약
8
시간(
포배기, 8 haf)
부터부화할때까지알의비중변화 를2
시간간격으로연속적으로관찰하는방법이며,
순간측정법 은특정발생단계에서만비중을관찰하는방법이다.
초기발생 단계는7-9 haf
로일치시켰으나, S3
의경우는15 haf
로하였다.
실험은비중측정기
(density-gradient column)
를이용하였고,
모든실험기기의설치,
사용,
보정은Coombs (1981)
의논문을 참고하였다.
여과해수(~34 psu)
와천일염을이용하여저염분(~20 psu)
과고염분(~48 psu)
의용액을만든후,
기기를작동시켜
80 cm
높이의유리관을조밀한염분층으로만들었다.
유리관의위쪽은가장염분이낮은약
20 psu
였고아래쪽으로내려가면서점차적으로높아져유리관바닥은약
43 psu
였다.
유리 관의수온은냉각기를이용하여20℃
로유지하였다.
비중을알 고있는유리구슬5
개를유리관에투입하여1
시간이후에유리 구슬의위치를읽었다.
처음유리구슬의비중이결정될때의수 온은23℃
로유리관수온인20℃
와차이가있어유리구슬의비 중은열팽창이론에근거하여보정되었다.
즉(
유리구슬의밀도)
+(
수온차이)×(
유리구슬의밀도)×0.000028.
비중이서로다른유리구슬은유리관안에서고유의비중위치에서정지하였 고유리관높이
(
독립변수)
와유리구슬비중(
종속변수)
간의회 귀분석을통하여관계식이만들어졌다:
비중=a×
높이+b.
피펫을이용하여약
20-50
개의알을유리관에투입한후1
시간이후에알의위치를읽었다
.
알의비중은위에서구한회귀분석식에 알의정지한높이를대입하여계산되었다.
해양환경자료
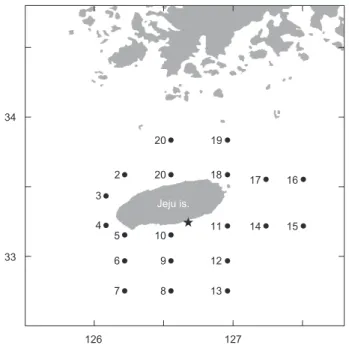
국립수산과학원아열대수산연구센터는
2013
년봄에제주도 인접해역20
개정점에서총2
회의CTD
조사를수행하였다. 1
차조사는5
월1
일부터4
일까지, 2
차조사는약한달뒤인5
월29
일부터6
월1
일까지동일한정점에서해수의수온,
염분,
밀 도를관측하였다(Fig. 1).
바람의세기는기상청해양기상월보 에기록된2013
년4-6
월동안지귀도(
위도33° 13´,
경도126°
39´)
의일일평균풍속을이용하였다(KMA, 2013).
알의 수직분포
고등어알의수직분포는대표정점
3
곳(
중국대륙연안수의영 향을받는정점3,
대마난류수의영향을받는정점15,
제주연안 수의영향을받는정점17)
에서Sundby (1983)
의안정상태분 포이론를바탕으로개발된수치모델(Ådlandsvik, 2000)
을이 용하여예측하였다.
모델에이용된정보는본실험을통해서얻은알의비중과크기
, CTD
조사에서관측된수온과염분,
기상청에서기록한지귀도의일일평균바람의세기였다
. 통계분석
연구결과의통계적유의성검정은
R version 2.10.0 (2010)
을 이용하여Student´s t-test
와공분산분석[Analysis of covari- ance (ANCOVA)]
을실시하여 유의수준5%
이내(P<0.05)
로 분석하였다.
y = 6.886x + 170.3 R2 = 0.888
34
20
Jeju is.
19 20
2 3
4 10
9 8
12 11 18
14 15
17 16
13 5
6 7 33
80 60 40 20
1.023 1.022 1.021 1.020 1.019
34
33
1 4 7 10 13 16 19 22 25 28 31 34 37 40 43 46 49 1.018
Temperature (˚C)
Early May (1m) Temperature (˚C) Late May (1m)
1.0188 1.0193 1.0198 1.0203 1.0208 1.0213 1.0218 1.0223 1.0228 0
126 127
May
Egg specific gravity
Mean egg specific gravity
Temperature ( ˚C) Salinity ( psu ) Density ( sigma-t ) Depth (m) Depth (m) Depth (m)
Station
(a) Temperature (˚C)
(b) Salinity (psu)
(c) Density (sigma-t)
(a) Station 3
(b) Station 17
(c) Station 15
Egg concentration (number m
-3)
Depth (m)
Station Hours after fertilization
June
34
33
Salinity (psu)
Early May (1m) Salinity (psu) Late May (1m)
34
126
21 19 17 15 13
1 m 25 m 50 m
Early May Late May
Early May Late May
Early May Late May
127 126 127
33
Density (sigma-t)
Early May (1m) Density (sigma-t) Late May (1m)
36 35 34 33 32 27
1 2 3 4 5 6 7 8 9 10
0 13
20 40 60 80 100
15
St.3
St.17
St.15
Early May
17 19 21
11 12 13 14 15 16 17 18 19 20 1 2 3 4 5 6 7 8 9 10 11 12 13 14 15 16 17 18 19 20 26
25 24 23
13 15
Late May
17 19 21
Depth (m)
0 32
20 40 60 80 100
33
Early May
34 35 32 33 34 35
Late May
Depth (m)
0 20
20 40 60 80 100
14 12 10 8 6 4 2
0
25
W = 1.4 m/s Early May Late May
W = 4.4 m/s W = 11.5 m/s
50
1 6 11 16
April 21 26 1 6 11 16
Date May 21 26 31 5 10 June 15 20 25 30
0
21 22
Early May
24
23 25 26 20 21 22 23 24 25 26
Late May
0
25
W = 1.4 m/s W = 4.4 m/s W = 11.5 m/s
50
0
25
W = 1.4 m/s W = 4.4 m/s W = 11.5 m/s
50 0 60 120 180 0 60 120 180 0 60 120 180
Fig. 1. Map showing 20 CTD stations (filled dot) and Jigwido (filled star) around Jeju Island, Korea.
Fig. 2. Percent frequency of egg specific gravity at early develop- mental stages from May (S1-S2) and June (S3-S7) measurements.
정경미
ㆍ
강수경ㆍ
차형기ㆍ
최광호ㆍ
Mari S. Myksvoll960
결 과
고등어 알의 비중변화
초기발생단계에서알의특성을채집시기별로비교하였을때
(Table 1),
월별평균비중은5
월에1.0210, 6
월에1.0206
이었 으며, 5
월의평균비중이다소높았다(t-test, P <0.001).
알의평 균직경은5
월에1.19 mm, 6
월에1.15 mm
로나타나면서5
월에0.04 mm
큰알이채집된것을알수있었다(t-test, P <0.001). 5
월과6
월의전체조사기간동안채집된고등어알의평균비중 이1.0207,
표준편차가0.0002
인정규분포곡선을따르는것으 로나타났다(Fig. 2).
발생과정동안일어나는알의비중변화를관찰하기위하여수 정후약
8
시간(
포배기)
부터부화(
수정후48-50
시간)
까지2
시 간간격으로비중을연속측정하였다.
모든연속측정에서비중 은일정한패턴으로변하였다(Fig. 3).
수정후8
시간부터비중 은꾸준히감소하다가약38
시간(
배체의기관이대부분형성 됨)
이되면최소로낮아졌으며,
부화직전에비중은갑작스럽게 증가하였다.
비중의변화량을비교하면, S1
은8
시간부터38
시 간까지0.0009
의감소량을보였고S4
는9
시간부터39
시간까지0.0015, S5
는8
시간부터38
시간까지0.0014
로S1
보다약1.6
배 감소량이많았다.
최소값에서부화까지의비중증가량은S1
이0.0010, S4
는0.0015, S5
는0.0025
였으며,
부화단계에서는모 두첫포배기에서의비중값을회복하거나높아지는것을관찰 할수있었다(Table 2).
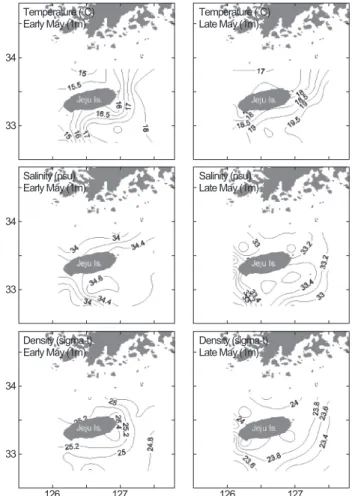
제주도 주변해역의 물리적 환경특성
제주도인근물리환경의수평분포를살펴보면
, 5
월초1
차조사에서표층수
(1 m)
의수온은14.4-18.4°C,
염분은33.7-34.8 psu,
밀도(sigma-t)
는24.6-25.5
의범위로분포하였다(Fig. 4).
5
월말에실시한2
차조사에서는수온은상승하여16.9-20.0°C
의범위였고,
염분과밀도는모두낮아져서각각32.6-33.7 psu, 23.3-24.4
였다(Fig. 4). 1, 2
차조사에서동일하게남쪽과동쪽 해역은대마난류수의영향으로북쪽과서쪽해역에비해상대적 으로고온,
고염한특성을보였다.
각정점에서대표수심
1 m, 25 m, 50 m
를선택해서수온,
염 분,
밀도의수직적분포양상을알아보았다(Fig. 5).
대체적으로 수온,
염분,
밀도의수심별차이는5
월초보다5
월말에크게나 타났다.
특히5
월말남쪽과동쪽해역에위치한정점에서1 m
에서
50 m
범위내수온과밀도의변동폭이컸다.
고등어 알의 수직분포
5
월초해수의수온,
염분,
밀도는수층간변동폭이크지않았지만
5
월말에는표층의수온이상승하면서약층이형성되었다(Fig. 6). 5
월말수온약층은정점3
과정점15
에서수심15 m
Fig. 3. Ontogenetic changes in egg specific gravity from 8-9 hafuntil hatching represented by the continuous measurements of S1 (□), S4 (△), and S5 (●). The continuous measurement of S3 is not shown because the initial stage of the experiment was 15 haf.
Bars refer to the 95% confidence interval for the mean egg specific gravity.
Fig. 4. Horizontal distributions of temperature (°C), salinity (psu) and density (sigma-t) at the 1 m depth in early May (May 1-4) and late May (May 29- June 1).
y = 6.886x + 170.3 R2 = 0.888
34
20
Jeju is.
19 20
2 3
4 10
9 8
12 11 18
14 15
17 16
13 5
6 7 33
80 60 40 20
1.023 1.022 1.021 1.020 1.019
34
33
1 4 7 10 13 16 19 22 25 28 31 34 37 40 43 46 49 1.018
Temperature (˚C)
Early May (1m) Temperature (˚C) Late May (1m)
1.0188 1.0193 1.0198 1.0203 1.0208 1.0213 1.0218 1.0223 1.0228 0
126 127
May
Egg specific gravity
Mean egg specific gravity
Temperature ( ˚C) Salinity ( psu ) Density ( sigma-t ) Depth (m) Depth (m) Depth (m)
Station
(a) Temperature (˚C)
(b) Salinity (psu)
(c) Density (sigma-t)
(a) Station 3
(b) Station 17
(c) Station 15
Egg concentration (number m
-3)
Depth (m)
Station Hours after fertilization
June
34
33
Salinity (psu)
Early May (1m) Salinity (psu) Late May (1m)
34
126
21 19 17 15 13
1 m 25 m 50 m
Early May Late May
Early May Late May
Early May Late May
127 126 127
33
Density (sigma-t)
Early May (1m) Density (sigma-t) Late May (1m)
36 35 34 33 32 27
1 2 3 4 5 6 7 8 9 10
0 13
20 40 60 80 100
15
St.3
St.17
St.15
Early May
17 19 21
11 12 13 14 15 16 17 18 19 20 1 2 3 4 5 6 7 8 9 10 11 12 13 14 15 16 17 18 19 20 26
25 24 23
13 15
Late May
17 19 21
Depth (m)
0 32
20 40 60 80 100
33
Early May
34 35 32 33 34 35
Late May
Depth (m)
0 20
20 40 60 80 100
14 12 10 8 6 4 2
0
25
W = 1.4 m/s Early May Late May
W = 4.4 m/s W = 11.5 m/s
50
1 6 11 16
April 21 26 1 6 11 16
Date May 21 26 31 5 10 June 15 20 25 30
0
21 22
Early May
24
23 25 26 20 21 22 23 24 25 26
Late May
0
25
W = 1.4 m/s W = 4.4 m/s W = 11.5 m/s
50
0
25
W = 1.4 m/s W = 4.4 m/s W = 11.5 m/s
50 0 60 120 180 0 60 120 180 0 60 120 180
Jeju is.
20 2 3
4 10
9 8
12 11 18
14 15
17 16
13 5
6 7 33
80 60 40 20
1.023 1.022 1.021 1.020 1.019
34
33
1 4 7 10 13 16 19 22 25 28 31 34 37 40 43 46 49 1.018
Temperature (˚C)
Early May (1m) Temperature (˚C) Late May (1m)
1.0188 1.0193 1.0198 1.0203 1.0208 1.0213 1.0218 1.0223 1.0228 0
126 127
May
Egg specific gravity
Mean egg specific gravity
Temperature ( ˚C) Salinity ( psu ) Density ( sigma-t ) Depth (m) Depth (m) Depth (m)
Station
(a) Temperature (˚C)
(b) Salinity (psu)
(c) Density (sigma-t)
(a) Station 3
(b) Station 17
(c) Station 15
Egg concentration (number m
-3)
Depth (m)
Station Hours after fertilization
June
34
33
Salinity (psu)
Early May (1m) Salinity (psu) Late May (1m)
34
126
21 19 17 15 13
1 m 25 m 50 m
Early May Late May
Early May Late May
Early May Late May
127 126 127
33
Density (sigma-t)
Early May (1m) Density (sigma-t) Late May (1m)
36 35 34 33 32 27
1 2 3 4 5 6 7 8 9 10
0 13
20 40 60 80 100
15
St.3
St.17
St.15
Early May
17 19 21
11 12 13 14 15 16 17 18 19 20 1 2 3 4 5 6 7 8 9 10 11 12 13 14 15 16 17 18 19 20 26
25 24 23
13 15
Late May
17 19 21
Depth (m)
0 32
20 40 60 80 100
33
Early May
34 35 32 33 34 35
Late May
Depth (m)
0 20
20 40 60 80 100
14 12 10 8 6 4 2
0
25
W = 1.4 m/s Early May Late May
W = 4.4 m/s W = 11.5 m/s
50
1 6 11 16
April 21 26 1 6 11 16
Date May 21 26 31 5 10 June 15 20 25 30
0
21 22
Early May
24
23 25 26 20 21 22 23 24 25 26
Late May
0
25
W = 1.4 m/s W = 4.4 m/s W = 11.5 m/s
50
0
25
W = 1.4 m/s W = 4.4 m/s W = 11.5 m/s
50 0 60 120 180 0 60 120 180 0 60 120 180
고등어 알의 비중과 수직분포
961
y = 6.886x + 170.3 R2 = 0.888
34
20
Jeju is.
19 20
2 3
4 10
9 8
12 11 18
14 15
17 16
13 5
6 7 33
80 60 40 20
1.023 1.022 1.021 1.020 1.019
34
33
1 4 7 10 13 16 19 22 25 28 31 34 37 40 43 46 49 1.018
Temperature (˚C)
Early May (1m) Temperature (˚C) Late May (1m)
1.0188 1.0193 1.0198 1.0203 1.0208 1.0213 1.0218 1.0223 1.0228 0
126 127
May
Egg specific gravity
Mean egg specific gravity
Temperature ( ˚C) Salinity ( psu ) Density ( sigma-t ) Depth (m) Depth (m) Depth (m)
Station
(a) Temperature (˚C)
(b) Salinity (psu)
(c) Density (sigma-t)
(a) Station 3
(b) Station 17
(c) Station 15
Egg concentration (number m
-3)
Depth (m)
Station Hours after fertilization
June
34
33
Salinity (psu)
Early May (1m) Salinity (psu) Late May (1m)
34
126
21 19 17 15 13
1 m 25 m 50 m
Early May Late May
Early May Late May
Early May Late May
127 126 127
33
Density (sigma-t)
Early May (1m) Density (sigma-t) Late May (1m)
36 35 34 33 32 27
1 2 3 4 5 6 7 8 9 10
0 13
20 40 60 80 100
15
St.3
St.17 St.15
Early May
17 19 21
11 12 13 14 15 16 17 18 19 20 1 2 3 4 5 6 7 8 9 10 11 12 13 14 15 16 17 18 19 20 26
25 24 23
13 15
Late May
17 19 21
Depth (m)
0 32
20 40 60 80 100
33
Early May
34 35 32 33 34 35
Late May
Depth (m)
0 20
20 40 60 80 100
14 12 10 8 6 4 2
0
25
W = 1.4 m/s Early May Late May
W = 4.4 m/s W = 11.5 m/s
50
1 6 11 16
April 21 26 1 6 11 16
Date May 21 26 31 5 10 June 15 20 25 30
0
21 22
Early May
24
23 25 26 20 21 22 23 24 25 26
Late May
0
25
W = 1.4 m/s W = 4.4 m/s W = 11.5 m/s
50
0
25
W = 1.4 m/s W = 4.4 m/s W = 11.5 m/s
50 0 60 120 180 0 60 120 180 0 60 120 180
부근에서
,
정점17
에서는수심35 m
부근에서시작되었고정점15
의수온약층이수심60 m
까지가장깊게형성되었다.
염분약 층과밀도약층은5
월말정점15
에서수심15-30 m
사이에두드 러지게나타난반면,
나머지정점에서는미약하게형성되었다.
제주도남부해역연안에위치하는지귀도에서2013
년4-6
월 동안관측된바람의세기는평균적으로4
월에6.0 m/s, 5
월에4.4 m/s, 6
월에5.2 m/s
로나타났으며, 5
월은다른달에비하여3 m/s
이하의온화한바람이많이불었다(Fig. 7). CTD
조사시 기와일치하는5
월의바람세기의조건(
평균4.4 m/s,
최소1.4 m/s,
최고11.5 m/s)
아래에서고등어알이수직적으로어떻게 분포할수있는지살펴보았다(Fig. 8).
모든가정에서공통적으 로알의개체수는표층으로갈수록더욱많았고,
바람의세기가 같은조건에서는정점간의수직분포패턴이매우유사하였다(ANCOVA, F<0.01, P>0.99).
또한5
월말정점15
에서뚜렷이 나타났던약층은알분포에큰영향을미치지못하는것으로나 타났다(Fig. 8c).
바람세기가평균이상인11.5 m/s
로강하게불 때모든정점에서알의표층개체수밀도가현저하게감소하였고
(ANCOVA, F>21, P<0.001)
최고분포수심또한깊어져50
m
부근까지알이분포할수있었다.
고 찰
고등어알은분리부성란으로한개의유구를가지고있었으
며수정에서부화까지소요된시간은수온
20°C
에서약48-50
시간이었다
.
난경은1.14-1.20 mm
로지금까지보고된태평양 산고등어알의난경인Kramer (1960)
의1.06-1.14 mm, Wata- nabe (1970)
의0.90-1.10 mm, Kim et al. (2008)
의0.98-1.02 mm, Park et al. (2008)
의0.94-1.02 mm
보다다소컸으나Ya- mada et al. (2007)
의0.90-1.30 mm
의범위에는포함되었다.
부화기간동안알의비중은일정한패턴으로변하였다
.
먼저 초기발생단계의알은시간이지남에따라비중이점차적으로 감소하였고배체의기관이대부분형성된단계부터부화까지 는갑작스럽게증가하는것을관찰할수있었다.
이러한패턴 은앞서보고된대서양대구(Gadus morhua)
알(Anderson and
Fig. 5. Vertical distributions of temperature (°C), salinity (psu) and density (sigma-t) at 20 CTD stations in early May and late May. The distribution was represented by three water-depths of 1 m (thick solid line), 25 m (dotted line) and 50 m (thin solid line).정경미
ㆍ
강수경ㆍ
차형기ㆍ
최광호ㆍ
Mari S. Myksvoll962
34
20
Jeju is.
19 20
2 3
4 10
9 8
12 11 18
14 15
17 16
13 5
6 7 33
80 60 40 20
1.023 1.022 1.021 1.020 1.019
34
33
1 4 7 10 13 16 19 22 25 28 31 34 37 40 43 46 49 1.018
Temperature (˚C)
Early May (1m) Temperature (˚C) Late May (1m)
1.0188 1.0193 1.0198 1.0203 1.0208 1.0213 1.0218 1.0223 1.0228 0
126 127
May
Egg specific gravity
Mean egg specific gravity
Temperature ( ˚C) Salinity ( psu ) Density ( sigma-t ) Depth (m) Depth (m) Depth (m)
Station
(a) Temperature (˚C)
(b) Salinity (psu)
(c) Density (sigma-t)
(a) Station 3
(b) Station 17
(c) Station 15
Egg concentration (number m
-3)
Depth (m)
Station Hours after fertilization
June
34
33
Salinity (psu)
Early May (1m) Salinity (psu) Late May (1m)
34
126
21 19 17 15 13
1 m 25 m 50 m
Early May Late May
Early May Late May
Early May Late May
127 126 127
33
Density (sigma-t)
Early May (1m) Density (sigma-t) Late May (1m)
36 35 34 33 32 27
1 2 3 4 5 6 7 8 9 10
0 13
20 40 60 80 100
15
St.3
St.17 St.15
Early May
17 19 21
11 12 13 14 15 16 17 18 19 20 1 2 3 4 5 6 7 8 9 10 11 12 13 14 15 16 17 18 19 20 26
25 24 23
13 15
Late May
17 19 21
Depth (m)
0 32
20 40 60 80 100
33
Early May
34 35 32 33 34 35
Late May
Depth (m)
0 20
20 40 60 80 100
14 12 10 8 6 4 2
0
25
W = 1.4 m/s Early May Late May
W = 4.4 m/s W = 11.5 m/s
50
1 6 11 16
April 21 26 1 6 11 16
Date May 21 26 31 5 10 June 15 20 25 30
0
21 22
Early May
24
23 25 26 20 21 22 23 24 25 26
Late May
0
25
W = 1.4 m/s W = 4.4 m/s W = 11.5 m/s
50
0
25
W = 1.4 m/s W = 4.4 m/s W = 11.5 m/s
50 0 60 120 180 0 60 120 180 0 60 120 180
deYoung, 1994; Jung et al., 2012),
대서양멸치(Engraulis en- crasicolus)
알(Ospina-Álvarez et al., 2012),
대서양넙치(Hip- poglossus hippoglossus)
알(Mangor-Jensen and Waiwood,
1995)
의비중실험결과와유사하였다.
하지만이와다르게태평양명태
(Theragra chalcogramma)
알의비중은크게증가하 다가부화직전에감소하였고(Kendall and Kim, 1989),
우리나 라 해역에분포하는 앨퉁이(Maurolicus maurolicus)
알은초 기에서후기발생단계로갈수록비중이증가하였다(Kim et al.,
2004).
현재까지발생단계별알의비중변화에대한원인은명확히밝혀져있지않으나
,
공통적으로부성란에서본실험결과 와유사한패턴이관찰된것은침성란과구별되는생물학적특 징일것으로생각된다.
알의부력
(Δρ)
은환경수(ρ
water)
와알(ρ
egg)
의비중차이로정의된다
(
즉, Δρ= ρ
water-ρ
egg)(Sundby, 1991).
만약알의비중이 주변환경수의비중보다크면알은자연히하강할것이고,
알 의비중이환경수보다낮으면상승할것이다.
알과환경수의비 중이동일한지점에서는정지하는중성부력을나타낸다.
고등 어의산란장으로잘알려져있는제주도주변해역(Choi, 2003)
은4-6
월에표층수의수온이약13-21°C,
밀도는1.023-1.026
이다
(KODC, 2013).
본조사에서고등어알의평균비중은수온
20°C
에서1.021
이었기때문에알의비중이서식지해수의비중보다
2-5×10
-3의 범위에서 낮을 것으로판단된다.
따라서고등어알은강한부력으로표층가까이떠오를수있게된 다
.
이와유사하게일본산정어리(Sardinops melanostictus)
알 은1-4×10
-3(Tanaka and Franks, 2008),
대서양대구(Gadus morhua)
알은0-5×10
-3(Jung et al., 2012)
의범위에서환경 수보다비중이낮았다.
대서양고등어(Scomber scombrus)
의 경우도알의비중이주변환경수보다낮거나비슷하여표층으 로갈수록많은개체수의알이분포하는것으로보고된바있다(Coombs et al., 2001).
실제해양환경에서알의수직분포는생물학적
(
알의부력,
알 의크기),
물리학적(
해수의밀도,
해수의점성도,
난류등)
요인 들의상호관계에의해결정된다(Sundby, 1991).
본연구의모 Fig. 6. Vertical profiles of (a) temperature (°C), (b) salinity (psu),and (c) density (sigma-t) measured at station 3 (solid line), station 15 (dotted line), and station 17 (dashed line) in early May and late May. Arrows indicate mean egg specific gravity of early developmental stages from S1-S7 measurements.
Fig. 7. Daily mean wind speed (m/s) from April to June 2013 measured at the station of Jigwido. The horizontal dotted line indicates average wind speeds in each month.
Jeju is.