DOI:http://dx.doi.org/10.5389/KSAE.2011.53.6.093
An Optimum Light Environment Design of Double-Stack Bed System by using Genetic Algorithms
유전알고리즘을 이용한 2단재배 온실의 광환경 최적화
Kim, Keesung*,†
김기성
ABSTRACT
본 연구에서는 자연광 이용 온실의 재배면적을 최대화 하기 위하여 작물생강 모델링, 태양의 위치 및 일사량을 이용하여 2단재배 시 스템을 위한 한계일사량 산정 모델, 2단재배 광환경 분성 모델을 개발하였다. 그리고 광환경의 변화에 따른 작물 생장 지체시간을 이용 하여 작물의 생산량이 최대가 될 수 있는 한계 일사량의 값을 산정하여 2단 재배 시스템을 최적 설계 하였다. 2단재배 시스템의 최적 설계를 위한 분석결과 총 생산량이 약 3.669 kg (d.m.) · m-2· yerar-1이며, 기존 재배방식보다 130.2 %의 생산 증대 효과를 잦는 것으 로 계산 되었다. 이와 같은 다단재배 시스템은 온실 내부의 공간을 효율적으로 이용하여 제배면적 대비 에너지 투입 비용을 절감 할 것으로 기대 된다.
Keywords: Multi-stack bed system, natural light environment, optimum design, genetic algorithm
I. INTRODUCTION*
The modern greenhouse industries nowadays propose at a sustainable crop production system with improved pro- duction and reduced energy consumption and production cost (Sigrimis et. al., 2000, Körner and Van Straten, 2008).
However, practically 47-68 % of greenhouse floor area is used crop growth (Langhans, 1990).
A-type Styrofoam boards originally developed at the University of Arizona was modified to spray nutrient solution from inside Styrofoam board by slanting the plate in A-shape. This allowed for the efficient cultivation of leaf vegetables and strawberry whose shooting heights are short, even in relatively small areas. General Mills Inc. in the USA developed a cultivation method in which the bench in between bench cultivation was adjustable depending on the plant growth stages, while the Foittaka Company in
* School of Mechanical and Aerospace Engineering, Seoul National University
† Corresponding author Tel.: +82-2-883-7301 Fax: +82-2-889-6205
E-mail: [email protected] 2011년 10월 24일 투고 2011년 10월 31일 심사완료 2011년 11월 2일 게재확정
the USA equipped an automated multi-stack-bed cultivation facility for a natural-light-utilizing plant factory. A multi- stack bed greenhouse is a system to enhance plant pro- ductivity practicality area as compared to the common greenhouse.
The objectives of this study were 1) to develop a model to estimate critical sunlight radiation intensity, 2) to analyze light environment for a double stack bed system, 3) to design efficiently using optimization algorithm, and 4) to analyze productivity of a double stack bed system.
II. MATERIALS AND METHODS
1. Plant Production Model
The standard approach to crop growth simulation starts with the calculation of net photosynthesis rate of the canopy. Net photosynthesis is obtained from gross photo- synthesis after subtraction three respiration terms; light respiration and growth respiration, which are assumed to be proportional to gross photosynthesis; growth respiration, which is assumed to be proportional to total dry weight.
The rate of dry-weight accumulation can be expressed as (Seginer et al., 1991):
(1)
Right in eq. (1) is the gross photosynthesis rate and the second term represents the maintenance respiration rate.
G is the closed canopy gross photosynthesis rate (kg · m-2), P is the Photosynthetically Active Radiation (PAR) flux (W · m-2) reaching the top of the canopy, T is the ambient temperature (K), M is the gross photosynthesis correction for partial canopy, L is the leaf area index (m2
· m-2), R is the respiration rate (corrected as G, kg · kg-1
· s-1), N is the effective crop mass for respiration (kg · m-2) and W is mass of dry matter per growth area (kg · m-2). CO2 concentration is assumed to remain constant at the normal atmospheric level.
In the second term on the right side of eq. (1), R is the rate of maintenance respiration of a unit dry matter of tissue, and N{W} represents the effective dry mass of the crop. Simplified forms of G, M, R and N are as follows (Seginer et al., 1991):
(2)
(3)
exp
(4) (5)
where, is the efficiency of dry matter production from PAR; and a, b and RR are coefficients, whose values are 0.8, 0.0693, and 0.427×10⁻⁶· s-1 TR is a reference tem- perature (25 ℃); B{T} is the rate of gross photosynthesis of the closed canopy at light saturation and ambient temperature, since there is an optimal temperature for gross photosynthesis. Simplified forms of B{T} are as follows (Seginer et al., 1991):
(6)where, TR is reference temperature; BR is coefficient (1.46×10⁻⁶ kg · m-2· s); is coefficient (-5.46×10⁻⁹ kg ·
m-2· K · s-1); is coefficient (-5.46×10⁻⁹ kg · m-2· K2· s-1).
Photosynthesis produced by the crop is immediately partitioned among its organs. A certain fraction is trans- formed into leaf structure. Assuming this to be constant and denoting it by m, following relationship may be developed for a vegetative crop (Seginer et al., 1991):
(7)
Where is mass of dry matter per growth area in shoot (0.83 kg · kg-1) and m is fraction shoot to total dry matter (kg · kg-1).
Leaf area ratio (LAR) results for consecutive days as a linear function of mean temperature and radiation, as well as LAR, of the previous day. Since the mass thickness of leaves does not change once they are formed, it seems more natural to construct a differential equation that relates the thickness of the new growth to temperature and PAR (Seginer et al., 1991):
(8)
As a first approximation, a linear form of A {T,P} seems suitable (Seginer et al., 1991)
(9)Where AR (74 m2· kg-1) is the LAR of new leaves formed at reference temperature, TR (278.16 K); PAR, PR (127 W · m-2); is positive coefficient (2.9 m2· kg-1· K); is positive coefficient (0.26 m2· m2· kg-1· W-1).
Finally, the gross production per year () in double- bed system is calculated as follows:
(10)
(11)
(12)where is gross production per month, is growth speed; is temperature; is solar radiation;
is harvest dry weight; is cropping area of each bed; is growth periods(day); is location of bed (1=
top side bed, 2=bottom side bed).
2. Photosynthetically active radiation (PAR) distribution in double-bed system
a. The location of the sun
The location of the sun in the sky is described in terms of its altitude () or zenith angle () and its azimuth angle (AZ). The zenith angle of the sun depends on the time of day, the latitude of the site, and time of year (Campbell and Norman, 1998). It is calculated from
sin sinsin coscoscos
(13)where is the latitude; is solar declination angle; is time; is the time of solar noon. The earth turns at a rate 360º per 24 hours, so the 15 factor converts hours to degrees. Time, t is in hours (standard local time);
ranging from 0 to 24.
The declination of the sun () is the angle between the ray of the sun and the plane of the earth’s equator. Since the angle between the earth axis and the plane of the earth orbit in nearly constant, the varies with the season and its period is one year, which is the time needed by the earth to complete its revolution around the sun.
When the projection of the earth axis on the plane of the earth orbit is perpendicular to line linking the earth and the sun, the angle between the rays of the sun and the plane of the earth equator is null. An alternative form is given as;
sin
(14)where is day of the year; that is the number of days spent since January 1st.
b. Calculation of shading by double-stack bed systems
At any given time the height of an object’s (H) shadowas cast on any horizontal surface is directly proportional to its height, and to the angular elevation of the source illumination (Parry and Gold, 1972). When the shadow of an object reaches any height of surface, the shadow coordinate (x,y,z) can be calculated using the following equation:
tan
sin tan
sin (15)
tan
cos tan
cos (16)
(17)
where is the latitude; H is a shadow of any height of an object; t is any height of surface; h is any coordinate.
c. Intensity of solar radiation
The solar radiation received at a double-stack bed system both direct solar radiation () and diffuse solar radiation (). The calculations in the present study are based on the approach of Kreith and Kreider (1978). is the portion of the extraterrestrial solar radiation (), which reaches the earth’s surface directly after extinction in the atmosphere.
×
cos ×
(18)where is solar constant (1368 ∙ ), n is Julian date.
reaching the earth’s surface can be parameterized as follows:
×cosec (19)
where is atmospheric transmittance for solar radiation, Z is Zenith angle.
Finally, the direct solar radiation () in relation to the horizontal level is calculated as follows:
× sin (20)
where h is solar angle.
Diffuse solar radiation () is the portion of solar radiation which arrives on the surface of the earth after single or repeated dispersion in the atmosphere. The present study is based upon Berlage’s approach. The complete formula reads as follows:
sin
ln
cosec
(21)
where is atmospheric transmittance for solar radiation,
is solar angle.
3. Theoretical model development and procedures
The difference between top and bottom beds affects plant growth and thus the following was assumed for the system optimization purpose.
a. Growth retention time (GRT)
The plants on the bottom bed grow slower than those on the top bed. The growth rate differs proportionally to the growth retention time (GRT), which is a function of difference in growth day and physical distance between top and bottom beds.
tan
× (22)
Design light intensity for the bottom bed was defined by limited solar radiation (LSR) considering the distance between the top and bottom beds. When a cumulative diurnal solar radiation (from 6 am to 6 pm) is smaller than the critical value, the day was excluded for the evaluation.
A double-bed system was designed by evaluating the GRT in a manner to maximize the amount of annual product.
b. Lettuce growth model
Growth days were estimated by using a plant model incorporated with factors associated with light intensity, day and night temperatures, and target dry biomass. Lettuce was used as the study plant and was transplanted and
harvested into/from the bed and harvested when dry biomass per unit area reached 0.014 kg and 0.302 kg, correspondently.
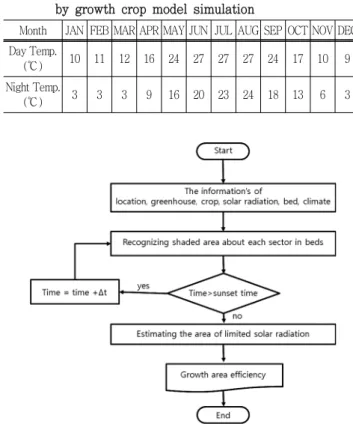
The day and night temperatures inside greenhouse were controlled within 10 % deviation from those when the growth rate was at maximum. The detailed monthly set points are summarized in Table 1.
Dimensions of the greenhouse to applied were 10 m, 46.5 m, 2.7m, and 4.95 m for width, length, side wall height, and central maximum height, respectively. The bottom and top bed with 1.5 m wide and 10 m long in dimension were placed at 40 cm and 2 m. The minimum width for the central corridor was 90 cm. Unit cell size of bed was 30×30 cm, which is equivalent to what a lettuce head occupies, and considered to be cultivable when light radiates over 50 %. Light transmittance was 0.7 and the greenhouse was oriented in the east-west direction.
4. The basic construction of a model
To estimate the amount of light radiation to the bottom
Table 1 The day temperature and night temperature settings by growth crop model simulation
Month JAN FEB MAR APR MAY JUN JUL AUG SEP OCT NOV DEC Day Temp.
(℃) 10 11 12 16 24 27 27 27 24 17 10 9
Night Temp.
(℃) 3 3 3 9 16 20 23 24 18 13 6 3
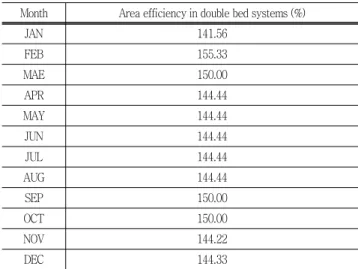
Fig. 1 Flowchart of solar radiation model
Table 3 Limited solar radiation in bottom beds at 13 % of GRT (w · m2)
Month JAN FEB MAR APR MAY JUN JUL AUG SEP OCT NOV DEC
LSR (13 %) 145.74 188.57 251.81 299.88 331.2 320.71 258.08 271.41 247.72 208.69 143.4 120.32
bed, the data associated with regional climate, greenhouse structure, sun location, and bed shape were used for the model input and light intensity was calculated on a cell unit basis and cumulated over a bed (Table 1). Total cultivable area was expressed in growth area efficiency, which is a normalized form (%) to the total area. The calculation procedure for light radiation reached the bottom bed was conceptualized in Fig. 1.
∑
×
(23)
5. Optimization of plant growth area
A simple genetic algorithm was applied to find an optimal solution of the multi-variable function. Genetic algorithms are trial and error methods to optimize issues with complex objective functions employing the concepts of crossover and mutation from genetics and evolution (Holland, 1975).
A simple genetic algorithm has been applied to a number
Fig. 2 The flowchart for genetic algorithms
of optimization problems because of its powerfulness in finding a solution (Goldberg et al., 1989).
For the model application, binary 2 bit genes were generated and each individual then was expressed as gene type. Then using multi-stack light analysis model, the growth area efficiency was calculated for each individual and this procedure was iterated until all population members were processed. Once a population was processed, then the model proceeded to the next generation and generated new genes. During this process, genetic mutation and crossover occurs and superior individuals would dominate to converge to an optimal solution as the generation increases (Fig. 2).
III. Result and discussions
1. Limited solar radiation on double stack bed system
To determine a critical light radiation, an arbitrary double stack bed system was modeled for each retention time of 0 %, 8 %, 10 %, 15 %, and 20 % and the resulting light radiation amounts were analyzed. The growth area efficiencies of lettuce from Jan. through Dec. were estimated using a radiation model (Table 2). As shown in Table 2, most of gross products were at maximum between the retentions times of 8 % and 13 %. Products between this range were within 99 % of the maximum value and thus 8% to 13 % was considered to be a reasonable retention time range for the critical light radiation. Subsequently 13 %
Table 2 Gross products per the height of top bed with changing GRT in double bed system (Growth Retention Time; GRT (%))
GRT (%) 0.6 0.8 1.0 1.2 1.4 1.6 1.8
0 4.534 4.62 4.607 4.697 4.717 4.697 4.652 8 4.624 4.678 4.666 4.715 4.743 4.723 4.707 10 4.602 4.66 4.66 4.708 4.719 4.701 4.684 13 4.602 4.693 4.653 4.692 4.747 4.692 4.691 15 4.586 4.652 4.626 4.687 4.712 4.664 4.667 20 4.579 4.652 4.642 4.653 4.704 4.652 4.629
Table 7 Analysis of gross production about each month in double bed system
Month JAN FEB MAR APR MAY JUN JUL AUG SEP OCT NOV DEC
Gross production
kg (d.m.) ․ m-2․ year-1 3.576 3.620 3.663 3.829 3.828 3.828 3.828 3.830 3.669 3.669 3.579 3.576
of retention time was chosen for the critical value in this study, which was used as a reference intensity to determine cultivability of the bottom bed for the radiation environment analysis. Monthly critical radiations for the bottom bed were presented in Table 3.
2. An optimum design of double bed systems
Monthly setting for a multi-stack bed system was optimized by using a genetic algorithm. Gene information for the genetic algorithm used is presented in Table 4.
Monthly maximum efficiencies were low during the winter (Nov., Dec., and Jan.) and summer seasons (Jun., Jul., and Aug.), while the efficiencies were high in Sep and Oct and the maximum efficiency of 155.33 % occurred in Feb.
(Table 5). Annual production was estimated to determine the best bed design and associated parameter setting used are summarized in Table 6. The gross productions for a double bed system are also presented in Table 7. Gross productions appeared to be higher in the fall season (Sep., Oct., and Nov.) than the other months. When the bed positions are fixed, the declination was the most important factor in changing the length and location of shade area.
The declination angle is 0° for spring and fall and the highest of 23.5° for summer and the lowest of -23.5° for winter. For a winter season, sunlight can penetrate deeply into the greenhouse due to the low declination angle but cause greater interference at the same time because of
Table 4 The information of parameters in double beds in genetic algorithms
Double bed systems
Generation 30
Numchrom 100
Factor 7
Size 39
Elite Percent 0.05
CrossOver 1
Mutation 0.4
the long shadow. Accordingly the gross radiations become low and thus the growth rate also gets slow down to resulting in low efficiency. In contrast, the declination angle is high during summer and thus sun rises high. The resulting shadow length may be short and accordingly, the top bed shadow would affect the bottom bed more substantially and resulted also in low efficiency. The optimal
Table 5 The estimation of optimum area efficiency per month in double beds systems
Month Area efficiency in double bed systems (%)
JAN 141.56
FEB 155.33
MAE 150.00
APR 144.44
MAY 144.44
JUN 144.44
JUL 144.44
AUG 144.44
SEP 150.00
OCT 150.00
NOV 144.22
DEC 144.33
Table 6 The different growth period between top and bottom beds
MonthDuration (day)
Growth period in top beds (day)
Growth period in bottom beds (day)
First drymass kg (d.m.) ․ m-2
Final drymass kg (d.m.) ․ m-2
JAN 31 44.6 50.4 0.014 0.302
FEB 28 34.7 39.2 0.014 0.302
MAE 31 27.5 31.1 0.014 0.302
APR 30 22.6 25.5 0.014 0.302
MAY 31 21.4 24.2 0.014 0.302
JUN 30 24.6 27.8 0.014 0.302
JUL 31 34.7 39.2 0.014 0.302
AUG 31 33.5 37.9 0.014 0.302
SEP 30 29.5 33.3 0.014 0.302
OCT 31 31.5 35.6 0.014 0.302
NOV 30 46.5 52.5 0.014 0.302
DEC 31 55.5 62.7 0.014 0.302
Fig. 3 Dimension of double bed system greenhouse (section view, unit: cm)
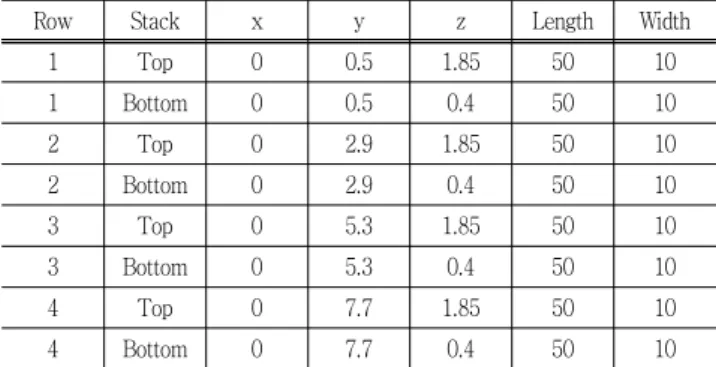
Table 8 An optimum coordinate of double bed system (m)
Row Stack x y z Length Width
1 Top 0 0.5 1.85 50 10
1 Bottom 0 0.5 0.4 50 10
2 Top 0 2.9 1.85 50 10
2 Bottom 0 2.9 0.4 50 10
3 Top 0 5.3 1.85 50 10
3 Bottom 0 5.3 0.4 50 10
4 Top 0 7.7 1.85 50 10
4 Bottom 0 7.7 0.4 50 10
design conditions for a double bed system are given in Table 8 and the dimensional shape was depicted in Fig. 3.
IV. CONCLUSIONS
In this study, the area efficiency for a double bed system was estimated by a plant growth model plugged with sunlight radiation angle and amount as input data. An optimization technique of genetic algorithm was also incorporated into the model for the purpose of efficient design of the double bed system. Standard climatic data were used for the model calibration of radiation and the radiation amount at the bottom bed was estimated using plant growth model. Through comparing plant growth between the radiations of diurnal fluctuation and constant value at average, however with
the same daily cumulative amount, optimal diurnal and night greenhouse temperatures were determined for a given growth period. The critical radiation to the bottom bed was estimated by evaluating the number of growing days required to produce target biomass using the plant growth model at the average radiation. Average radiation requirement taking into account the growth retention at the bottom bed was also estimated for a given number of growing days.
The optimal radiation for the bottom bed that satisfy annual gross production ranged 8 % and 13 % and thus 13 % was chosen for the reference value in this study to determine cultivability and to optimize the system design and operation.
The double bed system analyzed in this study resulted in the annual gross production of 3.669, which is improved by 130.2 % in productivity as compared to conventional cultivation method. Double stack cultivation also demonstrated efficiency in area utilization, which is often limited.
This work was supported by Priority Research Centers Program through the National Research Foundation of Korea (NRF) funded by the Ministry of Education, Science and Technology (2010-0029613) and Technology Development Program (108109033CG000) for Agriculture and Forestry, Ministry for Food, Agriculture, Forestry and Fisheries, Republic of Korea.
References
1. Campbell G. S., and J. M., Norman, 1998. An introduction to environmental biophysics. Springer, New York, USA
2. Goldberg D. G., B. Korb, and K. Deb, 1989. Messy genetic algorithms: motivation, analysis, and first results.
Complex System,
4: 415-444.3. Holland J. H., 1975. Adaptation in natural and artificial systems. Ph. D. diss., Ann Arbor, MI, USA.: The University of Michigan.
4. Kreith F.,and J. F. Kreider, 1978. Principles of solar engineering. McGraw-Hill, New York, NY.
5. Körner O., and G. Van Straten, 2008. Decision support for dynamic greenhouse climate control strategies.
Computer and Electromics in Agriculture,
60: 18-30.6. Langhans R. W., 1990. Greenhouse management. Halcyon press Ltd. pp. 33-45, Houston,USA.
7. Parry J. T., and C. M. Gold, 1972. Solar-altitude nomogram.
Photogrammetric Engineering
38: 891-899.8. Seginer I. G. Shina, L. D., Albright, and L., S., Mash, 1991. Optimal temperature setpoints for greenhouse lettuce.
Journal of Agricultural Engineering Research
49: 209-226.9. Sigrimis N. A. Anastasiou, and N. Rerras, 2000, Energy saving in greenhouses using temperature integration:
a simulation survey.