• 검색 결과가 없습니다.

Relationship assessment among land use and land cover and land surface temperature over downtown and suburban areas in Yangon City, Myanmar

N/A
N/A
Protected

Academic year: 2021

Share "Relationship assessment among land use and land cover and land surface temperature over downtown and suburban areas in Yangon City, Myanmar"

Copied!
12
0
0

로드 중.... (전체 텍스트 보기)

전체 글

(1)

1. Introduction

Land Surface Temperature (LST) plays an important role in studies about the global change, heat balance as

a factor for control of climate change, and Urban Heat Island (UHI) (Weng et al., 2004). The rapid urban expansions have caused Land Use and Land Cover (LULC) changes, which affect the ecological

Relationship assessment among land use and land cover and land surface temperature over

downtown and suburban areas in Yangon City, Myanmar

Khin Mar Yee*, Hoyong Ahn*, Dongyoon Shin* and Chuluong Choi*

*Department Spatial Information Engineering, Pukyong National University

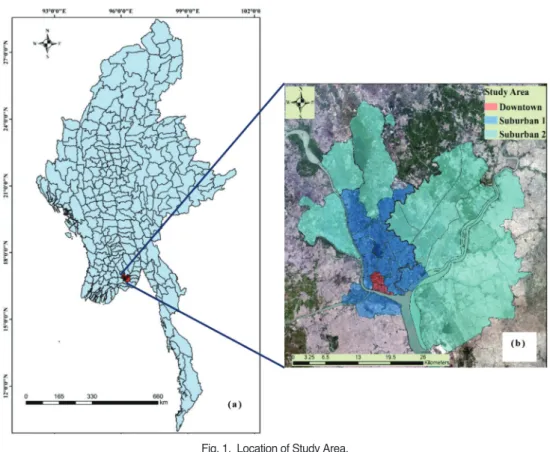
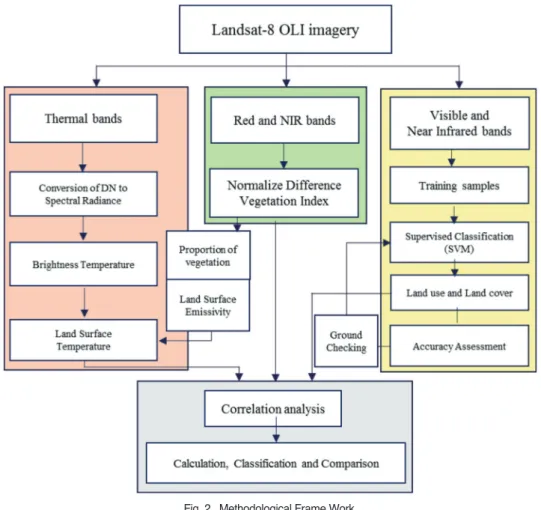
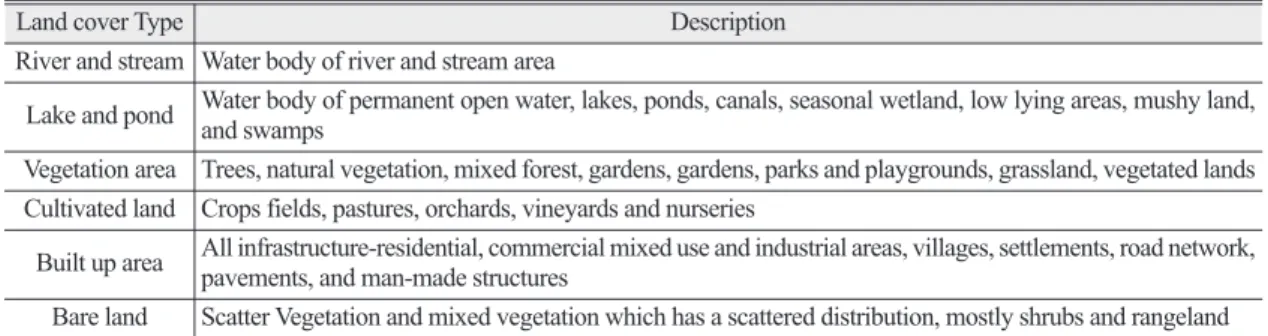
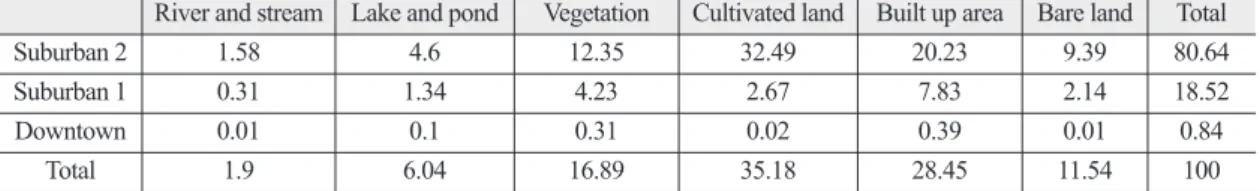
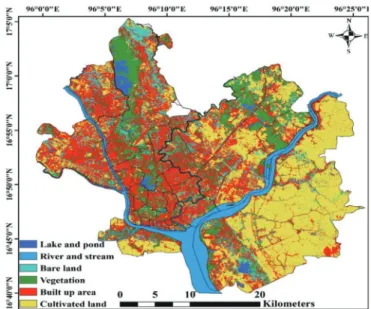
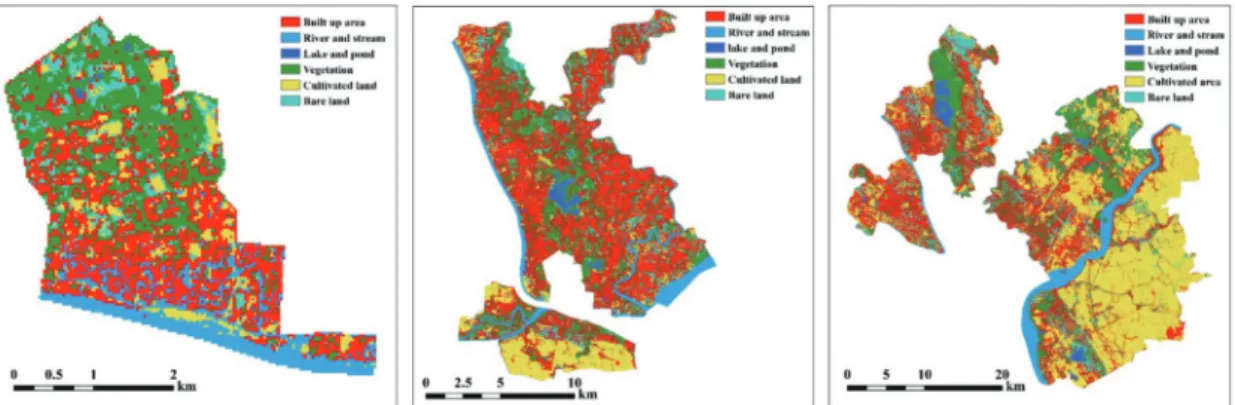
Abstract : Yangon city is experienced a rapid urban expansion over the last two decades due to accelerate with the socioeconomic development. This research work studied an investigation into the application of the integration of the Remote Sensing (RS) and Geographic Information System (GIS) for observing Land Use and Land Cover (LULC) patterns and evaluate its impact on Land Surface Temperature (LST) of the downtown, suburban 1 and suburban 2 of Yangon city. The main purpose of this paper was to examine and analyze the variation of the spatial distribution property of the LULC of urban spatial information related with the LST and Normalized Difference Vegetation Index (NDVI) using RS and GIS. This paper was observed on image processing of LULC classification, LST and NDVI were extracted from Landsat 8 Operational Land Imager (OLI) image data. Then, LULC pattern was linked with the variation of LST data of the Yangon area for the further connection of the correlation between surface temperature and urban structure. As a result, NDVI values were used to examine the relation between thermal behavior and condition of land cover categories.

The spatial distribution of LST has been found mixed pattern and higher LST was located with the scatter pattern, which was related to certain LULC types within downtown, suburban 1 and 2. The result of this paper, LST and NDVI analysis exhibited a strong negative correlation without water bodies for all three portions of Yangon area. The strongest coefficient correlation was found downtown area (-0.8707) and followed suburban 1 (-0.7526) and suburban 2(-0.6923).

Key Words : Yangon City, Land Use and Land Cover (LULC), Normalized Difference Vegetation Index (NDVI), Land Surface Temperature (LST)

Received August 5, 2016; Revised August 22, 2016; Accepted August 29, 2016.

Corresponding Author: Chuluong Choi ([email protected])

This is an Open-Access article distributed under the terms of the Creative Commons Attribution Non-Commercial License (http://creativecommons. org/licenses/by-nc/3.0) which permits unrestricted non-commercial use, distribution, and reproduction in any medium, provided the original work is properly cited

Article

(2)

environmental process at local and regional levels, especially the urban heat island (Gallo and Owen, 1998; Streuker, 2003 and Weng, 2003). Urbanization is believed one the most prevalent anthropogenic causes of the losing arable land, devastating habitats, and the decline in natural vegetation cover (Dewan and Yamaguchi, 2009). Therefore, urban areas tend to experience a relatively higher temperature compared with the surrounding areas. Rapid urban sprawl and population growth in metropolitan change physical properties of urban land surface, in which, temperature in urban areas are a few degrees higher than in surrounding non-urbanized areas. The rapidly change of urban sprawl and population growth in metropolitan change physical properties of urban land surface, in which, temperature in urban area are a few degrees higher than in surrounding non-urbanized area (Xian and Crane, 2005). It can be used to assess and evaluate the spatial relationship between LST and different LULC in urban areas and environments (Amiri, 2009).

As a consequence, rural areas have been converted into urban areas with an unprecedented rate and making a noted effect on the natural functioning of ecosystems (Turner, 1994). Global environmental change and management practices in the urban environment because LST is closely related to the distribution of LULC characteristics. Cities are characterized by increased air and surface temperatures as compared to their rural surroundings. This so called UHI effect is caused by the specific urban structure, the set of physical features which can be described by land-use patterns and other structural indicators, such as the degree of surface sealing (Thinh et al., 2002). The increase of thermal environment in urban, the LST of study area is calculated from available information of satellite images (Xiaolu and Wang, 2011). Recently, various studies on UHI have been based on remote satellite images instead of air temperature obtained from weather stations (Li et al., 2009). To determine the increase of thermal environment in urban, the LST

of study area is images (Xiaolu and Wang, 2011; Voogt and Oke, 1998 and Weng, 2009) indicated that LST parameter is able to modulate the air temperature above the earth surface and close related to surface radiation and energy exchange. Research has shown that UHI is primarily caused by the built environment in urban areas, in which natural areas are replaced with non- permeable and high temperature surface of concrete and asphalt (Jones et al., 1990). With the support of Geographical Information Systems (GIS), satellite images can effectively estimate and analyze changes and LULC trends (Hathout, 2002). Consequently, a profound understanding of land use change is very important to have a proper land use planning and sustainable development policies (Braimoh and Onishi, 2007). According to Myint and Wang (2006), to fulfil such a sustainable urban development, urban and regional planners have to summarize from numerous decisions. The objectives of this research were to demonstrate the integrated use of remote sensing and GIS in evaluate urban growth patterns in the downtown and suburban areas of Yangon environment and to analyze the impact of the urban growth on surface temperature. Also, this study was to examine the spatial distribution characteristics of urban surface temperatures environments by analyzing surface temperature distribution patterns in term of land cover states and Normalized Difference Vegetation Index (NDVI) status.

2. Study Area

The study area is Yangon area. It was the former capital of Myanmar and lying between 16˚ 41’ 00’’ N to 17˚ 5’ 30’’ N latitudes and 95˚ 59’ 30’’ E and 96˚

27’ 30’’ E longitudes (Fig. 1). This area enjoys tropical

monsoon climate, with an average annual temperature

about 28.5˚C, high temperature average 38˚C in the

summer and 26.5˚C in the winter (based on the ground

(3)

station data). To better the study sites can be described the LULC patterns, based on land use properties, development of intensity and socio-economic level of the study area, a total of thirty four townships was recognized as downtown, suburban 1 and suburban 2.

Downtown is Central Business District (CBD) area of Yangon and was situated very high residential areas of 6 townships. Suburban area is located between CBD and urban fringe and contains 20 townships. Suburban 2 includes 8 Townships. Six townships of downtown area was defined as the CBD and other 28 townships can be divided into two parts such as suburban 1 and 2.

Suburban 1 was included 20 townships and mainly took place as the residential area. Eight townships of suburban 2 can be seen at the edge of the study area and occupied both scatter residents, cultivated land, vegetation area and large industrial zones. So, based on the remarkable diversity of LULC pattern of

distinguishable three portions of study area. Although this area accounts for only about 0.2 percent of Myanmar’s territory, it plays a very important role in this country’s economy. Therefore, in this paper, our research interest focused on the city center of Yangon and surrounding suburban areas (as is shown in Fig. 1), covering an area of approximately 1428.22 square kilometer.

3. Data and Methodology

1) Data of Satellite Imagery

For this research, image of Landsat 8 Operational Land Imager (OLI) with Thermal Infrared Sensor (TIRS) acquired to observe and the respective dates of acquisition of the 30 March 2015 was obtained

Fig. 1. Location of Study Area.

(a) The Union of the Republic of Myanmar and (b) Study area

(4)

from the official website of United States Geological Survey (USGS) and was used very good quality, with almost no cloud (less than 1 percent) for the study area (Table 1).

The diagram was represented the general trend of this paper. For this paper, the optical band 3, 4 and 5 Visible and Near Infrared (VNIR) of Landsat 8 was processed for LULC and the thermal bands of band 10 and 11 for the LST. The Fig. 2 was illustrated the methodological trend of this paper.

2) Land use and Land cover Classification For the making map of LULC classification, the LULC spatial distribution pattern was mapped by supervised classification with the Support Vector Machine (SVM) classification algorithm. SVMs is a supervised non-parametric statistical learning technique. In its original formulation the method is presented with a set of labeled data instances and the SVM training algorithm aims to find a hyperplane that

Fig. 2. Methodological Frame Work.

Table 1. Image Metadata in this study Scene _ ID “LC81320482015089LGN00”

Spacecraft_ ID “LANDSAT_8”

Sensor_ ID “OLI_TIRS”

Cloud_ Cover 0.5

Image_ Quality_ OLI 9

Time (UTC) 03:54:57

Date 2015-03-30

Earth-sun distance 0.998

Solar-Zenith 115.53

Solar-Azimuth 61.405

Sensor-angle Nadir (roll:-0.001’)

(5)

separates the dataset into a discrete predefined number of classes in a fashion consistent with the training examples (Cortes and Vapnik, 1995). SVM is basically a linear learning machine based on the principle of optimal separation of classes. The linear separating hyperplane is placed between classes in such a way that it satisfies two conditions. Statistically, the optimal boundaries should be generalized to unseen samples with least errors among all possible boundaries separating the classes, therefore minimizing the confusion between classes. (Huang et al., 2002).

For this paper, the six classes of land cover classification considered for the study area are built up area, river and stream, lake and pond, cultivated land, vegetation and bare land. The using satellite images were classified into six classes of LULC types and chosen VNIR composite for Landsat 8 OLI for 2015 was used with training sample sites for land cover classification. The description of LULC classifications can be seen in Table 2 in detail. The procedures of LULC classification can be divided into three phases.

The first phase was a pre-field work including collection of training samples for region of interest. The second phase focused on LULC classification by using with the SVM classifier technique of supervised classification. The third phase examined calculation omission error and commission error and analysis for accuracy assessment of study area. During the making map and data analysis were carried out using ENVI 4.8 and ArcMap 10.2.1 software. The accuracy of the

LULC classification was verified by field checking or comparing with the existing LULC maps that have been also field checked. Then, the successive results were used as basic data for the analysis of the LST by LULC patterns.

3) Retrieval of Land Surface Temperature First, the digital numbers of TIRS band data were transform OLI and TIRS band data was converted to Top Of Atmosphere (TOA) spectral radiance using the radiance rescaling factors provided in the metadata file:

L

λ

= M

L

Q

cal

+ A

L

Where, L

λ

means TOA spectral radiance and M

L

is band-specific multiplicative rescaling factor from the metadata, A

L

indicates for band-specific additive rescaling factor from the metadata and Q

cal

can be Quantized and calibrated standard product pixel values.

The second step was TIRS band data were converted from spectral radiance to brightness temperature using the thermal constants provided in the metadata file:

T

B

=

Where, T

B

defines the meaning of at satellite brightness temperature in Kelvin, L

λ

is TOA spectral radiance and K

2

and K

1

are the band specific thermal conversion constant from metadata.

The emissivity corrected LST were computed as follows (Artis and Carnahan, 1982):

K

2

ln ( ) + 1 K

1

L

λ

Table 2. Description of Land use and Land cover class

Land cover Type Description

River and stream Water body of river and stream area

Lake and pond Water body of permanent open water, lakes, ponds, canals, seasonal wetland, low lying areas, mushy land, and swamps Vegetation area Trees, natural vegetation, mixed forest, gardens, gardens, parks and playgrounds, grassland, vegetated lands Cultivated land Crops fields, pastures, orchards, vineyards and nurseries

Built up area All infrastructure-residential, commercial mixed use and industrial areas, villages, settlements, road network, pavements, and man-made structures

Bare land Scatter Vegetation and mixed vegetation which has a scattered distribution, mostly shrubs and rangeland

(6)

LST =

Where, λ indicates wavelength of emitted radiance (Markham and Barker, 1985) will be used, and P can calculate from the formula of h×c / σ (1.438×10

-2

m K), h means Planck’s constant (6.626×10

-34

Js), σ defines the Boltzmann constant (1.38×10

-23

J/K), c is velocity of light (2.998×10

-8

m/s), the value of P is 14380. ε is land surface emissivity, which was obtained using NDVI Threshold Methods (Sobrino, 2004). P

v

is the vegetative proportion obtained according to Carlson and David (1997) as:

P

v

= (NDVI _ NDVI

min

/ NDVI

max

_ NDVI

min

)

2

Where P

v

indicated the vegetation proportion, ε due to ε

veg

P

v

+ ε

soil

(1 _ P

v

), where ε

veg

is vegetation emissivity, ε

soil

means soil emissivity. Here, soil and vegetation emissivity were estimated as 0.97 and 0.99, respectively (Li et al. 2004). So, calculate NDVI precisely as the following formula:

NDVI = (NIR _ RED) / (NIR + RED)

Where, NDVI means Normalized Difference Vegetation Index and the NDVI image was computed

from visible (0.630-0.680 μm) and near-infrared (0.845-0.885 μm). The following (Fig. 4) was the result of the image processing of NDVI and LST of the whole study area.

4. Results and Discussion

This paper was mainly focused on the relationship assessment among distribution pattern of LULC, NDVI and associated with LST situation of the downtown and suburban areas of Yangon City area. The spatial distribution of LST has been found mixed pattern and higher LST was located with the scatter pattern, together with the related to certain LULC categories for the downtown, suburban 1 and 2. Using the zonal statistics analysis, the average values of LST and NDVI for each LULC classes were calculated. Moreover, in the case of the relationship between LST and NDVI by the 945 randomly selected sample points over the different LULC classes of downtown and suburban areas.

1) Analysis of LULC classification

The generated LULC classification of were shown T

B

p T

B

1 + (λ × ) ln ε

Table 3. The percentage of LULC for Yangon Area

River and stream Lake and pond Vegetation Cultivated land Built up area Bare land Total

Suburban 2 1.58 4.6 12.35 32.49 20.23 9.39 80.64

Suburban 1 0.31 1.34 4.23 2.67 7.83 2.14 18.52

Downtown 0.01 0.1 0.31 0.02 0.39 0.01 0.84

Total 1.9 6.04 16.89 35.18 28.45 11.54 100

*Percent data were calculated by dividing the total study area into the pixel area of a given LULC Table 4. Ground Check Accuracy of LULC

Reference total Classified total Number of correct Producer’s Accuracy User’s Accuracy

River and stream 100 103 100 100.00 97.09

Lake and pond 100 104 97 97.00 93.27

Vegetation area 100 97 94 94.00 96.91

Cultivated land 100 95 90 90.00 94.74

Built up 100 107 97 97.00 90.65

Bare land 100 94 92 92.00 97.87

600 600 570 Overall Accuracy = 95 %

(7)

in Fig. 3 and related statistical analysis was displayed in Table 3. The table showed that the area of three portions can be found that downtown (0.84%) <

suburban 1 (18.52%) < suburban 2 (80.64%). Table 4 was examined the validation of accuracy assessment based on the post field work. For the accuracy assessment, the 100 samples for each LULC class were selected using random method to check with ground points and calculate the producer’s accuracy and user’s accuracy assessment. The validation percentage of the overall accuracy was 95 percentage.

2) Analysis of LST and NDVI

Fig. 4 and Table 5 provided the information for the spatial distribution of LST and NDVI over the Yangon area. The LST retrieval of study area ranged between 26.82˚C and 47.69˚C with the mean LST of 35.76˚C and standard deviation of 3.75. The extracted NDVI

Fig. 4. Spatial distribution of (a) LST and (b) NDVI of Study area.

Fig. 3. Spatial distribution LULC pattern of Yangon area.

Table 5. Average LST of LULC in Yangon City

MIN MAX MEAN STD

LST 26.82 47.69 35.76 3.75

NDVI -0.38 0.6 0.17 0.12

(8)

values over the study region was ranged between -0.38 and 0.6 with the mean value and standard deviation equal to 0.17 and 0.12, respectively.

3) Analysis on LULC, LST and NDVI in Downtown and Suburban areas

Fig. 5 was shown the spatial distribution of LULC pattern and Table 6 was displayed the related area percentage of LULC classes in downtown, suburban 1 and suburban. The results can be seen built up area (48.53%) of downtown was largest percentage and bare land cultivated land (0.63% and 2.21%), were the fewest. Although the no business center, denser residents and complex transportation networks were lied in suburban 1 area. The wider built up area of suburban 1 (42.27%) was larger than other LULC area.

In suburban 2, the cultivated land was covered about

(40.29%) and followed by the built up area (25.08%), respectively.

The spatial distribution of LST of LULC classes in downtown and suburban areas can be found Fig. 6. The results of the mean value of LST of LULC types was shown in Table 7. The average LST of all LULC classes except cultivated land, downtown area were higher than surrounding suburban areas. The total mean LST was ranged downtown (35.11˚C) > suburban 1 (33.8˚C) > suburban 2 (33.69˚C).

Fig. 7 was described the spatial distribution of NDVI value of LULC classes in downtown, suburban 1 and suburban 2. The figure can be seen that the maximum value of NDVI was ranged downtown (0.55) <

suburban 1 (0.59) < suburban 2 (0.6). In addition, the extracted NDVI value of downtown area was lower than surrounding urban areas for all LULC classes and

Fig. 5. Spatial distribution pattern of LULC of the downtown, Suburban 1 and 2.

Fig. 6. Spatial distribution pattern LST of the downtown, Suburban 1 and 2.

(9)

detail description was shown by Table 8.

On the other side, to improve understanding of the LST and NDVI relationship, selected 945 random samples of LST and NDVI of downtown, suburban 1 and suburban 2 without water bodies (river and stream, and lake and pond). The analysis of regression showed a significant inverse correlation between LST and NDVI of downtown, suburban 1 and suburban 2. The results of correlation coefficient can be seen the downtown area was stronger relationship of correlation coefficient of (-0.8707) because of the largely and densely built up area with crowded business centers

with a few greenness area.

The scatter plot of linear regression analysis between LST and NDVI value of downtown and two suburban areas was seen in Fig. 8. The correlation coefficient of suburban 1 was (-0.7526) based on the random samples also negatively relationship. Suburban area was taken by the mainly residential area of built up area and massy with the transportation networks. But, greenness area was more than downtown area. The result of linear regression relationship between LST and NDVI in suburban 2 was (-0.6923) with respectively. Although the correlation value was lowest, some industrial areas, Fig. 7. Spatial distribution pattern NDVI of the downtown, Suburban 1 and 2.

Table 6. The area of LULC class of downtown, suburban 1 and suburban 2 (unit : percentage)

River and stream Lake and pond Vegetation Cultivated land Built up area Bare land

Downtown 0.29 11.45 36.89 2.21 48.53 0.63

Suburban 1 1.66 7.25 22.85 14.42 42.27 11.56

Suburban 2 1.96 5.7 15.32 40.29 25.08 11.65

Table 7. Average LST of LULC classes in downtown, suburban 1 and 2 (unit: ºC)

Built up area River and stream Lake and pond Vegetation Cultivated land Bare land Mean

Downtown 36.35 33.93 34.79 34.61 36.08 34.89 35.11

Suburban 1 35.88 30.04 30.39 34.37 37.37 34.74 33.8

Suburban 2 36.15 28.75 29.98 32.96 39.12 35.18 33.69

Table 8. Average NDVI value of LULC classes in downtown, suburban 1 and 2

NDVI Built up area River and stream Lake and pond Vegetation Cultivated land Bare land

Downtown 0.13 0.01 0.05 0.28 0.1 0.27

Suburban 1 0.17 -0.07 -0.02 0.28 0.14 0.29

Suburban 2 0.2 -0.11 -0.02 0.29 0.15 0.28

(10)

bare land and harvested cultivated land were covered with high temperature in the suburban 2. At the edges of suburban 2 area were partly rural area and can be found wider vegetation area and cultivated land. So, the NDVI value was higher than the downtown and suburban 1.

Conclusion

In this paper, an attempt has been investigated to spatial variation and relationship among LULC and LST over the downtown, suburban 1 and suburban 2 of Yangon city area. The result showed that LST over the built up area, cultivated land and bare land exhibited the highest value while this value was minimum over the river and stream, and lake and pond. Total average LST was found downtown (35.11˚C) > suburban 1 (33.8˚C) > suburban 2 (33.69˚C). As a results, the comparison of the different average LST in downtown area was more than suburban 1 (1.31˚C) and suburban 2 (1.42˚C). In addition, the GIS-based and statistical analysis revealed that LST and NDVI exhibited a strong negative correlation. The average LST and NDVI value can be found the inverse direction for all LULC types. The results of correlation coefficient between LST and NDVI ranged for downtown (0.8707) > suburban 1 (0.7526) > suburban 2 (0.6923).

This study can be proved that one such impact was affected on the fluctuation of land surface temperature due to the dynamic LULC categories. Moreover, the rapid alteration of LULC has profound impacts on the human and natural environments. Facing the many challenges of population exploration and land use transformation under the rapid urbanization is creating extreme changes in land use that result in unintended environmental, economic, and social consequences for downtown and suburban areas. This paper was noted that, the Landsat 8 OLI data has provided useful information for the different variation and relationship between LULC, LST and NDVI. Thus, in future work the combination of in situ data of satellite image’

dataset should be beneficial to understand the process and mechanism of LST with LULC.

References

Artis, D.A. and W.H. Carnahan, 1982. Survey of Fig. 8. Scatter plot of linear regression analysis between LST

and NDVI value associate of (a) Downtown, (b)

Suburban 1 and (c) Suburban 2.

(11)

emissivity variability in the thermography of urban areas, Remote sensing of Environment, 12(4): 313-329.

Amiri, R., Q. Weng, A. Alimohammadi, and A.K.

Alavipanah, 2009. Spatial-temporal dynamics of land surface temperature in relation to fractional vegetation cover and land use/ cover in the Tabriz urban area, Iran, Remote sensing of Environment, 113(12): 2606-2617.

Braimoh, A.K. and T. Onishi, 2007. Geostatistical techniques for incorporating spatial correlation into land use change models, International journal of Applied Earth Observation and Geoformation, 9(4): 438-446.

Carlson, N. T. and A.R. David, 1997. On the relation between NDVI, fractional vegetation cover, and leaf area index, Remote sensing of Environment, 62(3): 241-252.

Cortes, C. and V. Vapnik, 1995. Support-vector networks, Machine learning, 20(3): 273-297.

Dewan, A.M. and Y. Yamaguchi, 2009. Land use and land cover change in Grater Dhaka, Bangladesh: Using remote sensing to promote sustainable urbanization, Applied Geography, 29(3): 390-401.

Gallo, K.P. and T.W. Owen, 1998. Satellite -based adjustments for the urban heat island temperature bias, Journal of Apply Meteorology, 38(6): 806-813.

Hathout, S., 2002. The use of GIS for monitoring and predicting urban growth in East and West St Paul, Winnipeg, Manitoba, Canada, Journal of Environmental Management, 66(3): 229-238.

Huang, C., L.S. Davis, and J.R.G. Townshend, 2002.

An assessment of support vector machines for land cover classification, International Journal of remote sensing, 23(4): 725-749.

Jones, P.D., P.Y. Groisman, M. Coughlan, N. Plummer, W. Wang, and T.R. Karl, 1990. Assessment of urbanization effects in time series of surface air

temperature over land, Nature, 347(6289): 169- 172.

Myint, S.W. and L. Wang, 2006. Multicriteria decision approach for land use land cover change using Markov chain analysis and a cellular automata approach, Canadian of Remote Sensing, 32(6):

390-404.

Li, F., Jackson, T. J., Kustas, W. P., Schmugge, T. J., French, A. N., Cosh, M. H., and R. Bindlish, 2004. Deriving land surface temperature from Landsat 5 and 7 during SMEX02/SMACEX, Remote sensing of environment, 92(4): 521- 534.

Li, J., X.R. Wang, W.C. Ma, and H. Zhang, 2009.

Remote sensing evaluation of urban heat island and its spatial pattern of the Shanghai metropolitan, China, Ecological Complexity, 6(4): 413-420.

Markham, B.L. and J.L. Barker, 1985. Spectral characterization of the Landsat Thematic Mapper sensors, International Journal of Remote Sensing, 6(5): 697-716.

Sobrino, J.A. and M. Romaguera, 2004. Land Surface Temperature retrieval from MSG1-SEVIRI data, Remote Sensing of Environment, 92(2):

247-254.

Streutker, D.R., 2003. Satellite-measured growth of the urban heat island of Houston, Texas, Remote Sensing Environment, 85(3): 282-289.

Thinh, N. X., G. Arlt, B. Heber, J. Hennersdorf, and I. Lehmann, 2002. Evaluation of urban land- use structures with a view to sustainable development, Environmental Impact Assessment Review, 22(5): 475-492.

Thome, A. C. G., 2012. Svm classifiers-concepts and applications to character recognition, INTECH Open Access Publisher.

Turner, B.L., 1994. Local faces, global flowers: the role

of land use and land use changes in Datong

basin, China, Environmental Geology, 5(2):

(12)

1825-1837.

Voogt, J.A. and T.R. Oke, 1998. Effects of urban surface geometry on remotely-sensed surface temperature, International Journal of Remote Sensing, 19(5): 895-920.

Weng, Q., 2003. Fractal analysis of satellite-detected urban heat island effect, Photogramm Engineering Remote Sensing, 69(5): 555-556.

Weng, Q., D. Lu, and J. Schubring, 2004. Relations between NDVI and tree productivity in the central Great Plains, International Journal of Remote Sensing of Environment, 25(16): 3127- 3138

Weng, Q., 2009. Thermal infrared remote sensing for urban climate and environmental studies:

Methods, applications, and trends, ISPRS Journal of Photogrammetry Remote Sensing, 64(4): 335-344.

Xiaolu, Z. and W. YC, 2011. Dynamics of Land Surface Temperature in response to Land- use/cover Change, Geographical Research, 49(1): 23-36.

Xian, G. and M. Crane, 2005. Assessments of urban

growth in the Tampa Bay watershed using

remote sensing data, Remote Sensing of

Environment, 97(2): 203-215.

수치

Fig. 1.  Location of Study Area.
Table 1.  Image Metadata in this study Scene _ ID  “LC81320482015089LGN00”
Table 2.  Description of Land use and Land cover class
Table 3.  The percentage of LULC for Yangon Area
+4

참조

관련 문서

• 이명의 치료에 대한 매커니즘과 디지털 음향 기술에 대한 상업적으로의 급속한 발전으로 인해 치료 옵션은 증가했 지만, 선택 가이드 라인은 거의 없음.. •

 depends on the size and shape of the drainage area, type of surface, slope of the drainage area,. rainfall intensity, and whether the flow is entirely over land

 Students needing additional information about grading policies and procedures should meet with their faculty advisor, Executive Director/Chairperson or a

Basic aspects of AUTOSAR architecture and methodology Safety mechanisms supported by AUTOSAR.. Technical safety concepts supported by AUTOSAR Relationship to ISO

GDP impact of COVID-19 spread, public health response, and economic policies. Virus spread and public

Agricultural Value Chain Development in Practice; Private Sector-Led Smallholder Development.. Land Rights and Land Conflicts in Africa: A Review of issues

The goal of this paper is to study curriculum and management status of Arts and Culture Education Instructors focused on Korean music among the

Micro- and nano-sized pores were formed on the surface of the alloy using PEO and anodization methods, and the pore shape change according to the Zr