기후협정후의 배출감소와 환경변화이행에 관한 연구
1)김 경 우*
The Study on the Global Emission Reduction Commitments and Environment Change After Climate
Agreement
Kyung-Woo Kim*
요 약
지구 기후 변화 정책에 대한 논쟁의 대부분은 그들의 정치적 호소에 대한 초점을 맞추고 있지만, 이 논문은 계약 의 약속이 보다 효율적임을 제기한다. 이 목표에 부합하는 기후 정책은 상당한 배출 감축을 목표로 한다. 이러한 시 나리오가 지구 평균 기온의 증가를 제한한다. 21세기 중반까지 2010에 비해 40~70%에 의해 세계 온실 가스 배출 량을 낮추겠다는 의미이며, 대기로부터 이산화탄소를 제거할 수 있다는 결론에 이른다. 이 논문은 환경과 개발 (UNCED)에 관한 유엔 회의 자료를 분석하여 이러한 비교를 제공한다. 분석내용은 결론적으로 각 나라들이 협정에 서 제시한대로 배출오염 물질을 줄이는데 이행하고 지구 온난화의 지속적인 발전방안이 요구되는 협력체계가 중요 하다는 것을 확인하였다.
▸Keywords : 기후변화, UNCED, 기후변화이행, 코펜하겐, 교토의정서, UNFCCC, 배출목표
Abstract
Although most of the debate on global climate change policy has focused on quantity controls due to their political appeal, this paper argues that agreement commitment are more efficient. Scenarios show that to have a likely chance of limiting the increase in global mean temperature to two degrees Celsius, means lowering global greenhouse gas emissions by 40 to 70 percent compared with 2010 by mid-century, and to near-zero by the end of this century. Ambitious mitigation may even require removing carbon dioxide from the atmosphere. This paper emphasizes on global cooperation which is a key for preventing global warming and toward sustainable development, and fair emission reduction targets among countries
∙제1저자 : 김 경우
∙투고일: 2014. 10. 8, 심사일: 2014. 11. 5, 게재확정일: 2014. 12. 6.
* 을지대학교 중독재활복지학과 (Dept. of Addiction Rehabilitation with Social Welfare)
are significant for achieving emission reductions.
▸Keywords : Climate change, UNCED, commitment on Climate Change, Copenhagen, Kyoto Protocol, UNFCCC, Emissions Targets
I. Introduction
Global warming and the greenhouse effect are issues discussed by scientists all the time. A natural process that keeps earths temperature at a livable rate is called the greenhouse effect. The energy from the sun warms up the earth when the rays from the sun are absorbed by greenhouse gasses. The gases then become trapped in the atmosphere. Carbon dioxide, water vapor, methane and nitrous oxide are the most common greenhouse gasses. Greenhouse gases cause the radiant heat of the sun to be trapped in the earth lower atmosphere which causes global warming. If there weren’t any greenhouse gasses, the earth would be really cold due to very little sun rays being absorbed on the earth. Global warming can and will lead to several problems that affect the environment in which we humans live in.
These problems can lead to warmer temperatures all around the world, it can endanger animals and the wildlife, and it can lead to widespread flooding from the glaciers melting. Here are a few more future effects that I will discuss in more detail about.
Damage to human health, Severe stress on forests, wetlands, and other natural habitats, how fish will be affected. Global warming is a serious problem that will affect our generation when we are older.
In talking about global warming, we need to learn what causes the greenhouse effect.
This paper provides such comparison by analysing
United Nations Conference on Environment and Development (UNCED). We show how different formulations make the same targets appear quite different in stringency, and we estimate and compare the likely economic and environmental performance of major emitters' Conference on Climate Change targets, especially hereafter Copenhagen and Cancún protocol.
We argue that this paper emphasized on the economic social consequences of each target depend importantly on a number of factors of advanced countries.
II. Related Works & Discussion
Surface records show global average temperature continuing to rise during the last half century.
Natural warming and cooling cycles are also evident.
The Talyor presents the complex relationship that developing countries develop a competitive advantage attracting pollution- intensity industry and become developed countries pollution heaven.
Birdsall and Wheeler support foreign direct
investment brings about enhanced environmental
welfare through transfer of eco-friendly products and
production processes. Grossman and Krueger
support first decomposed the environmental
outcomes of the NAFTA into three effects: scale
effect, composition effect, technique effect. We show
how different formulations make the same targets
appear quite different in stringency, and we
estimate and compare the likely economic and
environmental performance of major emitters' Conference on Climate Change targets. This article focuses on the comparatively role of the developing countries including economics and of the global community in climate protocol about agreement commitments' responses. [1]
1.UN conference
The United Nations Framework Convention on Climate Change (UNFCCC) was opened for signature at the 1992 United Nations Conference on Environment and Development (UNCED) in Rio de Janeiro On 12 June 1992, 154 nations signed the UNFCCC, that upon ratification committed signatories' governments to reduce atmospheric concentrations of greenhouse gases with the goal of
"preventing dangerous anthropogenic interference with earth's climate system".
The extent to which developing country Parties will effectively implement their commitments under the Convention will depend on the effective implementation by developed country Parties of their commitments under the Convention related to financial resources and transfer of technology and will take fully into account that economic and social development and poverty eradication are the first and overriding priorities of the developing country Parties.
2. Negotiations Protocol
The Framework Convention specifies the aim of developed (Annex I) Parties stabilizing their greenhouse gas emissions .
Later negotiations Kyoto Protocol After the signing of the UNFCCC treaty, Parties to the UNFCCC have met at conferences to discuss how to achieve the treaty's aims. At the 1st Conference of the Parties , Parties decided that the aim of Annex I Parties stabilizing their emissions at 1990 levels by the year 2000 was "not adequate", and further discussions at later conferences led to the Kyoto Protocol. The Kyoto Protocol sets emissions targets
for developed countries which are binding under international law.
The Kyoto Protocol has had two commitment periods, the first of which lasts from 2005-2012, and the second 2012-2020. The US has not ratified the Kyoto Protocol. The Kyoto Protocol has been ratified by all the other Annex I Parties.[1]
As well as the Kyoto Protocol, parties to the Convention have agreed to further commitments.
These include the Bali Action Plan (2007), the Copenhagen Accord (2009), the Cancún agreements (2010), and the Durban Platform for Enhanced Action (2012).
Copenhagen and Cancún As part of the 2009 Copenhagen negotiations, a number of countries produced the Copenhagen Accord. The Accord states that global warming should be limited to below 2.0
°C (3.6 °F). This may be strengthened in 2015 with a target to limit warming to below 1.5 °C. The Accord does not specify what the baseline is for these temperature targets (e.g. relative to pre-industrial or 1990 temperatures). According to the UNFCCC, these targets are relative to pre-industrial temperatures. [2]
114 countries have agreed to the Accord. The UNFCCC secretariat notes that "Some Parties stated in their communications to the secretariat specific understandings on the nature of the Accord and related matters, based on which they have agreed to the Accord." The Accord was not formally adopted by the Conference of the Parties. Instead, the COP
"took note of the Copenhagen Accord." [3]
Many aspects of the Copenhagen Accord were
brought into the formal UNFCCC process as part of
the Cancún agreements. The Cancún agreements
were adopted by the COP in 2010. The agreement
states that global warming should be limited to
below 2.0 °C (3.6 °F) relative to the pre-industrial
level. This target may be strengthened "on the basis
of the best available scientific knowledge, including in relation to a global average temperature rise of 1.5 °C".[4]
As part of the Cancún agreements, developed and developing countries have submitted mitigation plans to the UNFCCC. These plans are compiled with those made as part of the Bali Action Plan.
Durban and Doha in 2011, parties adopted the
"Durban Platform for Enhanced Action". As part of the Durban Platform, parties have agreed to
"develop a protocol, another legal instrument or an agreed outcome with legal force under the Convention applicable to all Parties". This new treaty is due to be adopted at the 21st COP, and implemented in 2020. The 21st COP is scheduled to held in 2015.
Human activities have had a number of effects on the climate system. Global GHG emissions due to human activities have grown since pre-industrial times. Warming of the climate system has been observed, as indicated by increases in average air and ocean temperatures, widespread melting of snow and ice cover, and rising global average sea level. As assessed by the Intergovernmental Panel on Climate Change (IPCC), "most of the observed increase in global average temperatures since the mid-20th century is very likely due to the observed increase in anthropogenic GHG concentrations". "Very likely"
here is defined by the IPCC as having a likelihood of greater than 90%, based on expert judgement.[5]
The future levels of GHG emissions are highly uncertain. In 2010, the United Nations Environment Programme (UNEP) published a report on the voluntary emissions reduction pledges made as part of the Copenhagen Accord. As part of their assessment, UNEP looked at possible emissions out until the end of the 21st century, and estimated associated changes in global mean temperature.: A range of emissions projections suggested a
temperature increase of between 2.5 to 5 °C before the end of the 21st century, relative to pre-industrial temperature levels. The lower end temperature estimate is associated with fairly stringent controls on emissions after 2020, while the higher end is associated with weaker controls on emissions. [6]
Graphical description of risks and impacts of climate change by the IPCC, published in 2001. A revision of this figure by Smith and others shows increased risks. Future climate change will have a range of beneficial and adverse effects on human society and the environment. The larger the changes in climate, the more adverse effects will predominate . The IPCC has informed the UNFCCC process in determining what constitutes "dangerous" human interference of the climate system. Their conclusion is that such a determination involves value judgements, and will vary among different regions of the world.[7]
All relevant GHGs need to be considered if
atmospheric GHGs concentrations are to be
stabilized. Human activities result in the emission of
four principal GHGs: carbon dioxide (chemical
formula: CO2), methane (CH4), nitrous oxide (N2O)
and the halo carbons (a group of gases containing
fluorine, chlorine and bromine). Carbon dioxide is
the most important of the GHGs that human
activities release into the atmosphere. At present,
human activities are adding emissions of carbon
dioxide into the atmosphere far faster than they are
being removed. This is analogous to a flow of water
into a bathtub. So long as the tap runs water
(analogous to the emission of carbon dioxide) into
the tub faster than water escapes through the
plughole (the natural removal of carbon dioxide from
the atmosphere), then the level of water in the tub
(analogous to the concentration of carbon dioxide in
the atmosphere) will continue to rise. To stabilize
the atmospheric concentration of carbon dioxide at a
constant level, emissions would essentially need to be completely eliminated. It is estimated that reducing carbon dioxide emissions 100% below their present level would lead to a slow decrease in the atmospheric concentration of CO2 by 40 parts per million (ppm) over the 21st century. [9]
Ⅲ.Countries' Base of Accord Commitment
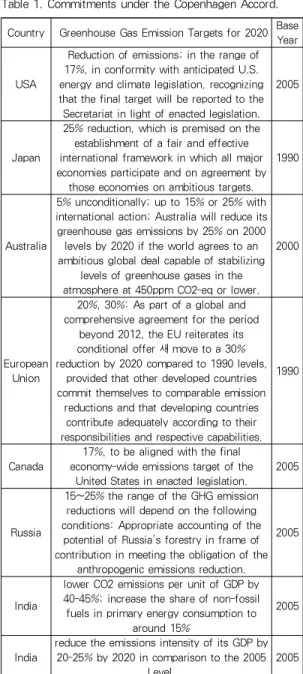
The materials are the commitments of some of the largest emitters as they were reported to the UNFCCC. As might be expected given that the Accord is not a legally binding document, these commitments are different in several ways from the commitments by Parties to the Kyoto Protocol. For example, the Accord targets refer only to a single years' emissions, 2020, whereas the Kyoto Protocol capped total emissions over a five year period. The accord makes no mention of the paths of emissions from 2013, the first year after the Kyoto Protocol compliance period, through 2019. The Accord is also silent about the degree to which targets would be met domestically or through emissions trading or international offsets.
As Table 1 reports, some Accord participants offered ranges of emissions targets, with more stringent levels being contingent on other countries' actions or the enactment of domestic legislation. And while the Kyoto targets are predominantly percentage reductions in emissions relative to levels, averaged over 2008 to 2012, the base years of emissions reduction targets in the Copenhagen Accord differ across participants. The U.S. and Canada both promised reductions of 17% relative to 2005 levels, while the E.U., Russia, and Japan chose a base year of 1990. Australia opted for 2000.
[10]
Country Greenhouse Gas Emission Targets for 2020 Base Year USA
Reduction of emissions; in the range of 17%, in conformity with anticipated U.S.
energy and climate legislation, recognizing that the final target will be reported to the Secretariat in light of enacted legislation.
2005
Japan
25% reduction, which is premised on the establishment of a fair and effective international framework in which all major economies participate and on agreement by
those economies on ambitious targets.
1990
Australia
5% unconditionally; up to 15% or 25% with international action; Australia will reduce its greenhouse gas emissions by 25% on 2000 levels by 2020 if the world agrees to an ambitious global deal capable of stabilizing
levels of greenhouse gases in the atmosphere at 450ppm CO2-eq or lower.
2000
European Union
20%, 30%: As part of a global and comprehensive agreement for the period
beyond 2012, the EU reiterates its conditional offer 새 move to a 30%
reduction by 2020 compared to 1990 levels, provided that other developed countries commit themselves to comparable emission
reductions and that developing countries contribute adequately according to their responsibilities and respective capabilities.
1990
Canada
17%, to be aligned with the final economy-wide emissions target of the
United States in enacted legislation. 2005
Russia
15~25% the range of the GHG emission reductions will depend on the following conditions: Appropriate accounting of the
potential of Russia's forestry in frame of contribution in meeting the obligation of the
anthropogenic emissions reduction.
2005
India
lower CO2 emissions per unit of GDP by 40-45%; increase the share of non-fossil fuels in primary energy consumption to
around 15%
2005
India
reduce the emissions intensity of its GDP by 20-25% by 2020 in comparison to the 2005
Level. 2005
Table 1. Commitments under the Copenhagen Accord.
Notably, unlike under the Kyoto Protocol, some
major developing countries made economy-wide
emissions commitments in the Accord. In particular,
China and India committed to reducing by 40 and 20
percent reductions respectively their emissions per
unit of GDP. This approach is consistent with many
developing countries' longstanding opposition to
hard emissions limits on the grounds that limits on emissions levels could impose inadvertently stringent constraints given these countries' potentially large but uncertain economic growth.
Ⅳ. Modelling Approach Scenario
In the baseline, no country adopts an economy-wide price on carbon through 2050.
Although some countries in the model have commitments under the Kyoto Protocol, most do not currently have an economy-wide price on carbon, with the European Union a notable exception. [11]
Kyoto Protocol participants may or may not actually achieve their targets, and those that do such as Russia may do so without strong policy measures.
1. The Policy Scenario
We assume the real price on carbon dioxide each country rises at four percent each year after 2012 through 2050 or until emissions fall to nearly zero, whichever comes first. When emissions fall to nearly zero, we hold the carbon price constant thereafter.[12] We solve for the initial price on carbon in 2012 in each country that it hits its target for 2020 as set out in Table 2.
Reduction
Percent In Emissions Relative To
USA 17 Level 2005
JAPAN 25 Level 1990
Australia 5 Level 2000
Europe 20 Level 1990
ROECD 17 Level 2005
China 40 Per Unit ODP 2005
India 20 Per Unit ODP 2005
EEFSU 28 Level 1990
Table 2. Emissions Targets for 2020 for the Policy Scenario
We assume the price signal and emissions targets in the policy scenario apply only to Co2 from fossil fuel consumption from the energy sector, including combustion of coal, natural gas, and oil. For
example, if the target specifies a reduction of 17 percent below 2005 emissions levels by 2020, then we compute a scenario in which CO2 emissions from the energy sector in 2020 are 17percent lower than emissions from those same sources in 2005.
2. Emissions Levels
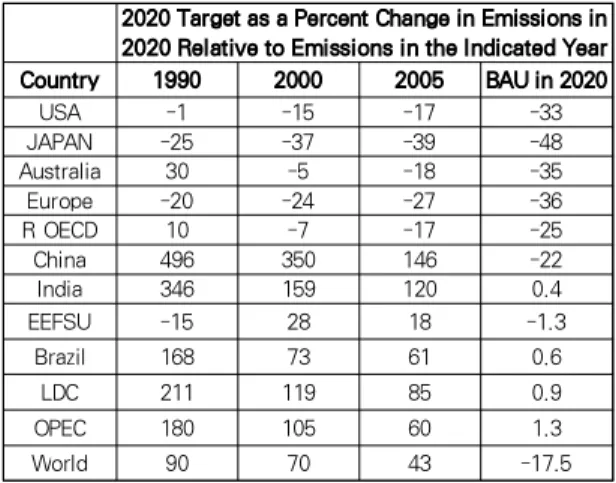
Using the baseline and policy scenarios described, we can convert the disparate targets under the Accord into common formulations. Table 3 reports the Copenhagen Accord emission commitments for 2020 in common historical base years(1900, 2000, and 2005) and relative to emissions in the 2020 baseline scenario, or business as usual(BAU) emissions. For China and India, commitments are reported using the emissions levels in 2020 that produces the targeted reductions in emissions per unit real GDP.
2020 Target as a Percent Change in Emissions in 2020 Relative to Emissions in the Indicated Year
Country 1990 2000 2005 BAU in 2020
USA -1 -15 -17 -33
JAPAN -25 -37 -39 -48
Australia 30 -5 -18 -35
Europe -20 -24 -27 -36
R OECD 10 -7 -17 -25
China 496 350 146 -22
India 346 159 120 0.4
EEFSU -15 28 18 -1.3
Brazil 168 73 61 0.6
LDC 211 119 85 0.9
OPEC 180 105 60 1.3
World 90 70 43 -17.5
Table 3. Emissions in 2020 that Result from Copenhagen Accord
Target reveals how the formula for the target
affects its apparent stringency. In particular, it
shows how reductions relative to historical base
years bear little relation to reductions relative to
business as usual. For example, the model suggests
that China's emissions goal under the Accord
implies a nearly five-fold increase in emissions
relative to 1990 levels, but the target emissions in
Copenhagen Accord still represents 22 percents departure from Chinese baseline emissions in 2020, nearly as ambitious as the 25 percent reductions from baseline by the OECD countries. EEFSU's 15 percent reduction relative to 1990 levels represents about a one percent decline relative to BAU.
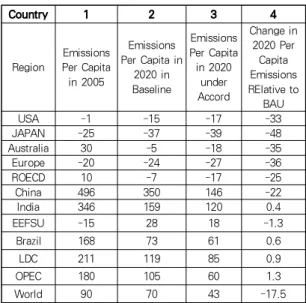
3. Other Measures of Emissions Reduction
Table 4 shows the as the emissions commitments from Table expressed in per capita terms. This table reveals that on a per capita basis, Japan will lower its emissions per capita relative to baseline the most, by 48 percents.
Country 1 2 3 4
Region
Emissions Per Capita in 2005
Emissions Per Capita in
2020 in Baseline
Emissions Per Capita in 2020
under Accord
Change in 2020 Per
Capita Emissions RElative to
BAU
USA -1 -15 -17 -33
JAPAN -25 -37 -39 -48
Australia 30 -5 -18 -35
Europe -20 -24 -27 -36
ROECD 10 -7 -17 -25
China 496 350 146 -22
India 346 159 120 0.4
EEFSU -15 28 18 -1.3
Brazil 168 73 61 0.6
LDC 211 119 85 0.9
OPEC 180 105 60 1.3
World 90 70 43 -17.5
Table 4. Copenhagen Accord Emissions Commitments in Per Capita Terms
Table 5 shows the effect of the Accord on the discounted present value of consumption.[13] The results parallel the changes in 2020 consumption but are lower in magnitude for the same reason that cumulative changes in emissions are lower than 2020 changes: the policies are phased in gradually over time. A concise comparison of the economic effects of the Accord. [14]
In Korea, without introduction of new technologies, economic loss from greenhouse gas reduction is likely to be highly significant.
Introduction of new technologies, without government support, greatly reduces abatement costs and GDP loss. Government support for technological development makes Green Growth more likely to succeed. banking and borrowing allows more cost effective approach the reduction target. It needs to set up robust support programs and institutional foundation to promote technological innovation and commercialization. A lack of economic feasibility hinders commercialization of newly developed technologies. Further strength of regulations on greenhouse gases will enhance incentives to invest and commercialize new technologies by increasing prices of fossil fuels. the Cou
ntry 1 2 3 4
Regi on
Economy wide 2012 price per
ton CO2 (S2010)
Economy wide 2020 price per
ton CO2 (S2010)
Percent change
in 2020 GDP relative to BAU
Percent change in 2020 consum ptios a relative to BAU
Percent change in discounted cumulative consumption(
2012-2020) relative to
BAU
USA $28.09 $38.44 -2.7 0.0 0.9
Table 5. Economic Outcomes of Copenhagen Accord
JAP
AN $50.36 $68.92 -5.1 -3.1 -2.0
Austr
alia $15.91 $21.78 -6.3 -2.0 -1.4
W.E urop
e $50.76 $77.68 -4.9 -3.1 -1.8
ROE
CD $18.06 $24.72 -5.6 -3.9 -3.0
Chin
a $15.22 $20.82 -3.7 -4.5 -2.8
India $1.02 $1.40 0.7 1.6 2.3
EEFS
U $0.95 $1.30 -2.9 -3.4 -2.6
Brazi
l $6.02 $4.00 -0.4 -0.5 -0.1
LDC $2.07 $2.02 -0.6 -0.5 0.2
OPE
C $1.12 $1.02 -5.9 -13.2 -12.1
Worl
d $1.02 $1.02 -3.2 -2.1 -1.0
banking and borrowing in the amount of reduction should be less today and more tomorrow as marginal abatement cost decreases over time.
Finally, the advantages and disadvantages and value of the paper product as follows;
In comparative analysis from Copenhagen Accord to other agreement, what it mostly seems to commit them to is a future commitment. For instance, promising points says the countries must establish or renew “an existing GHG (greenhouse gases) emissions reduction target for both the near term i.e., by 2020 or sooner and long term (e.g., 80%
reductions by 2050).” [15] Notice it doesn’t actually commit them to the “80 percent” pledge that New York just made that’s just an “e.g.” Nor is there any hard deadline for making such a pledge. [16]
Toward the end of the document, they’ll “work toward November 2015 as the target date” — softball language that hardly suggests grave consequences if they don’t come through.
Global cooperation is a key for preventing global warming and toward sustainable development, and fair emission reduction targets among countries are significant for achieving emission reductions.
There are large differences among countries.
Many international frameworks, different types of emission reduction targets, and different types of policies will be needed for really effective emission reductions.
Both improvements of global warming mitigation technologies and increase in environment conscious behavior are important for compatibility of environment and economic growth.
Models are powerful tools, but not prediction tools. Well understanding them is important for policy making.
Comparisons for sustainable mitigation actions were not suggested, and so balanced mitigation efforts among countries will be needed. Mitigation cost is one of the indicators particularly among developed countries.
Ⅴ. Conclusion
This article reviews the options for future international climate change outcomes after the International protocol conference. It argues that a major reassessment of the current approach to building a climate regime is required. This approach, which we refer to as the ‘global deal’ strategy, is predicated on the idea of negotiating a comprehensive, universal and legally binding treaty that prescribes, in a top-down fashion, generally applicable policies based on previously agreed principles. The Copenhagen Accord marked the beginning of a new approach to international climate agreements. Previously each round of negotiations generally adopted a fixed base year against which emissions commitments were to be measured and participating countries then negotiated a set of reductions relative to emissions in that year. The Accord breaks away from that approach by allowing each country to choose its own base year and to express its commitment in terms other than absolutes reduction in emissions. This flexibility promoted consensus and allowed an agreement to be reached. At the same time, however, it complicates comparing the emissions reductions and economic efforts implicit in the commitments made by the participants. In this paper, we have provides such a comparison using G-Cubed model of the global economy. The results show that alternative ways of expressing a commitment can make a single set of targets appear strikingly different in stringency.
Moreover, we show that the actual stringency of the
Accord, as measured by either GDP or consumption
loss relative to a reference case, differs sharply
across countries. This is because the economic
consequences of each target depend importantly on a
number of factors; the extent to which
carbon-intensive energy sources are a critical part of
the energy system in 2020. In both cases renewable
energy makes up a small proportion of their
proposed 2020 energy structures. The conclusion discusses in depth concerns about nuclear power policy, energy efficiency, energy consumption strategy and problems in developing renewable energy.
Finally, we also find that many countries the domestic price on carbon is a poor predictor of the welfare implications of the overall agreement. On the other hand, OPEC has no price on carbon and experiences profound consumption losses because other countries are taxing OPEC exports and reducing global demand for these goods. The effect on OPEC suggests it would have an incentive to raise world fuel prices rather than suffer a large loss in terms of trade.
References
[1] Andrew Allan and Marton Kruppa (10 December 2012), " Belarus negotiator hints at Kyoto exit, says others could follow ", REUTERS (Reuters), retrieved 2012.
[2] IPCC SAR WG3, Bruce, J. P.; Lee, H.; and Haites, E. F., ed., Climate Change 1995:
Economic and Social Dimensions of Climate Change (PDF), Cambridge University Press, 2013.
[3] King, D., et al, International climate change negotiations: Key lessons and next steps, Oxford, UK: Smith School of Enterprise and the Environment, University of Oxford, 2011.
[4] UNFCCC, Information provided by Annex I Parties relating to Appendix I of the Copenhagen Accord (quantified economy-wide emissions targets for 2020), 2011.
[5] UNFCCC, FCCC/AWGLCA/2011/INF.1:
Compilation of information on nationally appropriate mitigation actions to be implemented by Parties not included in Annex I to the Convention, Geneva, Switzerland: UN Office, 2011.
[6] UNFCCC (United Nation Framework Convention
on Climate Change). Kyoto Protocol. United Nation, 2010
[7] Integovernmental Panel on Climate Change.
Print version: Cambridge University Press, Cambridge, U.K., and New York, N.Y., U.S.A..
This version: IPCC website. Retrieved 2011.
[8] Intergovernmental Panel on Climate Change .
"5.2 Key vulnerabilities, impacts and risks – long-term perspectives". In Core Writing Team, Pachauri, 2007.
[9] R.K and Reisinger, A. (eds.). Synthesis Report.
Climate Change 2007: Synthesis Report.
Contribution of Working Groups I, II and III to the Fourth Assessment Report of the Intergovernmental Panel on Climate Change.
Print version: IPCC, Geneva, Switzerland. This version: IPCC website. Retrieved 2011.
[10] Intergovernmental Panel on Climate Change
"The long-term perspective" . In Core Writing Team, Pachauri, R.K and Reisinger, A. (eds.), 2007.
[11] Sterman, J.D. and L.B. Sweeney,
"Understanding public complacency about climate change: adults' mental models of climate change violate conservation of matter" , Climatic Change, 2007.
[12] UNFCCC. Conference of the Parties serving as the meeting of the Parties to the Kyoto Protocol (CMP) , Outcome of the work of the Ad Hoc Working Group on Further Commitments for Annex I Parties under the Kyoto Protocol. Draft decision proposed by the President (EN), 2012.
[13] "U.N. Global Warming Summit: Heading Over the Climate Cliff" . Time. 27 November 2012.
[14] Goldemberg, J.,et al., "Scope of the Assessment:
1.4.1 General issues: Benchmarks" , in IPCC SAR WG3 2006, pp. 32–33 (pp.38–39 of PDF), 2010.
[15] Nagendra P. Shrestha, "Assessment of Environmental Burden od Indusreies" : An Input Outpit Analysis . Climatic Change, 2013.
[16] Ferenc L. Toth, "Modeling National Mitigation
Scenarios with the IAEA Energy Supply Model" ,
International Atomic Energy Agency, 2014.
저 자 소 개 김 경우 1988: 국민대학교
행정학과 행정학석사 1991: 국민대학교
행정학과 행정학박사 1992: 서울보건대학
사무자동학과 교수 현재: 을지대학교
중독재활복지학과 교수 관심분야: 복지정보시스템 Email : [email protected]