Impact of Obesity on Metabolic Syndrome among Adolescents as Compared with Adults in Korea
Soo Jeong Kim,
1Jakyoung Lee,
2Chung Mo Nam,
3and Soon Young Lee
41Department of Occupational and Environmental Medicine, Ajou University School of Medicine, Suwon;
2Department of Health Promotion, Graduate School of Public Health, Yonsei University, Seoul;
3Department of Preventive Medicine, Yonsei University College of Medicine, Seoul;
4Department of Preventive Medicine and Public Health, Ajou University School of Medicine, Suwon, Korea.
Received: September 2, 2009 Revised: December 6, 2010 Accepted: December 8, 2010
Corresponding author: Dr. Soon Young Lee, Department of Preventive Medicine and Public Health, Ajou University School of Medicine,
San 5, Woncheon-dong, Yeongtong-gu, Suwon 443-721, Korea.
Tel: 82-31-219-5301, Fax: 82-31-219-5084 E-mail: [email protected]
∙ The authors have no financial conflicts of interest.
© Copyright:
Yonsei University College of Medicine 2011 This is an Open Access article distributed under the terms of the Creative Commons Attribution Non- Commercial License (http://creativecommons.org/
licenses/by-nc/3.0) which permits unrestricted non- commercial use, distribution, and reproduction in any medium, provided the original work is properly cited.
Purpose: This study aimed to estimate the prevalence of metabolic syndrome (MetS) in adolescents and adults and to compare the impact of body mass index (BMI) on MetS between adolescents and adults in Korea. Materials and Meth- ods: Data were used from 6,186 subjects aged 10 years or more who representa- tively participated in the Third Korean National Health and Nutrition Examination Survey. Body composition, blood test, and health behavioral factors were mea- sured. We used the definition of MetS from the modified the National Cholesterol Education Program Adult Treatment Panel III (NCEP ATP III) for adolescents and the NCEP-ATP Ⅲ for adults. Results: The prevalence of MetS was 6.4 (95% CI 4.5-8.4) and 22.3 (95% CI 20.8-23.8) in adolescents and adults, respectively. The prevalence of MetS among normal, overweight and obese body types for both ad- olescents and adults differed significantly (p<0.001). After adjustment for covari- ates, the odds ratios (ORs) of obese and overweight body types on MetS compared with normal BMI in adolescents were 28.1 (95% CI 11.4-69.1) and 8.7 (95% CI 2.3- 33.1), respectively. The ORs of obesity on MetS were 32.0 (95% CI 7.5-136.9), 32.2 (95% CI 12.8-80.8), 16.2 (95% CI 9.4-27.9), 7.6 (95% CI 4.7-12.2) and 9.9 (95%
CI 6.8-14.6) for subjects in their 20’s, 30’s, 40’s, 50’s and older than 60, in order.
Conclusion: We found that the prevalence of MetS increased with age and was more prevalent in males. Moreover, the group younger than 39 years of age had a higher chance of having MetS than the group older than 40 years of age. Weight control is more vital in the earlier stages of life for the prevention and management of MetS.
Key Words: Obesity, metabolic syndrome X, prevalence, adolescents, adults
INTRODUCTION
Obesity is one of the major worldwide public health problems, affecting more than one billion people.1 For the past several decades, the prevalence of obesity in not only adults but also in children and adolescents has risen worldwide.2,3 Korea is no exception: there has been a rapid increase in obesity among children in this coun-
completed the health examination questionnaire and had full data from a medical exam were chosen for this study.
Measurements
Anthropological measures such as height, body weight, and waist circumference were measured for the health examina- tion. Height was measured to the nearest 0.1 cm on a stadi- ometer with the subject standing barefoot. Body weight was measured to the nearest 0.1 kg on a balanced scale while the subject wore a lightweight gown or underwear. Body mass index (BMI) (kg/m2) was calculated as weight (kg) divided by height squared (m2). Waist circumference was measured to the nearest 0.1 cm at the midpoint between the lowest rib and the uppermost lateral border of the right iliac crest. Sys- tolic (SBP) and diastolic blood pressures (DBP) were mea- sured with a standard mercury sphygmomanometer for each individual at a sitting position after resting for five min- utes. After measuring the first blood pressure of the right upper arm, the second and third blood pressures were mea- sured with 30 seconds intervals. The second and third read- ings each of SBP and DBP were recorded, and the average of each measurement was used for data analysis. Blood samples were obtained from an antecubital vein in the morn- ing after 12 hours of fasting, and analyzed at Seoul Clinical Laboratories. Fasting serum glucose, triglycerides, total cholesterol, and HDL-cholesterol were measured by the en- zyme method.
Criteria of metabolic syndrome, obesity and being overweight
We used the definition of MetS from the modified NCEP ATP III for adolescent proposed by Cook, et al.9 and the defi- nition from NCEP ATP III for Adults developed by Nation- al Cholesterol Education Program (Table 1).13 Those with at least three abnormalities among the five components were defined as having MetS.
The criteria for the waist circumference and BMI defined as obesity in adults was taken from the criteria of the Inter- national Association for the Study of Obesity and the Inter- national Obesity Task Force, which was developed for Asian populations.14 Obesity or being overweight in adolescents were defined as ≥95th percentile BMI or as ≥85th but <95th percentiles BMI, respectively, after being adjusted for age and gender. Normal adolescents were defined as BMI<85th percentile.15 The cut-off values for waist circumference and BMI percentiles in adolescents were based on the Korea Growth Charts by gender and age developed by the Korea try. The prevalence of obesity has risen 10.5-fold for boys
and 4.2-fold for girls aged 6-17 years since the 1980s.4 Regardless of age, obesity causes significant health risks.
Obese children and adolescents with cardiovascular disease risk factors such as hypertension, hypertriglycemia, low high- density lipoprotein (HDL) cholesterol, high fasting glucose levels and low cardio-respiratory fitness are more likely to develop Metabolic Syndrome (MetS) as adults.5,6 Additional medical complications caused by childhood obesity include an increased risk of metabolic syndrome, whose symptoms are obesity, impaired glucose tolerance, hypertension, dys- lipidemia, and/or a prothrombotic, inflammatory vascular environment, and which results in increased cardiovascular risk even in childhood.7
Because of the many different sets of criteria for MetS in both adolescents and adults,8 there have been incongruent results as to the prevalence of MetS.9,10 The most common- ly used definition for adolescents is that of Cook, et al., based on The National Cholesterol Education Program Adult Treatment Panel III (NCEP ATP III). Applying the definition of NCEP ATP III, the overall prevalence of MetS among Ko- rean adolescent aged 12-19 was reported to be 9.2% in 2001,11 which was higher than the 6.4% reported among U.S.
adolescents in the National Health and Nutrition Examina- tion Survey (NHANES) 1999-2000.6 Our study aimed first to show the linear trends of prevalence of MetS by obesity level from adolescent to adult age groups in Asia. Identifying the linear trends of MetS for adolescents and adults might al- low us to see the impact of obesity on MetS for each age group and to provide tips on the time of intervention.
The purpose of this study was to estimate the prevalence of MetS in adolescents and adults and to compare the im- pact of obesity on MetS between adolescents and adults.
MATERIALS AND METHODS
Subjects
The data for this study came from the Third Korean National Health and Nutrition Examination Survey (KNHANES Ⅲ), a national survey conducted in 2005 by the Korea Center for Disease Control and Prevention.12 KNHANES Ⅲ used a strat- ified, multistage probability sampling design. The data were collected from adolescents aged 10 to 19 years and adults aged 20 years or more. All participants were asked to sign a written consent form. Six thousand one hundred and eighty- six people [male 2,718 (43.9%); female 3,468 (56.1%)] who
in adults. The proportion of subjects with MetS among obese adolescents (95th percentile ≤BMI) and adults (25≤BMI) were higher (35.0% and 46.9%, respectively) than among those who were overweight or had a normal BMI in both ad- olescents and adults. The prevalence of MetS by BMI level for both adults and adolescents was statically significant (p<0.001). For adolescents, except for the high glucose com- ponent, each component by BMI was shown to be statisti- cally significant. The highest rates among the components of MetS among obese adolescents and adults were central obesity (60.7% for adolescents; 73.3% for adults) and low HDL (55.0% for adolescents; 65.2% for adults). Also, all components by BMI for adults were found to be statistically significant (p<0.001).
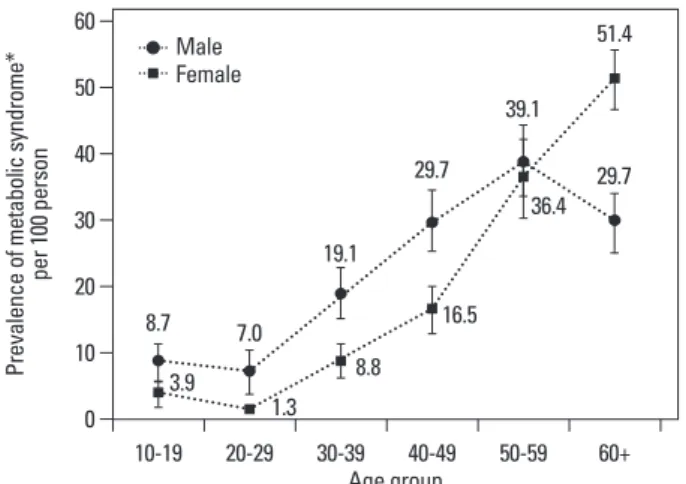
Fig. 1. showed the prevalence of MetS by gender and age group. All age groups showed a significant gender differ- ence except for the 50-59 age group; males had a higher prevalence than females for all age groups 10-49. On the oth- er hand, females had a higher prevalence in the 60 and above age group. There was no significant increase in MetS be- tween the 10-19 and 20-29 age groups among males and females. A rapid increase was observed in the 30-59 age group in both genders (8.8 and 19.1 in the 30s; 16.5 and 29.7 in the 40s; 36.4 and 39.1 in the 50s for females and males, re- spectively). On the other hand, in the 60 or more age group the trend differed with gender; the prevalence (51.4) was still higher in female but it decreased in males (29.7).
The ORs of obesity and being overweight in MetS in ad- olescents and adults are shown in Table 4. The ORs of obe- sity and being overweight with MetS compared with nor- mal BMI in adolescents were 28.1 (95% CI 11.4-69.1) and 8.7 (95% CI 2.3-33.1), respectively. The ORs of obesity in MetS were 32.0 (95% CI 7.5-136.9), 32.2 (95% CI 12.8- 80.8), 16.2 (95% CI 9.4-27.9), 7.6 (95% CI 4.7-12.2) and 9.9 (95% CI 6.8-14.6) for the 20’s, 30’s, 40’s and 50’s and the 60 Center for Disease Control and Prevention in 2005.16 The
cut-off points for high blood pressure were based on the systolic or diastolic blood pressure in the 90th percentile or above for age, gender, and height using the National Heart, Lung, and Blood Institutes in the US.17 The height percentile values for each child were based on Korea Growth Charts.
Statistical methods
Data were analyzed using SAS version 9.1. Sampling weights were used to estimate the representative data for Korean adolescents and adults. General and biomedical characteris- tics of the subjects including gender were processed by Sur- veymeans and Surveryfreq procedures. Continuous variables were presented as mean (standard error), and categorical variables were presented as a weighted percent (standard er- ror). The prevalence of MetS and its components by BMI in adolescents and adults were processed using the Surveyfreq procedure, and the Chi-Square test was used to examine the linear association between obesity status and the prevalence of MetS. The Surveylogistic procedure was conducted to an- alyze the magnitude of association between MetS and obe- sity by adjusting the covariates of age, gender, smoking, al- cohol drinking and physical activity. Statistical significance was estimated at alpha error 5%.
RESULTS
General and biochemical characteristics of the subjects were shown in Table 2. The prevalence of overweight and obese body types was 8.6% and 12.1% among adolescents, and increased to 24.7% and 31.5%, respectively, among adults aged 20 or older.
The prevalence of MetS by obesity is presented in Table 3.
The prevalence of MetS was 6.4% in adolescents and 22.3%
Table 1. Criteria for Metabolic Syndrome in Adolescents and Adults
Adolescents9 Adults
Waist circumference ≥90th percentile for age and gender16 >90 cm (Male)14
>80 cm (Female)
Triglyceride ≥110 mg/dL ≥150 mg/dL
HDL-cholesterol ≤40 mg/dL <40 mg/dL (Male)
<50 mg/dL (Female) Blood pressure ≥90th percentile for age, gender, height (<age 18 yr)17
≥130/85 mmHg
≥130/85 mmHg (≥age 18 yr)
Fasting glucose ≥110 mg/dL ≥110 mg/dL
HDL, high-density lipoprotein.
Table 2. General and Biochemical Characteristics of the Subjects
Characteristics Adolescents Adults
10-19 yrs
(n=931) 20-29 yrs
(n=660) 30-39 yrs
(n=1,188) 40-49 yrs
(n=1,296) 50-59 yrs
(n=876) 60+ yrs
(n=1,235) 20+ yrs (n=5,255) Gender (male, %) 52.7 (1.6) 50.8 (2.3) 51.1 (1.5) 51.0 (1.2) 50.1 (1.7) 42.1 (1.4) 49.4 (0.7)
Age (yrs) 13.9 (0.1) 25.0 (0.2) 34.5 (0.1) 44.4 (0.1) 54.4 (0.1) 68.7 (0.2) 43.4 (0.3)
Height (cm) 159.7 (0.4) 167.2 (0.4) 165.6 (0.3) 163.2 (0.2) 161.6 (0.3) 156.7 (0.3) 163.3 (0.2) Weight (kg) 53.6 (0.5) 63.2 (0.6) 64.6 (0.4) 64.5 (0.4) 64.3 (0.4) 58.8 (0.4) 63.2 (0.2) Body mass index (kg/m2) 20.7 (0.1) 22.5 (1.2) 23.4 (0.1) 24.1 (0.1) 24.6 (0.1) 23.9 (0.1) 23.6 (0.1) Obesity
Normal* 79.3 (1.5) 59.9 (2.3) 48.7 (1.8) 36.6 (1.6) 30.5 (1.8) 37.6 (1.8) 43.8 (0.4)
Overweight† 8.6 (0.9) 20.6 (1.8) 22.3 (1.5) 28.7 (1.5) 27.1 (1.5) 26.2 (1.3) 24.7 (0.6) Obesity‡ 12.1 (1.3) 19.6 (1.8) 29.1 (1.6) 34.7 (1.5) 42.4 (1.7) 36.2 (1.7) 31.5 (0.4) Waist circumference (cm) 69.6 (0.4) 76.0 (0.5) 79.2 (0.3) 81.7 (0.3) 84.9 (0.3) 84.1 (0.4) 80.7 (0.2) Systolic blood pressure
(mmHg) 106 (0.5) 110 (0.5) 111 (0.5) 117 (0.5) 125 (0.8) 133 (0.7) 118 (0.4)
Diastolic blood pressure
(mmHg) 68 (0.5) 73 (0.5) 75 (0.5) 79 (0.5) 82 (0.4) 79 (0.4) 77 (0.3)
Fasting blood glucose
(mg/dL) 87.5 (0.3) 85.2 (0.4) 89.6 (0.5) 96.4 (0.8) 100.5 (1.0) 101.3 (0.9) 93.8 (0.4)
Total cholesterol (mg/dL) 156.5 (1.0) 169.1 (1.5) 178.2 (1.2) 188.0 (1.1) 194.0 (1.5) 192.8 (1.3) 183.3 (0.7) Triglyceride (mg/dL) 90.1 (1.8) 99.8 (3.2) 123.7 (3.7) 147.0 (4.0) 160.1 (5.4) 143.8 (3.3) 132.6 (1.9) High-density lipoprotein
cholesterol (mg/dL) 44.3 (0.3) 47.1 (0.5) 45.1 (0.3) 44.6 (0.4) 43.7 (0.4) 43.9 (0.3) 45.0 (0.2) Current smoking (yes, %) 4.1 (0.7) 25.2 (2.1) 29.6 (1.7) 26.4 (1.4) 23.2 (1.5) 16.9 (1.3) 24.8 (0.7) Current alcohol intake (yes, %) 14.7 (1.5) 61.9 (2.4) 59.6 (1.8) 56.9 (1.6) 49.8 (2.1) 34.3 (1.7) 53.7 (1.0) Regular physical activity
(≥2/wk, %) 32.2 (2.1) 35.2 (2.3) 35.9 (1.7) 44.5 (1.7) 47.6 (2.2) 39.1 (2.1) 40.0 (1.0) Continuous variables presented as mean (standard error); Categorical variables presented as weighted percent (standard error).
*Cutoff ranges for normal body type were BMI<85th percentile in adolescents and BMI<23 in adults.
†Cutoff ranges for overweight body type were 85th percentile ≤BMI<95th percentile in adolescents and 23≤BMI<25 in adults.
‡Cutoff ranges for obesity were 95th percentile ≤BMI in adolescents and 25≤BMI in adults.
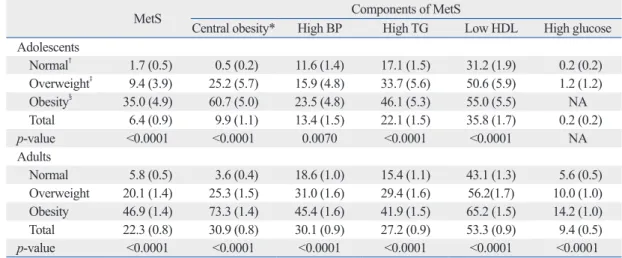
Table 3. Prevalence of MetS and its Components by BMI in Adolescents and Adults
MetS Components of MetS
Central obesity* High BP High TG Low HDL High glucose
Adolescents
Normal† 1.7 (0.5) 0.5 (0.2) 11.6 (1.4) 17.1 (1.5) 31.2 (1.9) 0.2 (0.2) Overweight‡ 9.4 (3.9) 25.2 (5.7) 15.9 (4.8) 33.7 (5.6) 50.6 (5.9) 1.2 (1.2)
Obesity§ 35.0 (4.9) 60.7 (5.0) 23.5 (4.8) 46.1 (5.3) 55.0 (5.5) NA
Total 6.4 (0.9) 9.9 (1.1) 13.4 (1.5) 22.1 (1.5) 35.8 (1.7) 0.2 (0.2)
p-value <0.0001 <0.0001 0.0070 <0.0001 <0.0001 NA
Adults
Normal 5.8 (0.5) 3.6 (0.4) 18.6 (1.0) 15.4 (1.1) 43.1 (1.3) 5.6 (0.5) Overweight 20.1 (1.4) 25.3 (1.5) 31.0 (1.6) 29.4 (1.6) 56.2(1.7) 10.0 (1.0) Obesity 46.9 (1.4) 73.3 (1.4) 45.4 (1.6) 41.9 (1.5) 65.2 (1.5) 14.2 (1.0)
Total 22.3 (0.8) 30.9 (0.8) 30.1 (0.9) 27.2 (0.9) 53.3 (0.9) 9.4 (0.5)
p-value <0.0001 <0.0001 <0.0001 <0.0001 <0.0001 <0.0001 Data presented as prevalence (standard error).
MetS, Metabolic Syndrome ; BP, blood pressure; TG, triglyceride; HDL, high-density lipoprotein; NA, not available.
*Central obesity was defined as waist circumference ≥90th percentile for age and gender in adolescents and >90 cm (Male) or >80 cm (Female) in adults.
†Cutoff ranges of normal were BMI <85th percentile in adolescent and BMI<23 in adults.
‡Cutoff ranges of overweight were 85th percentile ≤BMI<95th percentile in adolescent and 23≤BMI<25 in adults.
§Cutoff ranges of obesity were 95th percentile ≤BMI in adolescent and 25≤BMI in adults.
ing based on a newly developed growth curve for children in Korea. Also, there is a possibility that obesity among ad- olescents was overestimated in the KNHANES II data due to the use of the old version of criteria for assessing obesity among adolescents.
The prevalence of MetS showed a different pattern be- tween males and females (Fig. 1). Females aged >50 years had a higher prevalence than males of the same age. This phenomenon was consistent with other Korean studies.23,24 Previous studies found that natural menopause is associated with elevated central obesity.23,25 Likewise, according to the KNHANES III, females have a higher prevalence of central obesity than males in the age group of 50 years or more.26 Therefore, difference in prevalence trends by gender may and older age groups, accordingly, and the ORs of both obe-
sity and overweight on MetS were statistically significant in each age group.
Fig. 2. presents the comparison of the prevalence of MetS in adolescents using various definitions. When the criteria by Ferranti were used, the prevalence of MetS was 13.4% (95%
CI: 10.8-16.1). When we applied the new definition by the International Diabetes Federation (IDF), the most recent defi- nition of MetS, the prevalence was 0.2% (95% CI: 0.03-1.0).
The prevalence based on Cook’s definition seemed to be the median as compared to the other definitions.
DISCUSSION
In this nation-wide study, the prevalence of MetS differed significantly by gender and age group. The prevalence of MetS was high in males and rapidly increased in the 30-39 year age group. Obesity was an independent risk factor for MetS in each age group. Especially, those 39 years of age or less had higher ORs than those 40 or more.
Metabolic syndrome is a risk factor of cardiovascular dis- eases and Type 2 diabetes. The World Health Organization in 199818 and the National Cholesterol Education Program Expert Panel III in 200113 developed definitions of MetS that have been widely used, along with the definition by the IDF. The diagnostic criteria and operational definitions are fairly broad, depending on the different organizations and authors, and reports on the prevalence of MetS have pro- duced differing results. It is important to apply a unified def- inition and criteria when comparing the syndrome’s preva- lence among different populations in different countries. In a study of Asian North Indians, the modified NCEP ATP III criteria showed the highest occurrence of MetS in incident T2DM patients.19 In a Japanese-Brazilian study, the modi- fied NCEP ATP III criteria was easily detected and helped health care providers screen high-risk individuals.20
For adolescents in this study, the definition of MetS by NCEP ATP III modified by Cook, et al.9 was applied for a com- parison with the prevalence in adults, also defined by NCEP ATP III. The prevalence of MetS in adolescents was 6.4%, which was the same as in the US (6.4%),6 higher than that of China (3.7%),21 and lower than that of Iran (10.0%).22 The prevalence of MetS among adolescents from the KNHANES II in 2001 data was 9.2%11 which was higher than the prev- alence from the present study. The lower prevalence in this study might be due to the waist circumference criteria be-
Fig. 1. Prevalence of metabolic syndrome by gender and age group. Bars are confidence intervals. *Criteria of metabolic syndrome from Table 1 were ap- plied.
Fig. 2. Comparison of prevalence of metabolic syndrome in Korean adoles- cents by different criteria. Bars are confidence intervals. *Waist circumfer- ence ≥90th percentile for age and gender, triglyceride ≥110 mg/dL, HDL- cholesterol ≤40 mg/dL, blood pressure ≥90th percentile for age, gender, height (<age 18 years) or blood pressure ≥130/85 mmHg (≥age 18 years), fast- ing glucose ≥110 mg/dL. †Waist circumference >75th percentile for age and gender, triglyceride ≥100 mg/dL, HDL-cholesterol <50 mg/dL, blood pressure
≥90th percentile for age, gender, height (<age 18 years) or blood pressure
≥130/85 mmHg (≥age 18 years), fasting glucose ≥100 mg/dL. ‡Waist circumfer- ence ≥90th percentile for age and gender, triglyceride ≥150 mg/dL, HDL- cholesterol <40 mg/dL, blood pressure ≥130/85 mmHg, fasting glucose ≥100 mg/dL.
0 10 20 30 40 50 60
Prevalence of metabolic syndrome* per 100 person
10-19 20-29 30-39 40-49 50-59 60+
Age group 8.7
3.9 7.0
19.1 29.7
39.1 51.4
1.3 8.8
16.5
36.4 29.7
0 10 20 30
Prevalence of metabolic syndrome per 100 person
ATP III (by Cook)* ATP III (by Ferranti)† New IDF‡ Criteria
Boys aged 10-19 years Girls aged 10-19 years MaleFemale
to missing responses and/or extreme outliers in their re- sponses, the remaining subjects chosen for the study were enough to represent the general public in Korea. Our study was the first study to use the BMI and height percentile ta- bles for Korean children developed by the Korea Center for Disease Control and the Korea Pediatric Society in 2005.
The application of the NCEP ATP III definition for adults and Cook’s definition for adolescents was used, and we were able to compare the prevalence of MetS and the impact of obesity on MetS between age groups.
The implication of these results might be useful and im- portant for early detection and screening for at-risk adoles- cents and young adults. These high-risk individuals for MetS need to be monitored intensively once they are identified.
Further research should focus on exploring effective early screening and preventive interventions that may be used in pediatric primary care practices with young children who are overweight, obese, or at high risk for later life obesity to de- crease the trajectory of child weight gain, promote healthy weight attainment, and decrease the incidence of chronic co- morbidities that are associated with overweight and obesity.
ACKNOWLEDGEMENTS
This research was supported by a grant from the Health Pro- motion Research and Development Fund, Ministry of Health Welfare and Family Affair, Republic of Korea (Grant 07-52).
We thank the Korean Center for Disease Control and Preven- tion, who conducted the KNHANES and supplied the data for the study.
REFERENCES
1. Kimm SY, Obarzanek E. Childhood obesity: a new pandemic of
explain the effect of menopause on MetS in females.23,27 Fig. 2. presented the comparison of the prevalence of MetS in adolescents using different definitions. When the cri- teria by de Ferranti, et al.,10 another modified version of ATP III, were used, the prevalence of MetS was 13.4% (95% CI:
10.8-16.1). When adapting the definition by new IDF, the most recent definition of MetS, was applied, the prevalence was 0.2% (95% CI: 0.03-1.0). The prevalence based on the Cook’s definition9 seemed to be the median as compared to the other definitions. In the 20-29 year-old group, the preva- lence of MetS was 4.2 (95% CI: 2.4-6.1). As compared to the 20-29 year-old group, the prevalence of MetS among adoles- cents based on the Feranti definition may have been overesti- mated. The IDF definition for adults tends to include more people because of its lower cut off points for MetS diagno- sis;28 however, reports on the prevalence of MetS based on IDF were lower in some studies and higher in others.29,30
35.0% in ≥95th percentile of BMI (obese) and 9.4% of adolescents in the ≥85th-<95th percentiles (overweight) were classified as having MetS. Other studies also have shown a similar prevalence of MetS among adolescents.5,16,17 We expected to have a lower OR of obesity in MetS among adolescents than among obese adults. The pattern of OR by age group, however, showed higher ORs among adoles- cents and those in their 20s and 30s than in the age groups over 40 years of age. In short, the impact of obesity on MetS among adolescents was higher than among adults over 40 years old and was similar to the impact of being obese in the 20-29 age group.
The small number of adolescents and young adults with MetS, which showed wide confidence intervals of odds ra- tios, may have caused some limitations to our study. One important strength of our study, however, was the use of data from the KNHANES III, which represents the general pub- lic in Korea and was collected through a well-developed study design. Although all subjects were not included due
Table 4. The Odds Ratio* of Overweight Body Type and Obesity in the Metabolic Syndrome by Age Group
Age group Overweight Obesity
OR 95% CI OR 95% CI
10-19 8.67 2.28-33.07 28.09 11.42-69.14
20-29 0.65 0.05-8.57 32.04 7.50-136.94
30-39 5.50 1.98-15.39 32.15 12.80-80.79
40-49 4.02 2.14-7.54 16.21 9.40-27.94
50-59 2.22 1.39-3.54 7.61 4.74-12.22
60+ 4.44 3.04-6.49 9.95 6.75-14.65
OR, odds ratio; CI, confidence interval.
*Adjusted for gender, age, smoking, alcohol drinking, and regular exercise and significant in each age group.
cents Growth Standard. 2007 Korean Children and Adolescents Growth Standard.
17. National High Blood Pressure Education Program Working Group on High Blood Pressure in Children and Adolescents. The fourth report on the diagnosis, evaluation, and treatment of high blood pressure in children and adolescents. Pediatrics 2004;114:555-76.
18. Alberti KG, Zimmet PZ. Definition, diagnosis and classification of diabetes mellitus and its complications. Part 1: diagnosis and classification of diabetes mellitus provisional report of a WHO consultation. Diabet Med 1998;15:539-53.
19. Rosenbaum P, Gimeno SG, Sanudo A, Franco LJ, Ferreira SR;
Japanese-Brazilian Diabetes Study Group. Analysis of criteria for metabolic syndrome in a population-based study of Japanese-Bra- zilians. Diabetes Obes Metab 2005;7:352-9.
20. Dhanaraj E, Bhansali A, Jaggi S, Dutta P, Jain S, Tiwari P, et al.
Predictors of metabolic syndrome in Asian north Indians with new- ly detected type 2 diabetes. Indian J Med Res 2009;129:506-14.
21. Li Y, Yang X, Zhai F, Kok FJ, Zhao W, Piao J, et al. Prevalence of the metabolic syndrome in Chinese adolescents. Br J Nutr 2008;
99:565-70.
22. Esmaillzadeh A, Mirmiran P, Azadbakht L, Etemadi A, Azizi F.
High prevalence of the metabolic syndrome in Iranian adoles- cents. Obesity (Silver Spring) 2006;14:377-82.
23. Kim HM, Park J, Ryu SY, Kim J. The effect of menopause on the metabolic syndrome among Korean women: the Korean National Health and Nutrition Examination Survey, 2001. Diabetes Care 2007;30:701-6.
24. Park HS, Oh SW, Cho SI, Choi WH, Kim YS. The metabolic syn- drome and associated lifestyle factors among South Korean adults.
Int J Epidemiol 2004;33:328-36.
25. Poehlman ET, Toth MJ, Gardner AW. Changes in energy balance and body composition at menopause: a controlled longitudinal study. Ann Intern Med 1995;123:673-5.
26. Korean Center for Disease Control and Prevention. In-depth anal- yses of the Third National Health and Nutrition Examination Sur- vey: the Health Examination Part; 2007. p.62-3.
27. Park YW, Zhu S, Palaniappan L, Heshka S, Carnethon MR, Heymsfield SB. The metabolic syndrome: prevalence and associ- ated risk factor findings in the US population from the Third Na- tional Health and Nutrition Examination Survey, 1988-1994. Arch Intern Med 2003;163:427-36.
28. Ford ES. Prevalence of the metabolic syndrome defined by the In- ternational Diabetes Federation among adults in the U.S. Diabetes Care 2005;28:2745-9.
29. Ford ES, Li C, Zhao G, Pearson WS, Mokdad AH. Prevalence of the metabolic syndrome among U.S. adolescents using the defini- tion from the International Diabetes Federation. Diabetes Care 2008;31:587-9.
30. Kim HM, Kim DJ, Jung IH, Park C, Park J. Prevalence of the metabolic syndrome among Korean adults using the new Interna- tional Diabetes Federation definition and the new abdominal obe- sity criteria for the Korean people. Diabetes Res Clin Pract 2007;77:99-106.
the new millennium. Pediatrics 2002;110:1003-7.
2. Ebbeling CB, Pawlak DB, Ludwig DS. Childhood obesity: public- health crisis, common sense cure. Lancet 2002;360:473-82.
3. Strauss RS, Pollack HA. Epidemic increase in childhood over- weight, 1986-1998. JAMA 2001;286:2845-8.
4. Park YS, Lee DH, Choi JM, Kang YJ, Kim CH. Trend of obesity in school age children in seoul over the past 23 years. Korean J Pediatr 2004;47:247-57.
5. Weiss R, Caprio S. The metabolic consequences of childhood obesity. Best Pract Res Clin Endocrinol Metab 2005;19:405-19.
6. Duncan GE, Li SM, Zhou XH. Prevalence and trends of a meta- bolic syndrome phenotype among u.s. Adolescents, 1999-2000.
Diabetes Care 2004;27:2438-43.
7. Dolan LM, Bean J, D’Alessio D, Cohen RM, Morrison JA, Good- man E, et al. Frequency of abnormal carbohydrate metabolism and diabetes in a population-based screening of adolescents. J Pe- diatr 2005;146:751-8.
8. Ford ES, Li C. Defining the metabolic syndrome in children and adolescents: will the real definition please stand up? J Pediatr 2008;152:160-4.
9. Cook S, Weitzman M, Auinger P, Nguyen M, Dietz WH. Preva- lence of a metabolic syndrome phenotype in adolescents: findings from the third National Health and Nutrition Examination Survey, 1988-1994. Arch Pediatr Adolesc Med 2003;157:821-7.
10. de Ferranti SD, Gauvreau K, Ludwig DS, Neufeld EJ, Newburger JW, Rifai N. Prevalence of the metabolic syndrome in American adolescents: findings from the Third National Health and Nutri- tion Examination Survey. Circulation 2004;110:2494-7.
11. Kim HM, Park J, Kim HS, Kim DH. Prevalence of the metabolic syndrome in Korean adolescents aged 12-19 years from the Kore- an National Health and Nutrition Examination Survey 1998 and 2001. Diabetes Res Clin Pract 2007;75:111-4.
12. Ministry of Health and Welfare. The third Korea National Health and Nutrition Examination Survey (KNHANES Ⅲ) 2005 - Health Examination -. Seoul, Korea: Ministry of Health and Welfare;
2006.
13. Expert Panel on Detection, Evaluation, and Treatment of High Blood Cholesterol in Adults. Executive Summary of The Third Report of The National Cholesterol Education Program (NCEP) Expert Panel on Detection, Evaluation, And Treatment of High Blood Cholesterol In Adults (Adult Treatment Panel III). JAMA 2001;285:2486-97.
14. World Health Organization Regional Office for the Western Pacif- ic (WPRO), the International Association for the Study of Obesity (IASO) and the International Obesity Task Force (IOTF). The Asia-Pacific Perspective: Redefining Obesity and Its Treatment.
Melbourne: Health Communication Australia; 2000.
15. Koplan JP, Liverman CT, Kraak VA. (Eds) Preventing Childhood Obesity: Health in the balance. Committee on the Prevention of Obesity in Children and Youth, Institute of Medicine. National Academy of Sciences, 2004. Available at: http://www.iom.edu/re- port.asp?id=22596 (Accessed June 11, 2009)
16. Korean Center for Disease Control and Prevention, The Korean Pediatric Society, Committee for Korean Children and Adoles-