G Perfusion MR Imaging in Gliomas: Comparison with Histologic Tumor Grade
7
0
0
전체 글
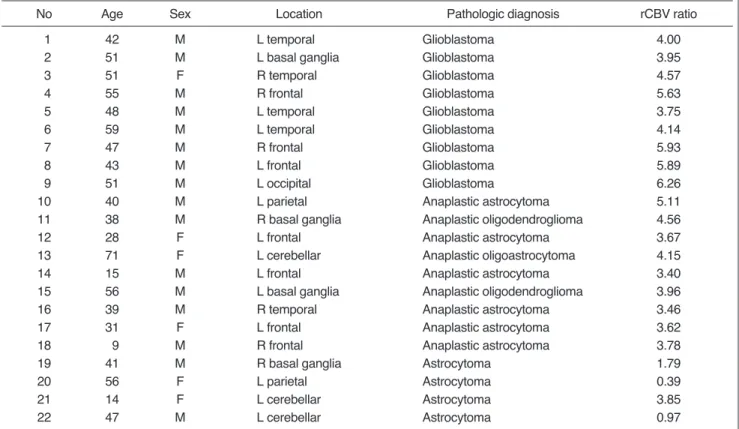
(2) Lee et al.. logic grade of gliomas and to determine the rCBV ratio cutoff value which permitted discrimination between highgrade and low-grade gliomas, and the sensitivity and specificity of this value.. MATERIALS AND METHODS Patients We retrospectively investigated 24 consecutive patients with gliomas who had undergone both conventional and perfusion MR imaging during a four-year period. Two patients with pilocytic astrocytomas were excluded because these tumors, classified as circumscribed astrocytomas, are more benign than diffuse infiltrating gliomas and do not usually progress to malignancy. Consequently, 22 patients with diffuse infiltrating gliomas were included in this study. Sixteen were male and six were female, and their ages ranged from nine to 71 (mean, 41) years. The presence of gliomas was confirmed by surgical resection (n = 16), or by stereotactic biopsy (n = 6). All tumors were graded according to the World Health Organization grading system (17); there were four grade-2 astrocytomas, nine grade-3 anaplastic gliomas [anaplastic astrocytoma (n = 6), anaplastic oligodendroglioma (n = 2), anaplastic oligoastrocytoma (n = 1)], and nine grade-4 glioblastomas. Tumors were lo-. cated in the cerebral hemisphere in 14 cases, the basal ganglia in five, and the cerebellum in three. MR imaging studies MR examinations were performed on a Siemens 1.5-T 63SP system (Erlangen, Germany) using the following imaging sequences: axial turbo spin-echo T2-weighted, axial spin-echo T1-weighted, dynamic contrast-enhanced T2*weighted (for perfusion imaging), and axial postcontrast T1-weighted. The imaging parameters were 3500/90 (repetition time msec/echo time msec) for T2-weighted and 550/14 for pre- and postcontrast T1-weighted imaging. The section thickness/gap was 5 6/1.5 1.8 mm and the matrix was 200 256. For dynamic contrast-enhanced T2*-weighted imaging, a conventional gradient-echo sequence (40/26, 10° flip angle, 64 128 matrix, 5 6 mm slice thickness, 3.8 sec acquisition time) was used. In order to include the largest solid portion of the tumor on the basis of the findings of T1and T2-weighted imaging, 17 20 serial, single-section dynamic images were obtained. Within 5 seconds of the acquisition of the first three images, a Gd-DTPA (Magnevist, 0.2 mmol/kg; Schering, Germany) or gadodiamide (Omniscan, 0.2 mmol/kg; Nycomed, Norway) bolus was administered manually via a forearm vein, followed by a. Table 1. Relative Cerebral Blood Volume Ratios of 22 Patients with Gliomas. Note.. 2. No. Age. Sex. Location. Pathologic diagnosis. rCBV ratio. 01 02 03 04 05 06 07 08 09 10 11 12 13 14 15 16 17 18 19 20 21 22. 42 51 51 55 48 59 47 43 51 40 38 28 71 15 56 39 31 09 41 56 14 47. M M F M M M M M M M M F F M M M F M M F F M. L temporal L basal ganglia R temporal R frontal L temporal L temporal R frontal L frontal L occipital L parietal R basal ganglia L frontal L cerebellar L frontal L basal ganglia R temporal L frontal R frontal R basal ganglia L parietal L cerebellar L cerebellar. Glioblastoma Glioblastoma Glioblastoma Glioblastoma Glioblastoma Glioblastoma Glioblastoma Glioblastoma Glioblastoma Anaplastic astrocytoma Anaplastic oligodendroglioma Anaplastic astrocytoma Anaplastic oligoastrocytoma Anaplastic astrocytoma Anaplastic oligodendroglioma Anaplastic astrocytoma Anaplastic astrocytoma Anaplastic astrocytoma Astrocytoma Astrocytoma Astrocytoma Astrocytoma. 4.00 3.95 4.57 5.63 3.75 4.14 5.93 5.89 6.26 5.11 4.56 3.67 4.15 3.40 3.96 3.46 3.62 3.78 1.79 0.39 3.85 0.97. rCBV = relative cerebral blood volume, L = left, R = right. Korean J Radiol 2(1), March 2001.
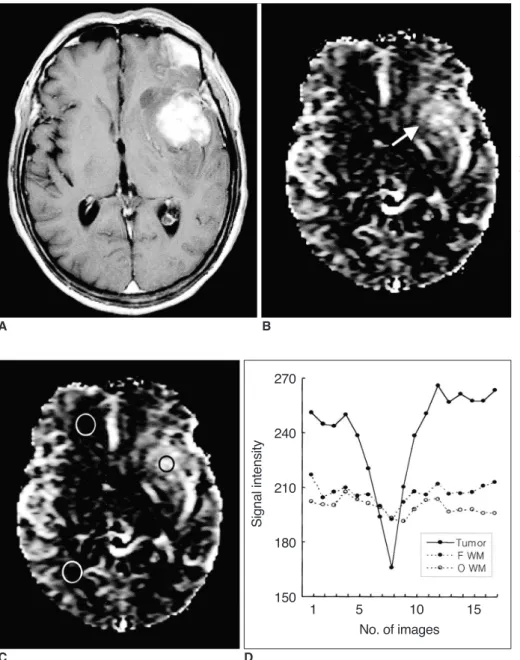
(3) Perfusion MR Imaging in Gliomas. flush of 30 ml saline. After the initiation of bolus injection, approxinatel, bosecs were required for imaging. Generation of rCBV maps All dynamic MR images were transferred to a personal computer via ethernet, and were evaluated with home made software. For the creation of rCBV map, an exponential relationship between relative signal reduction and contrast material concentration was assumed. To fit a gamma-variate function to the contrast material concentration versus time curve on a pixel-by-pixel basis, the nonlinear regression method was used (18, 19). The rCBV of each pixel was then calculated by numerical integration of the area under the concentration-time curve (i.e. rCBV = C (t)dt) (20). Thus, increased signal intensity on the rCBV map indicated increased rCBV, and vice versa.. A. Data analysis On an rCBV map, a region-of-interest (ROI), including at least 20 pixels, was placed in the solid portion of a tumor for measurement of rCBV. This was measured at least three times, and for further analysis, its maximum value was chosen. An rCBV obtained by our method is not an absolute quantity, and for this reason, results were normalized by calculating rCBV ratio (i.e. maximum rCBV of a tumor divided by that of white matter). The rCBV of white matter was obtained by placing the ROI, including at least 20 pixels, in contralateral frontal and occipital (or parietal) white matter, and averaging those rCBV values. In three cases of cerebellar tumors, the ROI was placed in contralateral central white matter. To assess the relationship between rCBV ratio and histologic tumor grade, we compared rCBV ratios between. Fig. 1. Case 7: Glioblastoma in a 47year-old man. A. Postcontrast T1-weighted image shows a ring-enhancing necrotic tumor in the right frontal lobe. B. Relative cerebral blood volume (rCBV) map shows high rCBV in the solid portion of the tumor (arrow). The higher signal on the rCBV map represents a higher rCBV. C. rCBV map shows the placement of ROIs for measurement of rCBV in the tumor (black circle) and in contralateral frontal and parietal white matter (white circles). D. Signal intensity-time curves measured at ROIs in C show different patterns of signal reduction between tumor and normal white matter during the transit of contrast material. Remarkable reduction of signal intensity is noted in the tumor compared to normal white matter, suggesting tumor hypervascularity.. B. Signal intensity. 240. 190. 140. 90 1 C Korean J Radiol 2(1), March 2001. 5. 10 15 No. of images. 20. D. 3.
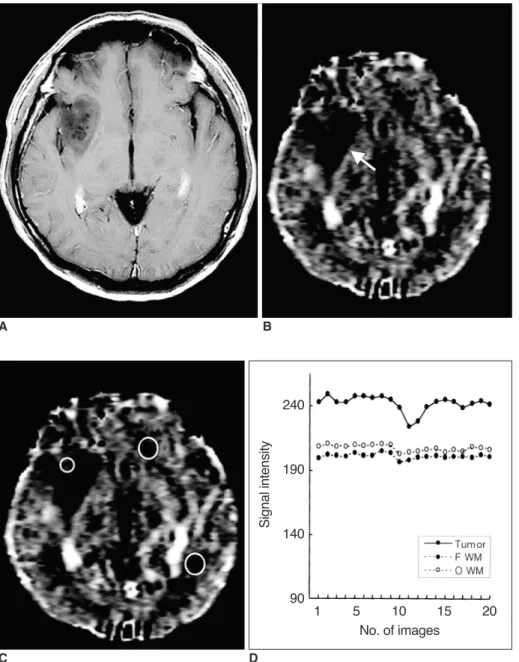
(4) Lee et al. Fig. 2. Case 15: Anaplastic oligodendroglioma in a 56-year-old man. A. Postcontrast T1-weighted image shows a strongly enhancing solid tumor in the left basal ganglia. B. Relative cerebral blood volume (rCBV) map shows heterogeneously increased rCBV in the tumor (arrow). C. rCBV map shows the placement of ROIs for measurement of rCBV in the tumor (black circle) and in contralateral frontal and occipital white matter (white circles). D. Signal intensity-time curves measured at ROIs in C show different patterns of signal reduction between tumor and normal white matter, suggesting tumor hypervascularity.. A. B. Signal intensity. 270. 240. 210. 180. 150. C. 1. 15. D. glioblastomas, anaplastic gliomas, and low-grade gliomas using the Kruskal-Wallis and Mann-Whitney U tests. The latter was also used for comparing rCBV ratios between high-grade (glioblastomas and anaplastic gliomas) and lowgrade gliomas. To calculate the rCBV ratio cutoff value which permits discrimination between high-grade and lowgrade gliomas, and the sensitivity and specificity of this value, univariate discriminant analysis was used. For statistical computation, an SPSS statistical software package (SPSS, Chicago, Ill.) was employed, with the level of significance defined as p < .05.. RESULTS Table 1 summarizes the rCBV ratios of all tumors. These 4. 5 10 No. of images. were 3.75 6.26 (mean, 4.90 1.01) in glioblastomas (Fig. 1), 3.40 5.11 (mean, 3.97 0.56) in anaplastic gliomas (Fig. 2), and 0.39-3.85 (mean, 1.75 1.51) in low-grade gliomas (Fig. 3). The overall group difference in rCBV ratios between these three tumor groups was statistically significant (p < .01, using the Kruskal-Wallis test). Individual group differences in rCBV ratios were also significant (p < .05 between glioblastomas and anaplastic gliomas, p < .05 between anaplastic gliomas and low-grade gliomas, and p < .01 between glioblastomas and low-grade gliomas, using the Mann-Whitney U test) (Fig. 4). The rCBV ratios of high-grade gliomas, including glioblastomas and anaplastic gliomas, were 3.40 6.26 (mean, 4.44 0.93), and were statistically significantly higher than those of low-grade gliomas (p < .05, using the Mann-Whitney U test). The Korean J Radiol 2(1), March 2001.
(5) Perfusion MR Imaging in Gliomas Fig. 3. Case 19: Low-grade astrocytoma in a 41-year-old man. A. Postcontrast T1-weighted image shows a non-enhancing low signal intensity tumor in the right basal ganglia. B. Relative cerebral blood volume (rCBV) map shows low rCBV in the tumor (arrow). C. rCBV map shows the placement of ROIs for measurement of rCBV in the tumor (small circle) and in contralateral frontal and occipital white matter (large circles). D. Signal intensity-time curves measured at ROIs in C show less signal reduction in this tumor than in the highgrade gliomas seen in Figs. 1 and 2, suggesting that the vascularity of an astrocytoma is lower.. A. B. Signal intensity. 240. 190. 140. 90 1. C. 5 10 15 No. of images. D. rCBV ratio cutoff value which permitted discrimination between high-grade (i.e. glioblastomas and anaplastic gliomas) and low-grade gliomas was 2.60. The sensitivity and specificity of this value were 100% (18/18) and 75% (3/4), respectively.. DISCUSSION Gliomas are the most common neoplasm of the brain, and have a heterogeneous histologic spectrum from lowgrade astrocytomas to glioblastomas (1). In spite of improvements in the results of surgery, radiation therapy and chemotherapy, the prognosis of patients with gliomas, particularly those with high-grade tumors, remains poor. For planning the optimal treatment strategy, accurate determiKorean J Radiol 2(1), March 2001. 20. nation of tumor grade is critical, and in most histologic grading systems, vascular proliferation of gliomas is a diagnostic criterion for malignancy (1, 17, 21). Although conventional MR imaging with gadolinium-based contrast enhancement has been useful for grading gliomas, contrast enhancement itself reflects disruption of the blood-brain barrier, not tumor angiogenesis. The area of contrast enhancement observed does not indicate the most malignant portion of the tumor and should not be the only target site for biopsy (16). Perfusion MR imaging methods include the arterial spintagging and the first-pass contrast techniques. The former does not require the use of contrast material, but is limited by its sensitivity to motion and low contrast-to-noise ratio (22), and for these reasons it has not been widely used in 5.
(6) Lee et al.. p < .01. 7.00 6.00. p < .05. p < .05. CBV ratio. 5.00 4.00 3.00 2.00 1.00 0 Glioblastoma Anaplastic glioma. Lowgrade glioma. Fig. 4. Plot of relative cerebral blood volume (rCBV) ratios in glioblastomas, anaplastic gliomas and low-grade gliomas. The rCBV ratio is highest in glioblastomas and lowest in low-grade gliomas. A comparison of mean rCBV ratios in each tumor group shows statistically significant differences between them. The dotted horizontal line represents the rCBV ratio cutoff value (2.60) which permitted discrimination between high-grade (glioblastomas and anaplastic gliomas) and low-grade gliomas.. the clinical field. The first-pass technique is based on the reduction of signal intensity due to local field inhomogeneity induced by contrast material within the blood vessels during the period in which contrast material first passes through the brain (23). The reduction is proportional to regional CBV and the concentration of contrast material. Both the spin-echo and gradient-echo techniques can be utilized for first-pass perfusion imaging. The former is more sensitive in detecting tumor vascularity at the capillary level (i.e. microvasculature) than at the large vessel level (5). In contrast, the gradient-echo technique is sensitive to the total volume of blood contained in both capillaries and large vessels (15). Since high-grade gliomas contain both these types of vessel, the gradient-echo technique is more suitable for assessing tumor vascularity. Sugahara et al. (15) reported that the rCBV of gliomas measured by gradient-echo perfusion imaging correlated well with the histopathologic and angiographic findings of tumor vascularity. In our study, the rCBV obtained by gradient-echo perfusion imaging also increased with tumor grade, in accordance with the demonstrated close correspondence between rCBV and tumor grade. Since gradient-echo perfusion imaging findings thus reflect tumor vascularity, the 6. modality can play an important role in the noninvasive determination of which portion of a tumor is most malignant. The rCBV ratios of gliomas have been described in several previous studies. Aronen et al. (5) reported them to be 0.82-5.40 (mean, 3.64) in high-grade gliomas (glioblastomas and anaplastic astrocytomas), and 1.10 1.21 (mean, 1.11) in low-grade gliomas. Sugahara et al. (15) found that the rCBV ratios of glioblastomas, anaplastic astrocytomas and low-grade gliomas were 4.00 16.20 (mean, 7.32), 0.98 7.93 (mean, 4.61) and 0.64 2.01 (mean, 1.26), respectively; according to Knopp et al. (16), these ratios were 1.73 13.70 (mean, 5.07) in high-grade gliomas and 0.92 2.19 (mean, 1.44) in low-grade. Although these studies showed a wide range of rCBV ratios, and overlapping between tumors of different grades, there were statistically significantly differences between high-grade and low-grade gliomas, as in our study. We found that the rCBV ratio cutoff value which permitted discrimination between highgrade and low-grade gliomas was 2.60, with 100% sensitivity and 75% specificity. All our results suggest that perfusion MR imaging is a valuable technique for assessing the histologic grade of gliomas. In the clinical field, however, it should be borne in mind that rCBV ratios may differ according to the imaging technique employed (i.e. the imaging sequence, amount of contrast material for bolus injection, and duration of contrast injection). Perfusion MR imaging of gliomas can be used to monitor response to treatment as well as to determine histologic grade. Reductions in rCBV have been reported after radiation therapy (24, 25) and during antiangiogenic therapy (26). rCBV data have also been utilized to distinguish tumor recurrence and non-neoplastic contrast-enhancing tissue after radiation therapy (27), though to ascertain the usefulness of perfusion MR imaging in this field, further investigation is needed. This study suffers from several technical limitations. First, dynamic contrast-enhanced T2*-weighted imaging technique can evaluate only a single section rather than a complete tumor, and this raises concerns about the reliability of the data thus obtained. The second limitation is the relatively low temporal resolution of the imaging, which provides only a few data points useful for tracking the first pass of contrast material. These shortcomings could, however limitations could be mitigated by using the echo-planar imaging technique, which has become increasingly available in the clinical field. In conclusion, dynamic contrast-enhanced T2*-weighted perfusion MR imaging performed in these 22 cases provided valuable information about the vascularity of gliomas, and led to the correct assessment of histologic tumor grade. The modality is thus a useful and dependable means of Korean J Radiol 2(1), March 2001.
(7) Perfusion MR Imaging in Gliomas. noninvasively assessing the histologic grade of gliomas.. References 1. Russell D, Rubinstein L. Tumours of central neuroepithelial origin. In Rubinstein LJ, ed. Pathology of tumours of the central nervous system. Baltimore, Md.: Williams & Wilkins, 1989;83350 2. Van Kirk OC, Cornell SH, Jacoby CG. Posterior fossa intraaxial tumors: a comparision of computed tomography with other imaging methods. J Comput Assist Tomogr 1979;3:31-39 3. Joyce P, Bentson J, Takahashi M, Winter J, Wilson G, Byrd S. The accuracy of predicting histologic grades of supratentorial astrocytomas on the basis of computerized tomography and cerebral angiography. Neuroradiology 1978;16:346-348 4. Seeger JF, Burke DP, Knake JE, Gabrielsen TO. Computed tomographic and angiographic evaluation of hemangioblastoma. Radiology 1981;138:65-73 5. Aronen HJ, Gazit IE, Louis DN, et al. Cerebral blood volume maps of gliomas: comparision with tumor grade and histologic findings. Radiology 1994;191:41-51 6. Edelman RR, Mattle HP, Atkinson DJ, et al. Cerebral blood flow: assessment with dynamic contrast-enhanced T2*-weighted MR imaging at 1.5T. Radiology 1990;176:211-220 7. Rosen BR, Belliveau JW, Aronen HJ, et al. Susceptibility contrast imaging of cerebral blood volume: human experience. Magn Reson Med 1991;22:293-299 8. Aronen HJ, Cohen MS, Belliveau JW, Fordham JA, Rosen BR. Ultrafast imaging of brain tumors. Top Magn Reson Imaging 1993;5:14-24 9. Le Bihan D, Douek P, Argyropoulou M, Turner R, Patronas N, Fulham M. Diffusion and perfusion magnetic resonance imaging in brain tumors. Top Magn Reson Imaging 1993;5:25-31 10. Maeda M, Itoh S, Kimura H, et al. Tumor vascularity in the brain: evaluation with dynamic susceptibility-contrast MR imaging. Radiology 1993;189:233-238 11. Maeda M, Itoh S, Kimura H, et al. Vascularity of meningioma and neuroma: assessment with dynamic susceptibility-contrast MR imaging. AJR 1994;163:181-186 12. Kim JS, Lee GK, Kim JH, et al. Blood volume of intraaxial brain tumor: evaluation with dynamic contrast-enhanced T2*-weighted MR imaging. J Korean Radiol Soc 1997;37:783-788 13. Kim HD, Chang KH, Song IC, et al. Perfusion MR imaging of the brain tumor: preliminary report. J Korean Soc Magn Reson Med 1997;1:119-124 14. Choi JY, Sun JS, Kim SY, et al. Effect of steroid on brain tumors and surround edemas: observation with regional cerebral blood volume (rCBV) maps of perfusion MRI. J Korean Radiol Soc 2000;42:15-21. Korean J Radiol 2(1), March 2001. 15. Sugahara T, Korogi Y, Kochi M, et al. Correlation of MR imaging-determined cerebral blood volume maps with histologic and angiographic determination of vascularity of gliomas. AJR 1998;171:1479-1486 16. Knopp EA, Cha S, Johnson G, et al. Glial neoplasms: dynamic contrast-enhanced T2*-weighted MR imaging. Radiology 1999;211:791-798 17. Kleihues P, Burger PC, Scheithauer BW. Histologic typing of tumours of the central nervous system. 2nd ed. Berlin, Germany: Springer-Verlag, 1993;11-30 18. Thompson HK, Starmer CF, Whalen RE, McIntosh HD. Indicator transit time considered as a gamma variate. Circ Res 1964;14:502-515 19. Benner T, Heiland S, Erb G, Forsting M, Sartor K. Accuracy of gamma-variate fits to concentration-time curves from dynamic susceptibility-contrast MRI: influence of time resolution, maximal signal drop and signal-to-noise. Magn Reson Imaging 1997;15:307-317 20. Rosen BR, Belliveau JW, Vevea JM, et al. Perfusion MR imaging with NMR contrast agents. Magn Reson Med 1990;14:249265 21. Brem S, Cotran R, Folkman J. Tumor angiogenesis: a quantitative method for histologic grading. J Natl Cancer Inst 1972;48: 347-356 22. Edelman RR, Siewert B, Darby DG, et al. Quantitative mapping of cerebral blood flow and functional localization with echo-planar MR imaging and signal targeting with alternating radiofrequency. Radiology 1994;192:513-520 23. Belliveau JW, Rosen BR, Kantor HL, et al. Functional cerebral imaging by susceptibility contrast NMR. Magn Reson Med 1990;14:538-546 24. Gückel F, Brix G, Rempp K, Deimling M, Rother J, Georgi M. Assessment of cerebral blood volume with dynamic susceptibility contrast enhanced gradient echo imaging. J Comput Assist Tomogr 1994;18:344-351 25. Wenz F, Rempp K, Hess T, et al. Effect of radiation on blood volume in low-grade astrocytomas and normal brain tissue: quantification with dynamic susceptibility contrast MR imaging. AJR 1996;166:187-193 26. Cha S, Knopp EA, Johnson G, et al. Dynamic contrast-enhanced T2*-weighted MR imaging of recurrent malignant gliomas treated with thalidomide and carboplatin. AJNR 2000;21:881-890 27. Sugahara T, Korogi Y, Tomiguchi S, et al. Posttherapeutic intraaxial brain tumor: the value of perfusion-sensitive contrastenhanced MR imaging for differentiating tumor recurrence from nonneoplastic contrast-enhancing tissue. AJNR 2000;21:901909. 7.
(8)
수치

+2

관련 문서
Hwa Jung Kim, Bon-Cheol Ku, Jae Kwan Lee “Use of Pyrolyzed Amino Acids as Versatile Dopants for Synthesis of Heteroatoms-doped
Seung Soo Jang Sung Gyun Shin Min Jae Lee Sang Soo Han Chan Ho Choi Sungkyum Kim Woo Sung Cho and Song Hyun Kim POSTECH Yeong Rok Kang Wol Soon Jo Soo Kyung Jeong and
Kim DM, Yu KD, Lee JH, Kim HK, Lee SH:Controlled trial of a 5-day course of telithromycin versus doxycycline for treatment of mild to moderate scrub typhus. Scrub
Chang Goo Kang, Ah Hyun Park, Jang Ho Ha, Young Soo Kim, Joon-Ho Oh, Jeong Min Park, Soo Mee Kim, Seung-Jae Lee, Seung Hee Lee, and Han Soo Kim(KAERI). Fabrication
11:20 Preliminary Study on Conceptual Design Analysis of PCCS for SMART Hae Seong Lee, Soon Joon Hong, Yeon Joon Choo, and Jeong Hee Ha(FNC Tech.) Chun Tae Park, Young In Kim,
Dong Won Lee, Young Dug Bae, Suk Kwon Kim, Hee Yun Shin, Bong Guen Hong, Hyun Kyu Jung, Yang Il Jung, Jeong Yong Park, Byung Kwon Choi, and Yong Hwan Jeong(KAERI). P07B04
P01B24 Preliminary Drop Time Analysis of a Control Rod Using CFD Code Myoung Hwan Choi, Jin Seok Park, and Won Jae Lee(KAERI)..
Sang-Keun Woo, Yong Jin Lee, WonHo Lee, Min Hwan Kim, Ji Ae Park, In Ok Ko, Jin Su Kim, Jong Guk Kim, Young Hoon Ji, Joo Hyun Kang, Gi Jeong Cheon, Chang Woon Choi, Sang Moo
