440
Open Access
Relation Between High-Sensitivity C-Reactive Protein and
Coronary Plaque Components in Patients With Acute Coronary Syndrome: Virtual Histology-Intravascular Ultrasound Analysis
Young Joon Hong, MD, Myung Ho Jeong, MD, Yun Ha Choi, RN, Suk Hee Cho, PhD, Seung Hwan Hwang, MD, Jum Suk Ko, MD, Min Goo Lee, MD, Keun Ho Park, MD, Doo Sun Sim, MD, Nam Sik Yoon, MD,
Hyun Ju Yoon, MD, Kye Hun Kim, MD, Hyung Wook Park, MD, Ju Han Kim, MD,
Youngkeun Ahn, MD, Jeong Gwan Cho, MD, Jong Chun Park, MD, and Jung Chaee Kang MD
Heart Center of Chonnam National University Hospital, Chonnam National University Research Institute of Medical Sciences, Gwangju, Korea
ABSTRACT
Background and Objectives: We used virtual histology-intravascular ultrasound (VH-IVUS) to evaluate the relationship be- tween high-sensitivity C-reactive protein (hs-CRP) levels and plaque components in 279 acute coronary syndrome (ACS) pa- tients. Subjects and Methods: We divided patients into three groups according to their hs-CRP levels {lowest tertile <0.07 mg/dL (n=93), middle tertile ≥0.07, <0.4 mg/dL (n=93), and highest tertile ≥0.4 mg/dL (n=93)}. Thin-cap fibroatheroma (TCFA) was defined as focal, necrotic core (NC)-rich (≥10% of the cross-sectional area) plaques in contact with the lumen in a plaque burden ≥40%. Results: The highest tertile group was mostly diabetics (20%, 27%, 40%, p=0.009), and had the greatest plaque plus media volume (163±139/mm3 vs. 201±155/mm3 vs. 232±176/mm3, p=0.013). The highest tertile group had the greatest absolute and % NC volumes (13.6±15.1 mm3 vs. 14.8±14.2 mm3 vs. 23.7±24.3 mm3, p<0.001, and 14.9±8.7% vs.
16.0±8.7% vs. 19.5±10.2%, p=0.024, respectively). The culprit lesion TCFA was observed most frequently in the highest ter- tile group (28% vs. 35% vs. 55%, p=0.006). By multivariable analysis, absolute NC volume was an independent predictor of hs- CRP elevation {odds ratio (OR); 1.03, 95% confidence interval (CI)=1.06-1.21, p=0.004}, and hs-CRP was an independent pre- dictor of TCFA (OR; 1.86, 95% CI=1.11-2.90, p=0.010). Conclusion: VH-IVUS analysis has demonstrated that ACS patients with elevated hs-CRP have more vulnerable plaque component (NC-rich plaques and higher frequency of culprit lesion TCFA), compared with ACS patients with normal hs-CRP. (Korean Circ J 2011;41:440-446)
KEY WORDS: Acute coronary syndrome; Plaque, atherosclerotic; Inflammation; Ultrasonography, interventional.
Received: July 15, 2010 Accepted: September 1, 2010
Correspondence: Myung Ho Jeong, MD, Heart Research Center of Ch- onnam National University Hospital, Chonnam National University Re- search Institute of Medical Sciences, 671 Jaebong-ro, Dong-gu, Gwang- ju 501-757, Korea
Tel: 82-62-220-6243, Fax: 82-62-228-7174 E-mail: [email protected]
• The authors have no financial conflicts of interest.
cc This is an Open Access article distributed under the terms of the Cre- ative Commons Attribution Non-Commercial License (http://creativecom- mons.org/licenses/by-nc/3.0) which permits unrestricted non-commer- cial use, distribution, and reproduction in any medium, provided the origi- nal work is properly cited.
Introduction
Vascular inflammation plays a pivotal role in atherogenesis and thrombotic events.1) High-sensitivity C-reactive protein
(hs-CRP) has been associated with metabolic syndrome2) and with elevated risks for the development of coronary artery disease.3) hs-CRP has emerged as a simple tool for detecting systemic inflammation in patients with subsequent coronary events.4) Measurement of hs-CRP has been recommended for patients to refine risk assessment.5)
Several grey-scale intravascular ultrasound (IVUS) studies have demonstrated increased incidence of culprit-lesion pla- que rupture in patients with acute coronary syndrome (ACS).6-8) There is a strong inflammatory response to tissue injury that occurs during ACS, and plaque rupture and the extent of in- flammatory response may be an important determinant of clinical outcome.9) Several studies have reported that CRP elevation was associated with culprit lesion plaque rupture in ACS patients.6)7)10) Recently, several virtual histology (VH)-
IVUS studies have demonstrated coronary plaque compon- ents in ACS patients.11)12)
In spite of the strong association between CRP levels and vulnerable plaque using grey-scale IVUS, no studies have de- monstrated a relationship between inflammatory response indicated by CRP, and plaque characteristics in ACS pa- tients. Therefore, the aim of this study was to assess the rela- tionship between hs-CRP levels and plaque characteristics, including plaque composition, and the incidence of thin-cap fibroatheroma (TCFA) in ACS patients.
Subjects and Methods
Patient population
This study was a retrospective, single-center study. From July 2007 to June 2008, 279 consecutive ACS patients who un- derwent VH-IVUS for native, de novo coronary lesions and underwent pre-procedural hs-CRP evaluation were includ- ed in this study. We divided patients into three groups ac- cording to their pre-procedural hs-CRP levels {lowest tertile
<0.07 mg/dL (n=93), middle tertile ≥0.07, <0.4 mg/dL (n=
93), and highest tertile >0.4 mg/dL (n=93)}. The presence of unstable angina was determined by chest pain within the preceding 72 hours with or without ST-T-wave changes, or positive cardiac biochemical markers (creatine kinase-myo- cardial band or cardiac specific troponin-I). The presence of ST-segment elevation myocardial infarction was determined by >30 minutes of continuous chest pain, new ST-segment elevation ≥2 mm on at least 2 contiguous electrocardiogra- phic leads, and creatine kinase-MB (CK-MB) >3 times the normal limit. The presence of non-ST-segment elevation myo- cardial infarction was diagnosed by chest pain, and positive cardiac biochemical markers (creatine kinase-myocardial band or cardiac specific troponin-I) without new ST-segment elevation. The protocol was approved by the institutional re- view board. Hospital records of patients were reviewed to ob- tain information on clinical demographics.
Laboratory analysis
Venous blood samples were obtained before the IVUS st- udy within 24 hours of symptom onset. Blood samples were centrifuged, and serum was removed and stored at -70°C until the assay could be performed. hs-CRP was assessed by the immunoturbidimetric CRP-Latex (II) hs assay using an Olympus 5431 autoanalyzer. The assay was performed ac- cording to the manufacturer’s protocol, and has been vali- dated against the Dade-Behring method.13) This assay has a coefficient of variation of 5%. Serum N-terminal pro-B-type natriuretic peptide was measured using an electrochemilu- minescence sandwich immunoassay method with an Elecsys 2010 analyzer (Roche Diagnostics, Mannheim, Germany).
Absolute CK-MB levels were determined by radioimmuno-
assay (Dade Behring Inc., Miami, FL, USA). Cardiac-specif- ic troponin I levels were measured by paramagnetic particle, chemiluminescent immunoenzymatic assay (Beckman, Co- ulter Inc., Fullerton, CA, USA). The serum levels of total cho- lesterol, triglyceride, low-density lipoprotein-cholesterol (LDL- C), and high-density lipoprotein cholesterol were measured by standard enzymatic methods.
Angiographic analysis
Coronary angiogram was analyzed with a validated quan- titative coronary angiography (QCA) system (Phillips H5000 or Allura DCI program, Philips Medical Systems, Eindho- ven, the Netherlands). The outer diameter of the contrast- filled catheter was the calibration standard. Minimal lumen and reference diameters were measured in diastolic frames from orthogonal projections.
Intravascular ultrasound imaging and analysis All pre-intervention grey-scale and VH-IVUS examina- tions were performed after intracoronary administration of 300 μg nitroglycerin. A 20-MHz, 2.9F IVUS imaging cathe- ter (Eagle Eye, Volcano Corp, Rancho Cordova, CA, USA) was advanced >10 mm beyond the lesion. Automated pullback was performed to a point >10 mm proximal to the lesion at a speed of 0.5 mm/sec.
Quantitative volumetric grey-scale and VH-IVUS analyses were performed across the entire lesion segment, and cross- sectional analysis was performed at the minimum lumen sites.
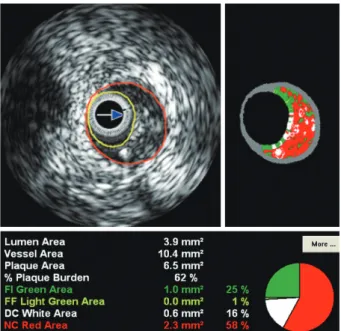
Conventional quantitative volumetric grey-scale IVUS anal- ysis was performed according to the American College of Cardiology Clinical Expert Consensus Document on Stan- dards for Acquisition, Measurement and Reporting of Intra- vascular Ultrasound Studies.14) External elastic membrane (EEM) and lumen cross-sectional areas (CSAs) were measur- ed. Plaque plus media (P&M) CSA was calculated as EEM minus lumen CSA. Plaque burden was calculated as P&M divided by EEM CSA. Proximal and distal references were the single slices with the largest lumen and smallest plaque bur- den within 10 mm proximally and distally, but before any lar- ge side branch. VH-IVUS analysis classified color-coded tis- sue into four major components: green (fibrotic); yellow-gre- en (fibro-fatty); white (dense calcium); and red (necrotic core, NC) (Fig. 1).11)15) VH-IVUS analysis was reported in abso- lute quantity, and as a percentage of the plaque area or volume.
TCFA was defined as NC ≥10% of plaque area in at least 3 consecutive frames without overlying fibrous tissue, in the presence of ≥40% plaque burden.11)
Statistical analysis
The Statistical Package for the Social Sciences (SPSS) for Windows, version 15.0 (Chicago, IL, USA) was used for all an- alyses. Continuous variables were presented as mean±SD;
comparisons were conducted by Student’s t-test or the Wil- coxon rank-sum test if normality assumption was violated.
Discrete variables were presented as percentages and frequ- encies. Comparisons were conducted by chi-square statistics or Fisher’s exact test as appropriate. Multivariable analysis was performed to identify independent predictors of hs- CRP elevation (≥0.4 mg/dL), and culprit lesion TCFA. A p<
0.05 was considered statistically significant.
Results
Patient characteristics
Patient baseline characteristics are summarized in Table 1.
Mean hs-CRP levels were 0.04 mg/dL in lowest tertile group, 0.19 mg/dL in middle tertile group, and 1.85 mg/dL in high- est tertile group. Ejection fraction was lowest, N-terminal pro- B-type natriuretic peptide, white blood cell count, glucose, low-density lipoprotein cholesterol, and triglyceride levels were highest, hemoglobin level was lowest, and CK-MB and Fig. 1. The example of virtual histology-intravascular ultrasound
image.
Table 1. Baseline characteristics
Lowest tertile (n=93) Middle tertile (n=93) Highest tertile (n=93) p
hs-CRP (mg/dL) 0.04±0.02 0.19±0.09 1.85±2.59 <0.001
Age (years) 62±10 60±12 58±13 <0.060
Male gender (%) 61 (66) 69 (74) 64 (69) <0.4
Clinical presentation (%) <0.7
Unstable angina 45 (48) 40 (43) 37 (40)
NSTEMI 26 (28) 28 (30) 26 (28)
STEMI 22 (24) 25 (27) 30 (32)
Diabetes mellitus (%) 19 (20) 25 (27) 37 (40) <0.003
Hypertension (%) 73 (79) 76 (82) 79 (85) <0.5
Smoking (%) 37 (40) 39 (42) 35 (38) <0.8
Family history of coronary artery disease (%) 5 (5) 3 (3) 2 (2) <0.5
Prior MI (%) 4 (4) 3 (3) 3 (3) <0.9
Ejection fraction (%) 64±70 62±90 59±90 <0.001
NT-pro-BNP (pg/mL) 93±94 229±264 688±769 <0.001
White blood cell (/mm3) 6324±1376 9401±3399 9491±2818 <0.001
Hemoglobin (g/dL) 13.2±1.70 12.8±1.30 12.2±1.90 <0.001
Platelet count (103/mm3) 225±480 234±570 243±130 <0.4
Creatinine (mg/dL) 0.84±0.18 0.88±0.16 0.87±0.26 <0.4
Glucose (mg/dL) 138±530 134±330 154±540 <0.031
Creatine kinase-MB (U/L) 4.9±1.9 15.2±15.2 27.6±17.6 <0.001
Troponin-I (ng/mL) 0.05±0.14 3.9±6.2 10.8±10.6 <0.001
Total cholesterol (mg/dL) 174±380 186±510 198±340 <0.001
Triglyceride (mg/dL) 95±55 126±890 142±610 <0.001
LDL-C (mg/dL) 113±350 117±430 132±280 <0.001
HDL-C (mg/dL) 49±10 49±13 47±13 <0.6
hs-CRP: high-sensitivity C-reactive protein, NSTEMI: non-ST segment elevation myocardial infarction, STEMI: ST segment elevation myocar- dial infarction, MI: myocardiol infraction, NT-pro-BNP: N-terminal pro-B-type natriuretic peptide, LDL-C: low density lipoprotein-choles- terol, HDL-C: high density lipoprotein-cholesterol
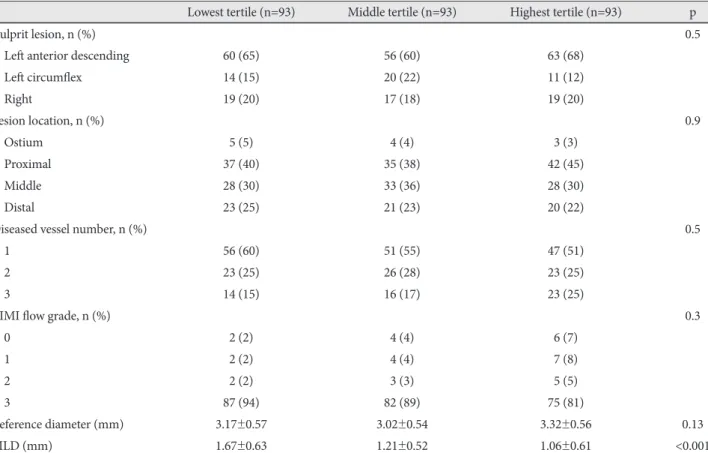
Table 2. Coronary angiographic findings
Lowest tertile (n=93) Middle tertile (n=93) Highest tertile (n=93) p
Culprit lesion, n (%) 0.5
Left anterior descending 60 (65) 56 (60) 63 (68)
Left circumflex 14 (15) 20 (22) 11 (12)
Right 19 (20) 17 (18) 19 (20)
Lesion location, n (%) 0.9
Ostium 5 (5) 4 (4) 3 (3)
Proximal 37 (40) 35 (38) 42 (45)
Middle 28 (30) 33 (36) 28 (30)
Distal 23 (25) 21 (23) 20 (22)
Diseased vessel number, n (%) 0.5
1 56 (60) 51 (55) 47 (51)
2 23 (25) 26 (28) 23 (25)
3 14 (15) 16 (17) 23 (25)
TIMI flow grade, n (%) 0.3
0 2 (2) 4 (4) 6 (7)
1 2 (2) 4 (4) 7 (8)
2 2 (2) 3 (3) 5 (5)
3 87 (94) 82 (89) 75 (81)
Reference diameter (mm) 3.17±0.57 3.02±0.54 3.32±0.56 0.13
MLD (mm) 1.67±0.63 1.21±0.52 1.06±0.61 <0.001
TIMI: Thrombolysis in Myocardial Infarction, MLD: minimal lumen diameter Table 3. Grey-scale intravascular ultrasound findings
Lowest tertile (n=93) Middle tertile (n=93) Highest tertile (n=93) p Proximal reference
EEM CSA (mm2) 19.9±6.8 19.0±6.3 21.2±6.8 0.10
Lumen CSA (mm2) 12.4±8.0 11.6±6.7 13.1±8.5 0.4
P&M CSA (mm2) 07.5±3.5 07.4±2.9 08.1±3.7 0.12
Plaque burden (%) 37±9 38±8 37±8 0.6
Minimum lumen site
EEM CSA (mm2) 16.5±6.5 15.9±5.8 17.8±7.2 0.13
Lumen CSA (mm2) 07.2±4.5 06.3±3.5 06.9±3.5 0.3
P&M CSA (mm2) 09.3±3.4 09.6±4.2 11.0±5.1 0.020
Plaque burden (%) 057±13 060±13 061±13 0.18
IVUS lesion length (mm) 018±13 021±12 024±14 0.016
Distal reference
EEM CSA (mm2) 16.4±7.3 15.2±6.5 17.5±7.6 0.11
Lumen CSA (mm2) 10.3±4.7 09.3±4.1 10.9±4.6 0.075
P&M CSA (mm2) 06.1±3.2 05.8±2.7 06.7±3.8 0.2
Plaque burden (%) 37±8 38±7 37±8 0.5
Volumetric analysis (mm3)
EEM volume 0332±245 0405±296 0544±361 0.031
Lumen volume 0169±110 0201±144 0233±174 0.012
P&M volume 0163±139 0201±155 0232±176 0.013
EEM: external elastic membrane, CSA: cross-sectional area, P&M: plaque plus media, IVUS: intravascular ultrasound
troponin I levels were highest in the highest tertile group.
Angiographic findings
Angiographic findings are summarized in Table 2. There were no significant differences in the culprit vessel, lesion lo- cation, the incidences of multivessel disease, Thrombolysis in Myocardial Infarction flow grade, and reference diameter be- tween three groups. However, minimal lumen diameter was smallest in the highest tertile group.
Grey-scale intravascular ultrasound results
Grey-scale IVUS findings are summarized in Table 3. There were no significant differences in the IVUS parameters at the proximal and distal references. At the minimum lumen sites, P&M CSAs were greatest and IVUS lesion length was longest in the highest tertile group. Plaque rupture and mul- tiple plaque ruptures were observed most frequently in the highest tertile group (28% vs. 36% vs. 51%, p<0.001, and 15%
vs. 22% vs. 30%, p=0.014, respectively). By volumetric analy- sis, EEM, lumen, and P&M volumes were greatest in the high- est tertile group.
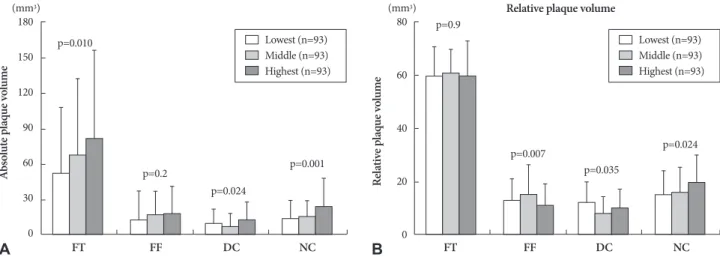
Virtual histology-intravascular ultrasound results At the minimum lumen sites, absolute and %NC areas were greatest in the highest tertile group (Fig. 2). By volumetric an- alysis, absolute and %NC volumes were greatest in the high- est tertile group (Fig. 3). The TCFA within culprit lesions was observed most frequently in the highest tertile group (Fig. 4).
Independent predictors of high-sensitivity C-reactive protein elevation and thin-cap fibroatheroma
Multivariate analysis was performed to identify independent predictors of hs-CRP elevation. Variables with p<0.2 in the univariate analysis (age, diabetes mellitus, ejection fraction, N-terminal pro-B-type natriuretic peptide, white blood cell count, hemoglobin, serum glucose, troponin-I, LDL-C, P&M volume, IVUS lesion length, volumetric VH-IVUS parame- ters: absolute FT, DC and NC volumes, relative FF, DC, and NC volumes) were evaluated for multivariate analysis. Dia- betes mellitus {odds ratio (OR): 2.73, 95% confidence interval (CI): 1.20-5.42, p=0.009}, N-terminal pro-B-type natriuretic peptide (OR; 1.24, 95% CI=1.12-1.36, p=0.008) and absolute NC volume (OR; 1.03, 95% CI=1.06-1.21, p=0.004) were in-
Lowest (n=93) Middle (n=93) Highest (n=93) 10
8 6 4 2 0
80
60
40
20
0
Absolute plaque areaAbsolute plaque volume Relative plaque areaRelative plaque volume
(mm2 ) (mm2 )
A B
Lowest (n=93) Middle (n=93) Highest (n=93)
FT FF DC NC FT FF DC NC
p=0.035
p=0.3
p=0.010
p=0.007
p=0.6
p=0.046
p=0.042
p=0.029
Fig. 2. The absolute and relative plaque components at the minimum lumen sites. FT: fibrotic, FF: fibro-fatty, DC: dense calcium, NC: necrotic core.
Lowest (n=93) Middle (n=93) Highest (n=93)
Lowest (n=93) Middle (n=93) Highest (n=93) 180
150 120 90 60 30 0
80
60
40
20
0
Relative plaque volume
(mm3) (mm3)
A FT FF DC NC B FT FF DC NC
p=0.010
p=0.2
p=0.024
p=0.001
p=0.9
p=0.007
p=0.035
p=0.024
Fig. 3. The volumetric absolute and relative plaque components. FT: fibrotic, FF: fibro-fatty, DC: dense calcium, NC: necrotic core.
dependent predictors of hs-CRP elevation.
We performed multivariate analysis to determine indepen- dent predictors of culprit lesion TCFA. All variables with p<
0.2 in the univariate analysis (age, male gender, diabetes mel- litus, hypertension, smoking, ejection fraction, hs-CRP, and P&M volume) were evaluated for multivariate analysis. Dia- betes mellitus (OR: 2.14, 95% CI: 1.30-3.60, p=0.008) and the hs-CRP (OR; 1.86, 95% CI=1.11-2.90, p=0.010) were indepen- dent predictors of TCFA.
Discussion
The present VH-IVUS study demonstrated that 1) the hi- ghest hs-CRP tertile group has the most diabetics, and had the greatest P&M volume as well as absolute and % NC vol- umes; 2) the culprit lesion TCFA was observed most frequ- ently in the highest hs-CRP tertile group; 3) absolute NC vol- ume was an independent predictor of hs-CRP elevation; and 4) the hs-CRP was an independent predictor of TCFA.
CRP has emerged as a simple tool for detecting systemic in- flammation.4) An elevated CRP level is associated with in- creased risk of future fatal or non-fatal ischemic complications in ACS patients.16)17) A previous study demonstrated that CRP was strongly associated with atherosclerosis measured at vari- ous sites in the arterial tree.18) Several mechanisms have been described through which CRP and other inflammatory me- diators may be actively involved in atherogenesis.19) CRP is produced by smooth muscle cells of atherosclerotic lesions,20) and locally produced CRP could directly participate in athero- genesis and the development of cardiovascular complications.
Pathological studies have demonstrated that plaque rupture and subsequent thrombosis is the most important mecha- nism leading to ACS.21)22) Several grey-scale IVUS studies have demonstrated the association between CRP and vul- nerable plaque in ACS patients.6)7)10) Sano et al.6) reported that patients with elevated CRP levels had more plaque ruptures, compared with those with a normal CRP, and that plaque rup-
ture correlated with elevated CRP level in the setting of AMI.
Hong et al.7) reported that elevated CRP level was an indepen- dent predictor of plaque rupture in AMI patients using a 3- vessel IVUS. Tanaka et al.10) reported that AMI patients with culprit lesion plaque ruptures presented with higher CRP le- vels, as compared with AMI patients without plaque rupture.
The number of plaque ruptures correlated with CRP levels one month from onset.
VH-IVUS has the potential to provide detailed qualitative and quantitative information, and it can help identify four spe- cific plaque components. Plaque components may play a role in plaque disruption and thrombosis that lead to acute coro- nary events.23)24) Lesions with a large lipid core may present higher risk of disruption than sclerotic plaques.25)26) TCFA is the precursor of plaque rupture, which accounts for a majo- rity of coronary thrombi and coronary death.23)27)28) Several VH-IVUS studies have reported that ACS patients had more NC-containing plaques, and more TCFAs compared with stable angina patients.11)12) Burke et al.29) reported correlation between CRP and the number of TCFAs in patients who ex- perienced sudden death associated with severe coronary ar- tery disease. In the present study, the NC component was gr- eatest, and TCFA within culprit lesions was observed most frequently in patients with the highest hs-CRP tertile, and there existed a correlation between hs-CRP levels vs. NC com- ponents and TCFA, and cardiac enzyme levels were signifi- cantly higher after stenting in patients with TCFA, compar- ed with patients without TCFA {∆(poststenting-baseline value) CK-MB: +10.1±22.0 U/L vs. -3.8±26.1 U/L, p=0.012; ∆cardiac- specific troponin I: +8.3±15.5 ng/mL vs. -0.9±11.4 ng/mL, p=
0.021}. The present study suggests that hs-CRP is associated with the development of vulnerable plaque in ACS patients.
The NC components contain foam cells with lipid deposi- tion, inflammatory cells, intramural bleeding, and cholesterol crystals. As such, they may be associated with CRP elevation in ACS patients.
There are several limitations to be mentioned. First, the pre- sent study is a retrospective single-center study and is subject to limitations inherent in this type of clinical investigation. Se- cond, IVUS and VH-IVUS were performed at the discretion of individual operators leading to potential selection bias.
Third, we did not attempt to differentiate between athero- sclerotic plaque and thrombus, because VH-IVUS could not de- termine the presence of thrombus. This may obscure the identification of TCFA.
Fourth, heavily calcified plaques may induce an artifact re- garding the codification of plaques by VH-IVUS, resulting in increased NC content. Fifth, serial follow-up of serum hs-CRP level was not performed. Therefore, we did not demonstrate the impact of sequential change of hs-CRP levels on plaque components.
In conclusion, ACS patients with elevated hs-CRP have more
60 50 40 30 20 10 0
Thin-cap fibroatheroma
(mm2 )
Lowest (n=93) Middle (n=93) Highest (n=93) Fig. 4. The incidence of thin-cap fibroatheroma.
p=0.006
28
35
55
vulnerable plaque components (NC-rich plaques and higher frequency of culprit lesion TCFA), compared with ACS pa- tients with normal hs-CRP.
Acknowledgments
This study was supported by a grant (K00060-282) from the Funda- mental R&D Program for Core Technology of Materials funded by the Ministry of Knowledge Economy, Republic of Korea.
REFERENCES
1) Choi H, Cho DH, Shin HH, Park JB. Association of high sensitivity C-reactive protein with coronary heart disease prediction, but not with carotid atherosclerosis, in patients with hypertension. Circ J 2004;
68:297-303.
2) Nakanishi N, Shiraishi T, Wada M. C-reactive protein concentration is more strongly related to metabolic syndrome in women than in men:
the Minoh Study. Circ J 2005;69:386-91.
3) Ridker PM, Glynn RJ, Hennekens CH. C-reactive protein adds to the predictive value of total and HDL cholesterol in determining risk of first myocardial infarction. Circulation 1998;97:2007-11.
4) Morrow DA, Braunwald E. Future of biomarkers in acute coronary syn- dromes: moving toward a multimarker strategy. Circulation 2003;
108:250-2.
5) Pearson TA, Mensah GA, Alexander RW, et al. Markers of inflamma- tion and cardiovascular disease: application to clinical and public he- alth practice: a statement for healthcare professionals from the Cen- ters for Disease Control and Prevention and the American Heart As- sociation. Circulation 2003;107:499-511.
6) Sano T, Tanaka A, Namba M, et al. C-reactive protein and lesion mor- phology in patients with acute myocardial infarction. Circulation 2003;108:282-5.
7) Hong MK, Mintz GS, Lee CW, et al. Comparison of coronary plaque rupture between stable angina and acute myocardial infarction: a three-vessel intravascular ultrasound study in 235 patients. Circula- tion 2004;110:928-33.
8) Hur SH. Lesion characteristics in patients with acute coronary syn- drome: a comparison with lesion in patients with stable angina by in- travascular ultrasound. Korean Circ J 2004;34:548-57.
9) Nian M, Lee P, Khaper N, Liu P. Inflammatory cytokines and post- myocardial infarction remodeling. Circ Res 2004;94:1543-53.
10) Tanaka A, Shimada K, Sano T, et al. Multiple plaque rupture and C- reactive protein in acute myocardial infarction. J Am Coll Cardiol 2005;45:1594-9.
11) Rodriguez-Granillo GA, García-García HM, Mc Fadden EP, et al. In vivo intravascular ultrasound-derived thin-cap fibroatheroma detection using ultrasound radiofrequency data analysis. J Am Coll Cardiol 2005;46:2038-42.
12) Bae JH, Kwon TG, Kim KH, Hyun DW, Kim KY, Kim DS. In-vivo coronary plaque composition in patients with acute coronary syndro- me: a virtual histology intravascular ultrasound study. Korean Circ J 2007;37:437-42.
13) Roberts WL, Moulton L, Law TC, et al. Evaluation of nine automated high-sensitivity C-reactive protein methods: implications for clinical and epidemiological applications. Part 2. Clin Chem 2001;47:418-25.
14) Mintz GS, Nissen SE, Anderson WD, et al. American College of Car- diology Clinical Expert Consensus Document on Standards for Acqu- isition, Measurement and Reporting of Intravascular Ultrasound Stu- dies (IVUS): a report of the American College of Cardiology Task For- ce on Clinical Expert Consensus Documents. J Am Coll Cardiol 2001;37:
1478-92.
15) Bae JH, Rihal CS, Lerman A. Tissue characterization of coronary pla- ques using intravascular ultrasound/virtual histology. Korean Circ J 2006;36:553-8.
16) Blake GJ, Ridker PM. C-reactive protein and other inflammatory risk markers in acute coronary syndromes. J Am Coll Cardiol 2003;41(4 Suppl S):37S-42S.
17) James SK, Armstrong P, Barnathan E, et al. Troponin and C-reactive protein have different relations to subsequent mortality and myocardial infarction after acute coronary syndrome: a GUSTO-IV substudy. J Am Coll Cardiol 2003;41:916-24.
18) van der Meer IM, de Maat MP, Bots ML, et al. Inflammatory media- tors and cell adhesion molecules as indicators of severity of atherosc- lerosis: the Rotterdam Study. Arterioscler Thromb Vasc Biol 2002;22:
838-42.
19) Libby P, Ridker PM, Maseri A. Inflammation and atherosclerosis. Cir- culation 2002;105:1135-43.
20) Jabs WJ, Theissing E, Nitschke M, et al. Local generation of C-reac- tive protein in diseased coronary artery venous bypass grafts and nor- mal vascular tissue. Circulation 2003;108:1428-31.
21) Davies MJ, Thomas A. Thrombosis and acute coronary-artery lesions in sudden cardiac ischemic death. N Engl J Med 1984;310:1137-40.
22) Farb A, Burke AP, Tang AL, et al. Coronary plaque erosion without ru- pture into a lipid core: a frequent cause of coronary thrombosis in sud- den coronary death. Circulation 1996;93:1354-63.
23) Virmani R, Kolodgie FD, Burke AP, Farb A, Schwartz SM. Lessons from sudden coronary death: a comprehensive morphological classifica- tion scheme for atherosclerotic lesions. Arterioscler Thromb Vasc Biol 2000;20:1262-75.
24) Falk E, Shah PK, Fuster V. Coronary plaque disruption. Circulation 1995;92:657-71.
25) Davies MJ, Richardson PD, Woolf N, Katz DR, Mann J. Risk of throm- bosis in human atherosclerotic plaques: role of extracellular lipid, mac- rophage, and smooth muscle cell content. Br Heart J 1993;69:377-81.
26) Buja LM, Willerson JT. Role of inflammation in coronary plaque dis- ruption. Circulation 1994;89:503-5.
27) Virmani R, Burke AP, Kolodgie FD, Farb A. Pathology of the thin-cap fibroatheroma: a type of vulnerable plaque. J Interv Cardiol 2003;16:
267-72.
28) Virmani R, Burke AP, Farb A, Kolodgie FD. Pathology of the vulner- able plaque. J Am Coll Cardiol 2006;47(8 Suppl):C13-8.
29) Burke AP, Tracy RP, Kolodgie F, et al. Elevated C-reactive protein va- lues and atherosclerosis in sudden coronary death: association with different pathologies. Circulation 2002;105:2019-23.