Korean Circulation Journal
Introduction
Atrial fibrillation (AF) is one of the most common cardiac arrhy- thmias. Over time, it has been understood as a prothrombotic dis- ease.
1)2)According to Virchow’s triad, three conditions must be present for thrombosis to occur, and all of the three conditions are present in AF: loss of atrial contractility, endocardial damage, and abnormalities in hemostatic variables.
3)However, although both atria
http://dx.doi.org/10.4070/kcj.2014.44.4.233 Print ISSN 1738-5520 • On-line ISSN 1738-5555
Histological and Biochemical Comparisons between Right Atrium and Left Atrium in Patients with Mitral Valvular Atrial Fibrillation
Jae Hyung Park, PhD, Jihei Sara Lee, BSc, Young-Guk Ko, MD, Seung Hyun Lee, MD, Beom Seob Lee, BSc, Seok-Min Kang, MD, Byung Cheol Chang, MD, and Hui-Nam Pak, MD
Division of Cardiology, Yonsei University Health System, Seoul, Korea
Background and Objectives: It has been known that the dominant driver of atrial fibrillation (AF) exists in the left atrium (LA) and the incidence of systemic thromboembolism is higher than that of pulmonary thromboembolism in patients with AF. Therefore, we hypothe- sized that histological and biochemical characteristics of the LA and the right atrium (RA) are different in patients with mitral valvular AF.
Subjects and Methods: We analyzed the histology and messenger ribonucleic acid (mRNA) or protein expression associated with endo- thelial function and thrombogenesis in 33 human atrial appendage tissues (20 LA tissues, 13 RA tissues) taken from 25 patients {57.7±11.3 years old, 44% males, AF: sinus rhythm (SR)=17:8} with mitral valve disease. We also performed whole mRNA quantification in 8 tissues (both LA and RA tissues from 4 patients) by using next generation sequencing (NGS).
Results: 1) The degree of fibrosis (p=0.001) and subendocardial smooth muscle thickness (p=0.004) were significantly greater in the LA than in the RA. 2) More advanced matrix fibrosis was found in the LA of patients with AF than in the LA of patients with SR (p=0.046), but not in the RA. 3) There was no LA-RA difference in protein (Western blot) and mRNA {quantitative real-time polymerase chain reac- tion (qRT-PCR)} expressions of NF-κB, 3-NT, CD31, E-selectin, inducible NO synthase, stromal cell-derived factor-1α, Endothelin-1, plate- let-derived growth factor, myeloperoxidase, or NCX, except for higher mRNA expression of HCN4 in the RA (qRT-PCR, p=0.026) and that of KCNN1 in the LA (NGS, p=0.016).
Conclusion: More advanced matrix and subendocardial remodeling were noticed in the LA than in the RA in patients with mitral valvular AF. However, the expressions of tissue factors associated with thrombogenesis were not significantly different between the RA and the LA. (Korean Circ J 2014;44(4):233-242)
KEY WORDS: Atrial fibrillation; Mitral valve disease; Fibrosis; Subendocardium.
Received: February 15, 2014 / Revision Received: March 29, 2014 / Accepted: June 9, 2014 Correspondence:
Hui-Nam Pak, MD, Division of Cardiology, Yonsei University Health System, 50-1 Yonsei-ro, Seodaemun-gu, Seoul 120-752, Korea Tel: 82-2-2228-8459, Fax: 82-2-2227-7732, E-mail: [email protected]
Young-Guk Ko, MD, Division of Cardiology, Yonsei University Health System, 50-1 Yonsei-ro, Seodaemun-gu, Seoul 120-752, Korea Tel: 82-2-2228-8460, Fax: 82-2-393-2041, E-mail: [email protected]
• The authors have no financial conflicts of interest.
This is an Open Access article distributed under the terms of the Creative Commons Attribution Non-Commercial License (http://creativecommons.org/licenses/
by-nc/3.0) which permits unrestricted non-commercial use, distribution, and reproduction in any medium, provided the original work is properly cited.
fibrillate in AF, growing evidence suggests that the majority of th-
rombi originate in the left atrium (LA). Several studies have investi-
gated the characteristics that make the LA more prone to throm-
bosis than the right atrium (RA) during AF. For example, Cai et al.
4)have reported that the level of nitric oxide (NO), a vasodilator and an
antithrombotic agent, was markedly decreased in porcine LA and
LA appendage (LAA) during AF compared to that in LA showing si-
nus rhythm (SR), RA, and aorta. In line with the results of this study,
Dudley et al.
5)found that the superoxide (O
2-) level was increased in the LA, suggesting greater NO degradation in the LA than in the RA during AF. Downstream of NO, several factors are known to be involved in inflammation, thrombosis, as well as in remodeling. Stro- mal cell-derived factor-1 (SDF-1)
6)and endothelin-1 (ET-1)
7)are pro- moters of platelet activity;
8-10)E-selectin and CD31 (PECAM) enable platelet aggregation and activation;
11)12)and platelet-derived growth factor (PDGF) mediates fibrosis.
13)All of these molecules are, at least in part, regulated by NO.
6)14)In addition, myeloperoxidase (MPO) was also recently found to mediate structural as well as electrical remo- deling of atria during AF.
15)While a number of studies have attempt- ed to compare between the LA and the RA, differences between the two chambers in terms of vessel wall characteristics still remain elu- sive. Therefore, in this study, we aimed to compare the degree of fibrosis and expression of NO-mediated platelet activating proteins (pNF-κβ, ET-1, SDF-1), inducible NO synthase (iNOS), proinflamma- tory proteins (E-selectin, CD31), and profibrotic proteins (MPO, PDGF) between the LA and the RA in an attempt to characterize the endocardial changes specific to the LA during AF, and to elucidate the possible mechanism for thrombosis in fibrillating LA (Fig. 1).
Subjects and Methods
Patient selection
The study protocol was approved by the Institutional Review Board of Severance Cardiovascular Hospital, Yonsei University He- alth System. All of the patients provided written informed consent.
The study enrolled 25 patients (mean age 57.7±11.3 years, 44%
males), who underwent mitral valve surgery and biopsy of the LA or the RA appendage (Table 1). Among these patients, 23 had AF and 10 were in SR. Comprehensive transthoracic echocardiography was
performed using commercially available devices (Sonos 5500; Phil- ips Medical System, Andover, MA, USA, or Vivid 7; GE Vingmed Ul- trasound, Horten, Norway). Standard M-mode, two-dimensional and Doppler images were acquired in the parasternal and apical views.
Left atrial (LA) anterior-posterior diameter was measured, and left ventricular (LV) end-diastolic dimension (LVEDD) and LV end-systolic dimension (LVESD) were calculated from two-dimensional images using the modified Quinones method. Full wall thickness specimens were excised from the LA or the RA appendages. All of the myocar- dial specimens were fixed in 70% alcohol and 10% formalin solu- tion immediately after excision.
Immunohistochemical studies
Multiple 5 μm thick serial sections were used. Masson’s trichrome (MT) stain was used to determine the presence and degree of fibro- sis. Immunohistochemical staining was performed using an avidin- biotin peroxidase system (Dako, Carpinteria, CA, USA). Paraffin-em- bedded tissue sections were deparaffinized and then washed with phosphate-buffered saline (PBS). Hydrogen peroxidase block (Dako, Carpinteria, CA, USA) was placed on the sections for 10 minutes, and the slides were washed in PBS. Protein block (Dako, Carpinteria, CA, USA) was placed on the sections for 30 minutes. Primary antibodies were then incubated for 90 minutes at room temperature (approx.
25°C). Antibodies for α-SMA (1:500 dilution, rabbit anti-human polyclonal; Abcam) were used to stain the smooth muscle. After in- cubation, the slides were washed in PBS, and the appropriate sec- ondary antibody (Dako, Carpinteria, CA, USA) was placed on the sec- tions for 30 minutes. The sections were washed again in PBS, and the appropriate chromagen was added to each specimen. Smooth mucle cells and gap junctions were stained brown with 3,3’-diami- nobenzidine (DAB). Cell nuclei were marked by placing the speci- mens in hematoxylin (Merck) for 1 minute. The specimens were then dehydrated in alcohol, mounted, and examined under light micros- copy. The specimens stained with DAB were examined by light mi- croscopy and virtual microscopy. Histopathological slides were an- alyzed by use of a computer-assisted morphometric analysis system (Image-Pro Plus 6.0; Media Cybernetics, Silver Spring, MD, USA).
The selection and analyses of virtual microscopic images were performed by a single technician, who was blinded to the experi- mental information of histological slides obtained with a consis- tent method. To quantify the fibrotic area, we selected the virtual microscopic fields with the fibrotic area on MT staining, and took images at a 160 objective in the quadrants of each slide. In each of the four fields, the smooth muscle area was identified as fibrillar structures positive for α-SMA immunohistostaining, between myo- cardial cells, which were larger than 10 μm and stained brown (RGB values: Red 22–125, Green 4–77, and Blue 4–55). In the endocardium,
Platelet aggregation BMEPC recruitment
Immune cell recruitment
Hypertension endothelial damage
Fibrosis remodeling
PDGF Endothelin-1
E-selectin PECAM-1
(CD31) SDF-1α
Ap-1/Sp-1 NF-κB Egr-1
NO
NO synthase Inflammatory cytokine (ex. TNF-α, IL-1)
Fig. 1. Diagram of the mechanisms of multiple tissue factors associated
with thrombosis. NO: nitric oxide, TNF: tumor necrosis factor, IL: interleukin,
Ap-1/Sp-1: Ap-1/Sp-1 transcription factors, Egr-1: early growth response
protein-1, SDF: stromal cell-derived factor, PECAM: platelet endothelial cell
adhesion molecule, PDGF: platelet-derived growth factor, BMEPC: bone
marrow-derived endothelial progenitor cells.
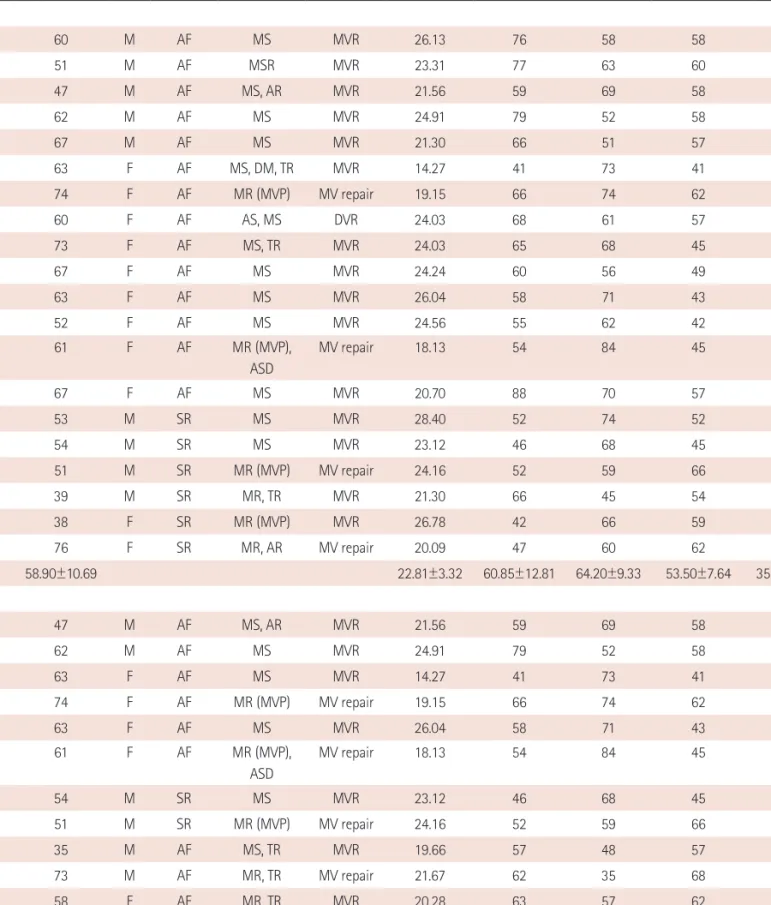
Table 1. Clinical characteristics
Patient # Age Sex Rhythm Existing
conditions Operation BMI (kg/m
2)
LA size
(mm) EF (%) LVEDD
(mm)
LVESD (mm) LA
1 60 M AF MS MVR 26.13 76 58 58 42
2 51 M AF MSR MVR 23.31 77 63 60 41
3 47 M AF MS, AR MVR 21.56 59 69 58 37
4 62 M AF MS MVR 24.91 79 52 58 40
5 67 M AF MS MVR 21.30 66 51 57 42
6 63 F AF MS, DM, TR MVR 14.27 41 73 41 25
7 74 F AF MR (MVP) MV repair 19.15 66 74 62 37
8 60 F AF AS, MS DVR 24.03 68 61 57 40
9 73 F AF MS, TR MVR 24.03 65 68 45 29
10 67 F AF MS MVR 24.24 60 56 49 36
11 63 F AF MS MVR 26.04 58 71 43 27
12 52 F AF MS MVR 24.56 55 62 42 29
13 61 F AF MR (MVP),
ASD
MV repair 18.13 54 84 45 23
14 67 F AF MS MVR 20.70 88 70 57 36
15 53 M SR MS MVR 28.40 52 74 52 31
16 54 M SR MS MVR 23.12 46 68 45 29
17 51 M SR MR (MVP) MV repair 24.16 52 59 66 47
18 39 M SR MR, TR MVR 21.30 66 45 54 42
19 38 F SR MR (MVP) MVR 26.78 42 66 59 39
20 76 F SR MR, AR MV repair 20.09 47 60 62 44
58.90±10.69 22.81±3.32 60.85±12.81 64.20±9.33 53.50±7.64 35.80±6.89
RA
3* 47 M AF MS, AR MVR 21.56 59 69 58 37
4* 62 M AF MS MVR 24.91 79 52 58 40
6* 63 F AF MS MVR 14.27 41 73 41 25
7* 74 F AF MR (MVP) MV repair 19.15 66 74 62 37
11* 63 F AF MS MVR 26.04 58 71 43 27
13* 61 F AF MR (MVP),
ASD
MV repair 18.13 54 84 45 23
16* 54 M SR MS MVR 23.12 46 68 45 29
17* 51 M SR MR (MVP) MV repair 24.16 52 59 66 47
21 35 M AF MS, TR MVR 19.66 57 48 57 43
22 73 M AF MR, TR MV repair 21.67 62 35 68 57
23 58 F AF MR, TR MVR 20.28 63 57 62 45
24 35 F SR MS MVR 17.85 41 55 46 34
25 50 F SR MR MVR 24.14 45 67 52 34
55.85±12.26 21.15±3.35 55.62±10.87 62.46±13.06 54.08±9.26 36.77±9.71
*Overlapping patients in both LA and RA groups. LA: left atrium, RA: right atrium, M: male, F: female, AF: atrial fibrillation, SR: sinus rhythm, MS: mitral ste-
nosis, MR: mitral regurgitation, MVP: mitral valve repair, AR: aortic regurgitation, TR: tricuspid regurgitation, ASD: atrial septal defect, MVR: mitral valve re-
placement, MV repair: mitral valve repair, DVR: double valve replacement, EF: ejection fraction, LVEDD: left ventricular end-diastolic dimension, LVESD: left
ventricular end-systolic dimension, BMI: body mass index
we measured the subendocardial thickness and smooth muscle thickness maintaining distance of 200 μm. The percent immunos- tained areas and distance of the fibrotic area, and α-SMA-positive smooth muscle cells were quantified using Image Pro software 6.0 (Media Cybernetics Inc., Silver Spring, MD, USA). The virtual histology was then analyzed as described before.
16)The percent area of fibrosis was quantified with MT staining utilizing the Image Pro software.
Real-time quantitative polymerase chain reaction
The method used to quantitate cDNA was the quantitative real- time polymerase chain reaction (PCR) method. The levels of cDNA were determined via fluorescence by using the thermal cycler dur- ing the PCR cycle. The real-time PCR reactions were performed us- ing SYBR1 Green Kit in a 20 μL reaction volume containing 50 ng of cDNA. PCR reactions were carried out using a sequence detection
system. Thermal cycling and SYBR Green fluorescence detection were performed using a real-time PCR thermal cycler (ABI PRISM 7500 Sequence Detection System, Applied Biosystems, Foster City, CA, USA). The primers were designed for HCN4 (Forward: GCAGC GCATCCACGACTAC, Reverse: TTAGCTCGCCCAGGATGCT), and NCX (Forward: TTCCAGAATGATGAAATTGTGAAGAT, Reverse: TCCTCAAG CACAAGGGAGAAAC) using the primer express software. The sodium calcium exchanger (NCX) forward primer (5’ to 3’) was TTCCAGA ATGATGAAATTGTGAAGAT and the reverse primer (5’ to 3’) was TCC TCAAGCACAAGGGAGAAAC. Then, 20 μL PCR reactions were pre- pared in 96 well plates with a computer-assisted robotic and liquid handling automated workstation. We chose HCN4 and NCX because they play important roles in arrhythmogenicity and embryological development of the RA and the LA. Thermal cycling conditions were as follows: 50°C for 2 minutes and 95°C for 10 minutes, followed Table 2. Clinical and histological characteristics of the LA and the RA
LA (n=20) RA (n=13) p
Age 58.90±10.69 55.85±12.26 0.455
Sex (male, %) 45.00 42.86 0.950
BMI (kg/m
2) 22.81±3.32 21.15±3.35 0.172
BSA (m
2) 1.64±0.22 1.59±0.23 0.529
Echocardiographic findings
LA size (mm) 60.85±12.81 55.62±10.87 0.234
LA volume (mL) 179.69±101.22 139.75±67.97 0.221
LA volume Index (mL/m
2) 130.70±73.20 91.84±33.64 0.132
LVEF (%) 64.20±9.33 62.46±13.06 0.658
E/Em 16.39±5.89 18.46±5.17 0.554
LVEDD (mm) 53.50±7.64 54.08±9.26 0.847
LVESD (mm) 35.80±6.89 36.77±9.71 0.739
Histologic analyses
Fibrosis (MT) (% area) 23.78±10.22 11.33±6.37 0.001
Subendocardial smooth muscle area (%) 4.39±5.40 0.32±0.58 0.011
Subendocardial smooth muscle thickness (mm) 0.16±0.17 0.01±0.01 0.004
Western blot
pNF-kβ 1.22±0.38 1.02±0.31 0.198
CD31 0.70±0.20 0.78±0.23 0.420
E-selectin 0.97±0.42 0.17±0.35 0.145
iNOS 0.59±0.39 0.62±0.44 0.876
SDF-1α 0.74±0.37 0.61±0.22 0.380
Endothelin-1 0.86±0.27 0.71±0.24 0.218
PDGF 0.53±0.25 0.45±0.06 0.528
MPO 0.74±0.28 0.93±0.55 0.508
Real-time PCR
2
-ΔCt NCX0.012±0.012 0.007±0.005 0.139
2
-ΔCt HCN40.011±0.010 0.027±0.028 0.026
LA: left atrium, RA: right atrium, BMI: body mass index, BSA: body surface area, LVEF: left ventricular ejection fraction, LVEDD: left ventricular end-diastolic
dimension, LVESD: left ventricular end-systolic dimension, MT: Masson’s trichrome, iNOS: inducible NO synthase, SDF-1: stromal cell-derived factor-1,
PDGF: platelet-derived growth factor, MPO: myeloperoxidase, PCR: polymerase chain reaction
by 40 cycles at 95°C for 30 seconds, 60°C for 30 seconds and 72°C for 1 minute. A melting curve analysis was performed after the final PCR cycle to evaluate the presence of nonspecific PCR products and primer dimers. During the initial optimization run, four-fold se- rial dilution was employed to demonstrate the linear amplification range for each gene. The threshold cycle (Ct) represents the PCR cy- cle during which an increase in SYBR Green fluorescence above the baseline signal can be detected first. For each sample, the amount of messenger ribonucleic acid (mRNA) was quantified relative to 0.5 μg of total RNA applied by real-time PCR. Relative quantitation was performed by normalizing Ct values of each sample gene to Ct values of the housekeeping gene (ΔCt). ΔCt corresponds to the dif- ference between the Ct of the gene of interest and the Ct of the housekeeping gene. Also, we tried to perform RNA Sequencing on transformed human tissues.
Next generation sequencing
To compare the amount of proteins and mRNA, we performed whole mRNA quantification in 8 tissues (4 from the LA, 4 from the RA) by using the next generation sequencing (NGS) method. Se- quencing library was prepared using the NEBNext RNA prep kit (NEB, MA, USA). Briefly, the poly-A containing mRNA molecules were purified using poly-T oligonucleotide-attached magnetic beads. The mRNA was fragmented into small pieces and copied into cDNA. Library preparation process including end-repairing and subsequent adapter ligation produced the final library with size ranging from 250–350 bp. Sequencing was performed using HiSeq 2500 (Illumina, CA, USA) with the rapid run 150 bp PE mode.
17)Western blot analysis
For protein analysis, previously excised human LA tissues stored in liquid nitrogen (-80°C) were used. The tissue specimens were homogenized and lysed in a mixture of 50 mmol Tris (pH 7.4), 5 mM EDTA (pH 8.0), and 1% Triton X-100. The samples were centri- fuged at 13000 rpm for 1 hour at 4°C to separate the supernatant.
Protein content was determined by the BCA assay at 55°C. Extracts were separated by SDS-polyacrylamide gel electrophoresis and transferred to polyvinylidene difluoride membranes. After blocking in TBS-Tween 20 (TBS-T, 0.1% tween 20) containing 5% non-fat dry milk, the membrane was incubated overnight with primary anti- bodies; pNF-κβ (1:1000 dilution, mouse antihuman monoclonal; Cell Signaling), CD31 (1:1000 dilution, rabbit antihuman polyclonal; Ab- cam, Cambridge, MA, USA), E-selectin (1:1000 dilution, rabbit anti- human polyclonal; Abcam, Cambridge, MA, USA), iNOS (1:1000 di- lution, Abcam, Cambridge, MA, USA), SDF-1α (1:1000 dilution, rabbit antihuman polyclonal; Abcam, Cambridge, MA, USA), ET-1 (1:1000 dilution, mouse antihuman monoclonal; Thermo Scientific, Hudson, NH, USA), PDGF (1:500 dilution, rabbit antihuman polyclonal; Pierce Biotechnology, Rockford, IL, USA), and MPO (1:1000 dilution, rabbit antihuman polyclonal; Abcam, Cambridge, MA, USA). The primary antibody incubation was followed by incubation with HRP-conju- gated secondary antibodies (Dako, Carpinteria, CA, USA). The anti- gen-antibody bands were detected using the enhanced chemilumi- nescence reagent kit (Millipore Co, Bedford, MA, USA) and quan- tified by densitometry.
Data analysis
Data are expressed as mean±SD. We conducted several comparison
MT stain
α-SMA
A
B
Fig. 2. Masson’s trichrome (MT) staining (A) and α-smooth muscle actin (SMA) staining (B) of AF-LA, SR-LA, AF-RA, and SR-RA. AF: atrial fibrillation, LA: left
atrium, RA: right atrium, SR: sinus rhythm.
analyses on thickness of the subendocardial smooth muscle layer, the fibrotic area, the density of the protein bands in the western blot analysis, and real-time PCR result in various cohorts. The statistical significance of these comparisons was assessed using the Stu- dent’s t-test or the paired t-test. p less than 0.05 were considered statistically significant.
Results
Severe remodeling of the left atrium compared to the right atrium in patients with mitral valve disease
The baseline characteristics of enrolled patients are summarized in Table 1. We divided the patients into a LA group (n=20) and a
RA group (n=13) and compared their clinical and histological char- acteristics (Table 2). The data showed no significant difference in their clinical and echocardiographic characteristics. The percent ar- eas of subendocardial fibrosis (MT stain, p=0.001) and subendocar- dial smooth muscle layer (α-SMA immunostaining, p=0.011) were greater in the LA than in the RA (Fig. 2). Subendocardial smooth muscle thickness was also higher in the LA than in the RA; thus de- monstrating greater structural remodeling in the LA than in the RA (p=0.004) (Table 2).
Differential degree of left atrium remodeling in patients with atrial fibrillation and patients in sinus rhythm
We divided the patients with mitral valve disease into patients
Table 3. Clinical and histological characteristics of AF patients’ LA and RA and that of SR controls’ LA and RA
AF (n=23)
p SR (n=10)
LA (n=14) RA (n=9) LA (n=6) RA (n=4) p
Age 61.93±7.83 59.56±12.17 0.574 51.83±13.76 47.50±8.51 0.593
Sex (male, %) 44.45 35.71 0.692 66.67 50.00 0.645
BMI (kg/m
2) 21.31±3.37 20.63±3.58 0.264 23.97±3.18 22.32±3.02 0.435
BSA (m
2) 1.59±0.20 1.55±0.23 0.658 1.76±0.23 1.68±0.24 0.623
Echocardiographic findings
LA size (mm) 65.14±12.11 59.89±10.13 0.293 50.83±8.35 46.00±4.55 0.327
LA volume (mL) 206.19±108.90 152.93±75.62 0.215 117.87±39.38 110.08±39.20 0.767
LA volume Index (mL/m
2) 126.35±62.76 95.28±35.98 0.194 68.06±21.07* 64.90±17.77 0.812
LVEF (%) 64.71±10.07 62.56±15.52 0.689 63.00±8.05 62.25±6.29 0.880
LVEDD (mm) 52.07±7.52 54.89±9.55 0.438 56.83±7.47 52.25±9.67 0.421
LVESD (mm) 34.57±6.63 37.11±10.89 0.492 38.67±7.23 36.00±7.70 0.592
Histologic analyses
Fibrosis (MT) (% area) 26.73±9.22 11.06±7.69 0.001 16.91±9.75* 11.87±3.22 0.355
Subendocardial smooth muscle area (%) 5.74±5.92 0.39±0.69 0.014 1.23±1.66 0.16±0.20 0.242
Subendocardial smooth muscle thickness (mm)
0.21±0.19 0.01±0.01 0.005 0.05±0.06 0.01±0.01 0.192
Western blot
pNF-kβ 1.26±0.41 0.97±0.25 0.139 1.09±0.30 1.11±0.45 0.939
CD31 0.73±0.22 0.24±0.72 0.928 0.62±0.10 0.90±0.18 0.074
E-selectin 0.97±0.47 0.65±0.31 0.163 0.98±0.18 0.84±0.48 0.660
iNOS 0.55±0.38 0.45±0.34 0.607 0.79±0.58 1.13±0.32** 0.548
SDF-1α 0.75±0.41 0.59±0.27 0.423 0.70±0.15 0.66±0.10 0.720
Endothelin-1 0.83±0.28 0.70±0.27 0.349 1.02±0.12 0.76±0.21 0.267
PDGF 0.63±0.29 0.44±0.03 0.320 0.37±0.07 0.46±0.12 0.429
MPO 0.68±0.37 0.71±0.40 0.943 0.82±0.06 1.26±0.74 0.486
Real-time PCR
2
-ΔCt NCX0.014±0.014 0.008±0.006 0.232 0.008±0.008 0.004±0.002 0.355
2
-ΔCt HCN40.012±0.012 0.026±0.026 0.088 0.009±0.006 0.028±0.035 0.208
*p<0.05 AF LA vs. SR LA, **p<0.05 AF RA vs. SR RA. AF: atrial fibrillation, LA: left atrium, RA: right atrium, SR: sinus rhythm, BMI: body mass index, BSA:
body surface area, LVEF: left ventricular ejection fraction, LVEDD: left ventricular end-diastolic dimension, LVESD: left ventricular end-systolic dimension,
MT: Masson’s trichrome, iNOS: inducible NO synthase, SDF-1: stromal cell-derived factor-1, PDGF: platelet-derived growth factor, MPO: myeloperoxidase,
PCR: polymerase chain reaction
with AF and patients in SR, and then, subdivided the AF and SR groups into the LA and RA groups (Table 3). The clinical analysis revealed that the 4 groups showed no significant differences in sex, age, LA size, and LA volume. In terms of the degree of fibrosis, LA of the patients with AF showed more advanced interstitial fibrosis
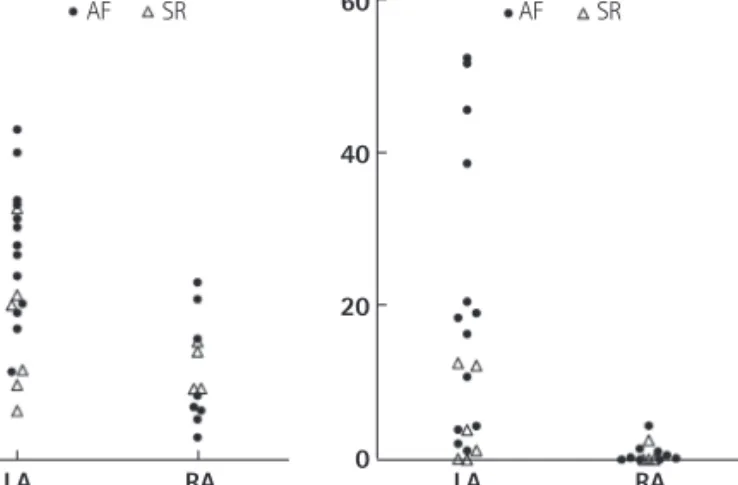
than LA of the patients in SR (p=0.046). But, there was no difference in the degree of fibrosis in the RA regardless of the rhythm status (p=0.355). Among the patients with mitral valvular AF, the degree of fibrosis (p=0.001), percent area (p=0.014) and thickness (p=0.005) of the subendocardial smooth muscle layer were significantly great- er in the LA than in the RA (Fig. 3).
The messenger ribonucleic acid or protein expression level in the left atrium and right atrium tissues
We have summarized the tissue characteristics based on the protein and mRNA expressions in Table 2. The protein expressions analyzed by western blot revealed that there were no significant differences in pNF-κB, CD31, E-selectin, iNOS, SDF-1α, ET-1, PDGF, and MPO expressions between the LA and the RA groups (Fig. 4).
The tissue expression levels of thrombogenicity-related proteins were not significantly different among the 4 groups; AF vs. SR and LA vs. RA, except for the lower tissue level of iNOS in the LA of pa- tients in SR than in the RA of patients in SR (p=0.048) (Table 3). In terms of mRNA expression, NGS for mRNA was conducted using 8 tissues taken from 4 patients (2 AF and 2 patients remained in si- nus rhythm), and all these were patient-matched RA (n=4) and LA Fig. 3. Scatter plots of fibrosis area (%) and thickness of the subendocar-
dial smooth muscle layer (mm) for the LA and RA. Most of the remodeling occurred in the fibrillating LA followed by LA showing sinus rhythm. AF:
atrial fibrillation, LA: left atrium, RA: right atrium, SR: sinus rhythm.
60
40
20
0
60
40
20
LA 0 LA
AF AF
Fibrosis SSM thickness
(%) (mm)
SR SR
RA RA
Fig. 4. Western blot analysis of pNF-κB, CD31, E-selectin, iNOS, SDF-1α, Endothelin-1, PDGF, and MPO showed that the protein expression levels were not significantly different between the LA and the RA. LA: left atrium, RA: right atrium, iNOS: inducible NO synthase, SDF-1: stromal cell-derived factor-1, PDGF: platelet-derived growth factor, MPO: myeloperoxidase.
2.00
1.50 1.00
0.50 0.00
2.00
1.50
1.00 0.50
0.00 LA
LA pNF-κB
SDF-1α RA
RA
2.00
1.50 1.00
0.50 0.00
2.00
1.50
1.00 0.50
0.00 LA
LA PECAM-1
ET-1 RA
RA
2.00
1.50 1.00
0.50 0.00
2.00
1.50
1.00 0.50
0.00 LA
LA E-selectin
PDGF RA
RA
2.00
1.50 1.00
0.50 0.00
2.00
1.50
1.00 0.50
0.00 LA
LA iNOS
MPO RA
RA