https://doi.org/10.5468/ogs.2018.61.2.253 pISSN 2287-8572 · eISSN 2287-8580
Introduction
Polycystic ovary syndrome (PCOS), which is characterized by chronic anovulation and hyperandrogenism, is a common endocrine disorder in women of reproductive age. Insulin resistance (IR) is one of the core pathophysiological character- istics of this syndrome. Thus, besides its association with re- productive morbidity, PCOS is known as a metabolic disorder.
Women with PCOS are more predisposed to hypertension and dyslipidemia and have an excess risk of type 2 diabetes
Serum visfatin levels in non-obese women with polycystic ovary syndrome and matched controls
Jin Ju Kim
1,2, Young Min Choi
2,3, Min A Hong
3, Min Jeong Kim
1, Soo Jin Chae
4, Sun Mie Kim
1, Kyu Ri Hwang
5, Sang Ho Yoon
6, Seung Yup Ku
2,3, Chang Suk Suh
2,3, Seok Hyun Kim
2,31Department of Obstetrics and Gynecology, Healthcare System Gangnam Center, Seoul National University Hospital, 2The Institute of Reproductive Medicine and Population, Medical Research Center, Seoul National University College of Medicine, Department of Obstetrics and Gynecology, 3Seoul National University College of Medicine, 4Maria Fertility Hospital, 5Seoul Metropolitan Government-Seoul National University Boramae Medical Center, 6Graduate School of Medicine, Dongguk University, Seoul, Korea
Objective
The purpose of the current study was to compare the circulating levels of visfatin between women with polycystic ovary syndrome (PCOS) and those without PCOS and to assess the correlations between visfatin levels and various parameters.
Methods
This case-control study recruited 74 PCOS patients and 74 age- and body mass index (BMI)-matched controls. Serum visfatin levels were evaluated using the enzyme-linked immunosorbent assay. Women with PCOS were divided into 2 subgroups based on the presence of clinical or biochemical hyperandrogenism. The possible differences in serum visfatin levels between the hyperandrogenic and non-hyperandrogenic groups were also assessed.
Results
Visfatin levels in PCOS patients were similar to those in the controls. However, hyperandrogenic patients had significantly higher mean serum visfatin levels than those in non-hyperandrogenic patients (3.87 ng/mL; 95%
confidence intervals [CIs], 3.09–4.85 in hyperandrogenic group vs. 2.69 ng/mL; 95% CIs, 2.06–3.52 in non- hyperandrogenic group; P=0.038). In women with PCOS, visfatin levels positively correlated with BMI (r=0.23; P=0.047) and the log free androgen index (FAI) (r=0.27; P=0.021) and negatively correlated with high-density lipoprotein (HDL) cholesterol levels (r=−0.37; P=0.025). Except for HDL cholesterol levels, these correlations were also observed in controls.
Conclusion
Visfatin levels in PCOS patients were similar to those in the controls. However, hyperandrogenic patients showed significantly higher serum visfatin levels than those of non-hyperandrogenic patients, and visfatin had a positive linear correlation with FAI in both PCOS patients and controls.
Keywords: Adipocytokine; Polycystic ovary syndrome; Nicotinamide phosphoribosyltransferase; Visfatin
Received: 2017.05.24. Revised: 2017.08.30. Accepted: 2017.09.06.
Corresponding author: Young Min Choi
Department of Obstetrics and Gynecology, The Institute of Reproductive Medicine and Population, Medical Research Center, Seoul National University College of Medicine, 103 Daehak-ro, Jongno-gu, Seoul 03080, Korea
E-mail: [email protected]
https://orcid.org/0000-0003-1245-0378
Articles published in Obstet Gynecol Sci are open-access, distributed under the terms of the Creative Commons Attribution Non-Commercial License (http://creativecommons.
org/licenses/by-nc/3.0/) which permits unrestricted non-commercial use, distribution, and reproduction in any medium, provided the original work is properly cited.
Copyright © 2018 Korean Society of Obstetrics and Gynecology
and subclinical atherosclerosis [1,2]. Obesity is also common (20%–70%) in women with PCOS.
Visfatin is a new adipokine found in subcutaneous, visceral, perivascular, and epicardial fat tissues [3-6]. Serum visfatin levels correlate well with body mass index (BMI) or percentage of body fat [3] and are higher in obese subjects than those in controls [3,7]. At first, visfatin was considered to mainly have insulin-mimetic properties such as stimulating glucose uptake in adipocytes and suppressing glucose release from hepa- tocytes in vitro [8]. However, subsequent studies have found connections between visfatin and inflammation, endothelial dysfunction and atherosclerosis; these connections suggest a possible role of visfatin as a biomarker of low-grade inflamma- tion and metabolic complications [9-13]. Curat et al. [14] report- ed that visfatin is not only synthesized by adipocytes but also by inflammatory cells such as macrophages in adipose tissue, suggesting that visfatin might be a proinflammatory marker.
PCOS is associated with the dysfunctional secretion of adi- pokines, promoting inflammation and IR [15,16]. Substantial numbers of studies have reported that the gene expression or serum levels of visfatin are significantly higher in women with PCOS than those in matched controls [4,17-22]. Pepene [23]
reported that visfatin is an independent predictor of endothe- lial dysfunction in women with PCOS. However, some studies have reported no differences in serum visfatin levels between PCOS patients and controls [24-27].
The purpose of the current study was to compare circulat- ing visfatin levels in women with PCOS to those in women without PCOS and to assess the correlations between visfatin and various parameters. Considering that higher visfatin levels have been reported in hirsute PCOS patients and that positive correlations between serum visfatin and androgen levels have been reported [19,23,28], this study also assessed whether serum visfatin levels differ between hyperandrogenic and normo-androgenic PCOS patients. To minimize the effect of obesity, the study was performed in non-obese women with PCOS and age- and BMI-matched controls.
Materials and methods
1. Subjects
For this study, data from a previously described cohort were analyzed. The detailed diagnostic process is described in pre- vious studies [29-31]. Briefly, a total of 74 premenopausal
women were enrolled as PCOS patients, and a diagnosis was based on the 2003 Rotterdam consensus meeting guideline [32]. Oligomenorrhea was defined as less than 8 periods per year or cycles longer than 35 days, and amenorrhea was de- fined as the absence of menstruation for more than 3 months without pregnancy. Clinical hyperandrogenism was defined by a modified Ferriman and Gallwey score (mF-G score) of 6 or greater [30]. Biochemical hyperandrogenism was defined as total testosterone (T) >0.68 ng/mL, free T >1.72 pg/mL, or free androgen index (FAI) >5.36 [29].
A total of 74 premenopausal women were matched with patients based on age (±3 year) and BMI (±1 kg/m
2). Match- ing was performed randomly without replacement at a ratio of 1:1. Including criteria for controls has also been previously described [31]. Neither the cases nor the controls had taken combined oral contraceptives, lipid-lowering agents, insulin sensitizer or anti-androgens or had a history of diagnosed diabetes. The review board for human research of the Seoul National University Hospital approved this project (Institutional Review Board [IRB] No. 0807-031-250), and written informed consent was obtained from all subjects.
2. Clinical and biochemical measurements
Clinical variables such as body weight, height, waist circum- ference (WC) and blood pressure (BP) were assessed, and BMI was calculated as weight (kg) divided by the square of height (m
2). Subjects who had a BMI less than 25 kg/m
2were en- rolled according to the definition of obesity for Asians [33].
All PCOS patients were evaluated for serum luteinizing hormone, follicle stimulating hormone and estradiol, total T, free T, 17-hydroxyprogesterone and sex hormone binding globulin (SHBG) using radioimmunoassay (Simens, Los An- geles, CA, USA). FAI was calculated as (total T/SHBG)×100, and the values for T were converted from ng/mL to nmol/
L using the following index provided by the manufacturer:
1 ng/mL=3.467 nmol/L. Fasting and 2-hour serum glucose
and insulin levels were evaluated by a 75 g oral glucose
tolerance test (OGTT) in women with PCOS. The homeosta-
sis model assessment of insulin resistance (HOMA-IR) was
calculated as glucose (mg/dL)×insulin (μU/mL)/405. Serum
cholesterol, triglyceride (TG), high-density lipoprotein (HDL)
cholesterol, low-density lipoprotein (LDL) cholesterol and
hemoglobin A1c levels were also measured in women with
PCOS. In the controls, serum total T, free T, SHBG, fasting
glucose and insulin, hemoglobin A1c, total cholesterol, TG,
HDL cholesterol and LDL cholesterol levels were evaluated.
Serum visfatin was evaluated by human visfatin enzyme- linked immunosorbent assay (AdipoGen, Liestal, Switzerland), and the intra- and inter-assay coefficients of variation were
<10% and <8%, respectively.
3. Statistical analysis
Possible deviations from the normality of the data distribu-
tion were tested using visual inspection of quantile-normal plots and/or the Shapiro-Wilk test of normality. If variables did not follow Gaussian distributions, normal distribution was achieved by natural logarithmic or square root transforma- tions, then the data were shown as geometric means with 95% confidence intervals (CIs). Hormonal and other meta- bolic parameters were compared using a Student’s t-test. To assess the correlations between serum visfatin levels and each
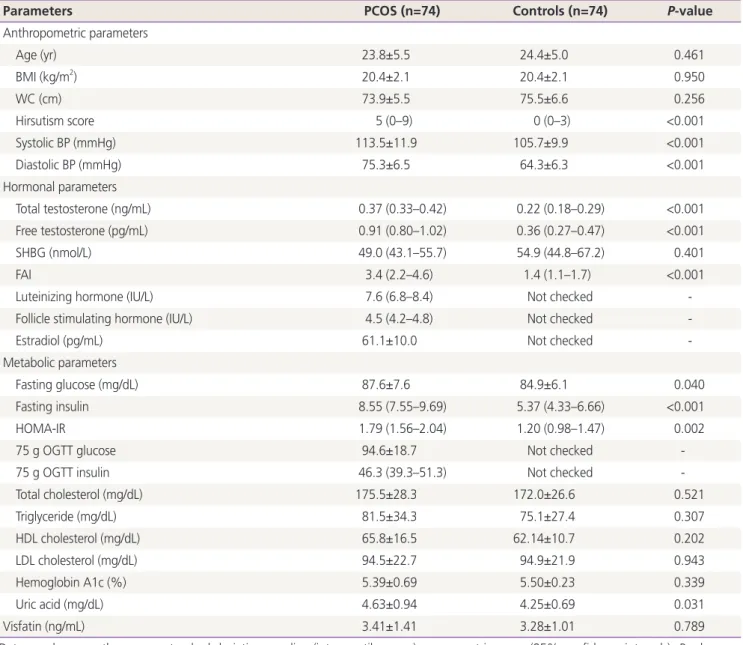
Table 1. Clinical and biochemical features of non-obese women with polycystic ovary syndrome matched controls
Parameters PCOS (n=74) Controls (n=74) P-value
Anthropometric parameters
Age (yr) 23.8±5.5 24.4±5.0 0.461
BMI (kg/m2) 20.4±2.1 20.4±2.1 0.950
WC (cm) 73.9±5.5 75.5±6.6 0.256
Hirsutism score 5 (0–9) 0 (0–3) <0.001
Systolic BP (mmHg) 113.5±11.9 105.7±9.9 <0.001
Diastolic BP (mmHg) 75.3±6.5 64.3±6.3 <0.001
Hormonal parameters
Total testosterone (ng/mL) 0.37 (0.33–0.42) 0.22 (0.18–0.29) <0.001
Free testosterone (pg/mL) 0.91 (0.80–1.02) 0.36 (0.27–0.47) <0.001
SHBG (nmol/L) 49.0 (43.1–55.7) 54.9 (44.8–67.2) 0.401
FAI 3.4 (2.2–4.6) 1.4 (1.1–1.7) <0.001
Luteinizing hormone (IU/L) 7.6 (6.8–8.4) Not checked -
Follicle stimulating hormone (IU/L) 4.5 (4.2–4.8) Not checked -
Estradiol (pg/mL) 61.1±10.0 Not checked -
Metabolic parameters
Fasting glucose (mg/dL) 87.6±7.6 84.9±6.1 0.040
Fasting insulin 8.55 (7.55–9.69) 5.37 (4.33–6.66) <0.001
HOMA-IR 1.79 (1.56–2.04) 1.20 (0.98–1.47) 0.002
75 g OGTT glucose 94.6±18.7 Not checked -
75 g OGTT insulin 46.3 (39.3–51.3) Not checked -
Total cholesterol (mg/dL) 175.5±28.3 172.0±26.6 0.521
Triglyceride (mg/dL) 81.5±34.3 75.1±27.4 0.307
HDL cholesterol (mg/dL) 65.8±16.5 62.14±10.7 0.202
LDL cholesterol (mg/dL) 94.5±22.7 94.9±21.9 0.943
Hemoglobin A1c (%) 5.39±0.69 5.50±0.23 0.339
Uric acid (mg/dL) 4.63±0.94 4.25±0.69 0.031
Visfatin (ng/mL) 3.41±1.41 3.28±1.01 0.789
Data are shown as the means±standard deviation, median (interquartile range), or geometric mean (95% confidence intervals). P-values are indicated for the differences between groups, as analyzed using a Student's t-test.
PCOS, polycystic ovary syndrome; BMI, body mass index; WC, waist circumference; BP, blood pressure; SHBG, sex hormone binding globulin;
FAI, free androgen index; HOMA-IR, homeostasis model assessment of insulin resistance; OGTT, oral glucose tolerance test; HDL, high-density lipoprotein; LDL, low-density lipoprotein.
parameter, Pearson’s correlation analysis was used. All data analyses were performed using the Statistical Package for the Social Sciences software (version 22.0; IBM SPSS, Armonk, NY, USA), and statistical significance was accepted for 2-sided
P-values <0.05.Results
The clinical and endocrine characteristics are shown in Table 1.
By definition, there were significant differences in the hirsut- ism score and serum androgen levels between women with PCOS and the controls. There were also significant differences in systolic and diastolic BP, fasting glucose, fasting insulin, HOMA-IR, and uric acid levels between the 2 groups. How- ever, serum lipid, hemoglobin A1c, and visfatin levels were similar between the 2 groups.
For further analysis, women with PCOS were divided into 2 subgroups based on the presence of hyperandrogenism. If a
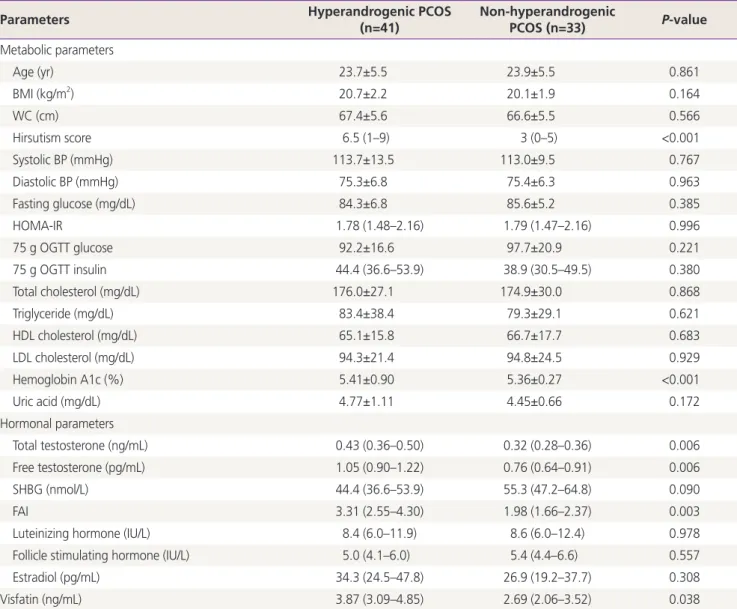
patient has any of the clinical hyperandrogenism or biochemi-Table 2. Clinical and biochemical features of non-obese polycystic ovary syndrome patients with and without hyperandrogenism
Parameters Hyperandrogenic PCOS
(n=41)
Non-hyperandrogenic
PCOS (n=33) P-value Metabolic parameters
Age (yr) 23.7±5.5 23.9±5.5 0.861
BMI (kg/m2) 20.7±2.2 20.1±1.9 0.164
WC (cm) 67.4±5.6 66.6±5.5 0.566
Hirsutism score 6.5 (1–9) 3 (0–5) <0.001
Systolic BP (mmHg) 113.7±13.5 113.0±9.5 0.767
Diastolic BP (mmHg) 75.3±6.8 75.4±6.3 0.963
Fasting glucose (mg/dL) 84.3±6.8 85.6±5.2 0.385
HOMA-IR 1.78 (1.48–2.16) 1.79 (1.47–2.16) 0.996
75 g OGTT glucose 92.2±16.6 97.7±20.9 0.221
75 g OGTT insulin 44.4 (36.6–53.9) 38.9 (30.5–49.5) 0.380
Total cholesterol (mg/dL) 176.0±27.1 174.9±30.0 0.868
Triglyceride (mg/dL) 83.4±38.4 79.3±29.1 0.621
HDL cholesterol (mg/dL) 65.1±15.8 66.7±17.7 0.683
LDL cholesterol (mg/dL) 94.3±21.4 94.8±24.5 0.929
Hemoglobin A1c (%) 5.41±0.90 5.36±0.27 <0.001
Uric acid (mg/dL) 4.77±1.11 4.45±0.66 0.172
Hormonal parameters
Total testosterone (ng/mL) 0.43 (0.36–0.50) 0.32 (0.28–0.36) 0.006
Free testosterone (pg/mL) 1.05 (0.90–1.22) 0.76 (0.64–0.91) 0.006
SHBG (nmol/L) 44.4 (36.6–53.9) 55.3 (47.2–64.8) 0.090
FAI 3.31 (2.55–4.30) 1.98 (1.66–2.37) 0.003
Luteinizing hormone (IU/L) 8.4 (6.0–11.9) 8.6 (6.0–12.4) 0.978
Follicle stimulating hormone (IU/L) 5.0 (4.1–6.0) 5.4 (4.4–6.6) 0.557
Estradiol (pg/mL) 34.3 (24.5–47.8) 26.9 (19.2–37.7) 0.308
Visfatin (ng/mL) 3.87 (3.09–4.85) 2.69 (2.06–3.52) 0.038
Data are shown as the means±standard deviation, median (interquartile range), or geometric mean (95% confidence intervals). P-values are indicated for the differences between groups, as analyzed using a Student's t-test.
PCOS, polycystic ovary syndrome; BMI, body mass index; WC, waist circumference; BP, blood pressure; HOMA-IR, homeostasis model assess- ment of insulin resistance; OGTT, oral glucose tolerance test; HDL, high-density lipoprotein; LDL, low-density lipoprotein; SHBG, sex hormone binding globulin; FAI, free androgen index.
cal hyperandrogenemia, then she was categorized as the hyperandrogenic group. Differences in serum visfatin levels
between the hyperandrogenic and non-hyperandrogenic groups were assessed (Table 2). Hyperandrogenic patients had significantly higher mean hemoglobin A1c levels, but mean levels of other metabolic variables were similar between the 2 groups. Although both groups had similar BMI and WC, significantly higher serum visfatin levels were observed in hy- perandrogenic patients than those in non-hyperandrogenic patients (mean level of serum visfatin was 3.87 [95% CIs, 3.09–4.85] ng/mL in hyperandrogenic patients and 2.69 [95%
CIs, 2.06–3.52] ng/mL in non-hyperandrogenic patients, re- spectively; P=0.038).
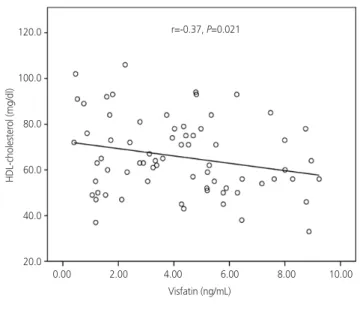
Finally, the correlations between serum visfatin levels and various parameters were evaluated. In women with PCOS,
serum visfatin levels positively correlated with BMI (r=0.23;
P=0.047) and log FAI (r=0.27; P=0.021) and negatively cor-
related with HDL cholesterol levels (r=−0.37; P=0.025) (Fig. 1).
Except HDL cholesterol levels (r=−0.10; P=0.597), correlations between serum visfatin levels and BMI (r=0.40; P=0.021) or log FAI (r=0.27; P=0.023) were also observed in the controls.
All other parameters, such as IR markers, SHBG, TG, and LDL cholesterol levels, showed no correlations with visfatin levels in both the patients and the controls (data not shown).
Discussion
The aim of the present study was to compare the circulating visfatin levels between non-obese women with PCOS and
Fig. 1. Correlations between serum visfatin levels and various pa- rameters in women with polycystic ovary syndrome. BMI, body mass index; HDL, high-density lipoprotein; FAI, free androgen index.
BMI (kg/m2)LOG FAI HDL-cholesterol (mg/dl)
Visfatin (ng/mL)
Visfatin (ng/mL)
Visfatin (ng/mL) r=0.23, P=0.047
r=0.27, P=0.021
r=-0.37, P=0.021
0.00 2.00 4.00 6.00 8.00 10.00
0.00 2.00 4.00 6.00 8.00 10.00
0.00 2.00 4.00 6.00 8.00 10.00 26.0
24.0
22.0
20.0
18.0
16.0
1.5
1.0
0.5
0.0
-0.5
120.0
100.0
80.0
60.0
40.0
20.0