DOI : 10.5394/KINPR.2011.35.4.343
A Study on forecasting container volume of port using SD and ARIMA
Jong-Kil Kim*․Ji-Yeong Pak**․Ying-Wang***․Sung-Il Park****․†Gi-Tae Yeo
*,**,***,****,† Graduate school of Logistics, Incheon University , Incheon 408-840,Republic of Korea
Abstract : The forecasting of container volume which is the basis of port logistics facilities expansion has a great influence on development of an port. Based on this importance, various previous studies have presented methodology on container volume forecasting. The results of many previous studies pointed out the limitations of future forecasting based on past container volume and emphasized that more various factors should be considered to compensate this. Taking notice of this point, this study forecasted future container volume by using ARIMA model, time series analysis and System Dynamics (SD) method, a dynamic analysis technique and performed the comparative review with the forecast of the Ministry of Land, Transport and Maritime affairs. Recently with rapid changes in economic and social environment, the non-linear change tendency for forecasting container traffic is presented as a new alternative to the country.
Key words : Container volume forecast, System dynamics, ARIMA analysis, Bass model , Vensim
* [email protected] 032)890-8170 ** [email protected] 032)835-4590 *** [email protected] 032)835-4590
**** [email protected] 032)835-4590
†Corresponding author, [email protected] 032)835-8196
1. Introduction
Modern port facilities not only perform traditional trade functions but respond to various social and economic changes and due to larger vessels, clustering, rapid transition to container cargo etc. the life cycle of facilities is getting shortened (Son, 2009).
Accordingly, ongoing redevelopment of worn out ports is required and in planning new facilities, container volume forecasting almost in real time considering a variety of variables became eagerly needed.
However, examining the previous studies, they just predict the future container volume by simply using times series that the existing ports have. But modern ports confront the limitations forecasting the future container volume only with the simple past data and it is because port container volume is affected very flexibly by exogenous variables occurring from around the world (exchange rate, economic growth rate, relationship between nations etc.).
This study is different from normal existed forecasting methods, such as ARIMA, regression method used by the Ministry of Land, Transport and Maritime affairs, using SD method which reflects the change of environment to forecasting the container volume in the future, the purpose of this study is to diversify the method and find more flexible and exact method to forecasting the container
volume.
By performing the comparative review on the analysis result with the forecast of the Ministry of Land, Transport and Maritime affairs which is used officially in the country, we verify the usefulness and limitations of ARIMA model.
This study forecasts future container volume by securing the monthly handling performance for 20 years of nationwide container handling volume and using time series analysis ARIMA model frequently used in the previous studies. Also, by introducing SD(System Dynamics) method which is capable of dynamic simulation and can be an alternative of time series analysis, we forecast container volume. The model performs the simulation by comprehensively considering trend in container volume, GDP change, change rate of international trade using bass model, and tests the model's validity with actual measurement value and the real data we used. And comparing the derived results with existed forecasting methods.
This paper is organized as follows. chapter 2 provides the
literature review about variety methods forecasting the
container volume and chapter 3 presents the ARIMA and
SD method to forecast the container volume in Korea, and
with the result after simulation to tests the validity of the
SD model, finally in chapter 4 compares the forecasting
result among difference methods and shows the limit of this
study.
2. Literature Review
Since facilities expansion of port logistics Industry is carried out based on container volume forecasting, container volume forecasting has a significant meaning greatly affecting port development.
However, forecasting should be carried out by considering various domestic and international environment and uncertainty that can result in different results according to a forecasting model still remains.
Looking at the existing research that forecasted container volume, in order to analyze the relationship between port size and growth,
Forecasting import and export container volume of major ports in Korea, Jang et al (2005) said that as GDP increases by 1%, import and export container volume on ton increases by about 0.8∼1.1% and container import and export volume increases by 1.0∼1.2%.
However, they analyzed that in a situation where competition for container volume procurement of Northeast Asia is becoming vehemently due to variables such as North China port development etc. the ports of Korea should exert every effort in securing its own container volume along with facilities expansion.
Analyzing the correlation between import container volume of the Gwangyang port and economic variables, Mo (2009) analyzed that recession and currency turmoil around the world will continue and in case of exchange rate, as it increases by 40 won, Korea port container volume will decrease by about 809 thousand TEU in a year. Also, he presented that if economic indices fall by 5 points, 475 thousand TEU will decrease.
Jeon et al (2004) insisted that since a lot of time and capital are required in building infrastructure such as ports, airports, terminals etc. it is important to forecast future container volume from the stage of planning facilities. In addition, they insisted that it is improper to simply use past time series data for container volume prediction. Choi (2007) studied the correlation between container volume and exchange rate fluctuation and found out exchange rate fluctuation had a negative effect on container volume of Korea.
Also, he judged that as competition between Northeast port facilities is deepened, securing container volume would be tough and sudden exchange rate fluctuation would affect greatly in securing container volume.
Jeon et al (2006) asserted that container volume forecasting of future 10 years ∼ 20 years should be done in
the stage of planning ports.
But they suggested that it is hard to forecast exact container volume by simple time series analysis in the rapidly changing shipping market conditions and the analytical methods which can thoroughly respond to change factors should be used. To estimate the demand and container volume, many studies identified the characteristics of past container volume data, trends, seasonality etc. and predicted future container volume.
The method used most frequently in the previous studies was ARIMA analysis method using the past time series data.
Examining the previous studies, Kim (2008) asserted that the most important factor to establish the national port basic plan is to forecast future port container volume. To predict future container volume (container, all kinds of oil, other cargo) of North Port in Busan, the ARIMA model and the exponential smoothing model were used. To predict marine container volume, Kim (2007) used the multiplicative seasonal ARIMA model which considers the seasonal characteristics of container volume and can solve them.
The result of forecasting container volume for 2007∼12 year by introducing the ARIMA(1,1,1)(1,0,1) model showed that it increased from 696,310,000 to 832,120,000 ton.
Kim (2008) also divided the container volume of Korea into import and export, coast, transshipment by using ARIMA and predicted future container volume.
The result of calculating the total annual container volume based on the final model, ARIMA(0,1,0)(1,1,0)
model without constant showed that container volume in 2011 appeared 21,170,000 TEU and 29,790,000 TEU in 2020.
However, Kim analyzed that this increase will be somewhat lower figure when considering exchange rate, international oil price and the economic downturn around the world.
Despite the results of previous studies, the logistics industry including the port logistics industry is greatly affected by surrounding exogenous variables (exchange rate, GDP etc.), there are limits to perform accurate prediction by ARIMA analysis method based on the past container volume trend.
Jung(2008) forecasted future demand and supply, price of nickel using system dynamics. With mean absolute percentage error to compare the forecasting result between regression analysis and SD, it shows that the mean absolute percentage error of regression analysis bigger than SD.
Nickel price trend showed non-linear pattern system
dynamic method is better than the regression analysis. The
model has been calibrated for the past 6 year quarterly data
(2002-2007) and tested for next 5 year quarterly
Fig. 2 Structuring of effects affecting the economic size data(2008-2012). The results were acceptable and showed
higher accuracy than the results obtained from the regression analysis. And the simulations for scenarios made by possible future changes in demand or supply related variables. This simulations implied some meaningful price change patterns. And the study through comparing the real data and the result from simulation to test the validity of the model.
The container volume forecasting method using by the ministry of land, transport and maritime affairs is regression model, through analysis trend of traffic volume for each commodity and the trend commodity effected to each industry, forecasting each commodity of the container volume.
The forecasting of the Ministry of Land, Transport and Maritime affairs according to the characteristic of each commodity using regression model with main factors such as GDP, exchange rate, dummy variable, because of applying unit of won to get the forecasting value so the forecasting error is increased. And the unidirectional causality fails to reflect the change of various socio-economic systems from delivered results.
But the forecasting method SD used in this study is identifying the feedback loops dominate the dynamics behavior of the system. This feedback describes the causality direction that implies how a change in any variables within the feedback loop. So with dynamics thinking, SD is different from existed forecasting method used in Korea container volume.
3. Study Application
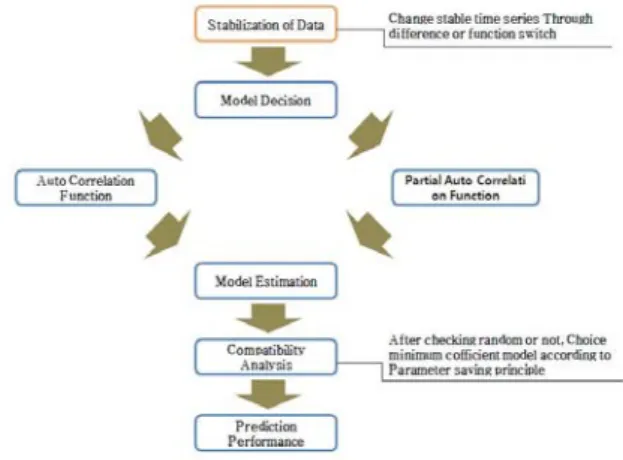
3.1 Application of ARIMA model
To identify the limits of ARIMA analysis method pointed out in the previous studies, Korea's entire container handling volume was analyzed by using monthly figures of 1990-2010. Generally, the methods forecasting container volume are divided into a qualitative method and quantitative method and the qualitative method refers to a method relying on the decision of experts and practitioners and the quantitative method is a method to predict the future by using the past time series data and time series analysis is usually used.
There are moving average using time series data, exponential smoothing, autoregression, ARIMA model of Box-Jenkins etc. and regression analysis predicting causal relationship, structural econometric models etc. in the
quantitative method.
This study forecasts the future container volume by using ARIMA model, which is the time series analysis, based on monthly container handling of Korea's ports for 21 years, 1990-2010. ARIMA model is the method invented by Box and Jenkin in England in 1970 and is carried out over 5 steps.
To forecast national container volume, monthly container handling data of Korea for 252 months of 21 years, last 1990-2010 years was used. Looking at time series raw
Fig. 1 Structuring of effects affecting the economic size
data, container volume handling keeps increasing and this shows that 1st handling process is needed in applying the methodology.
Also, looking at the estimated ACF and PACF indicators, since they show the form that strong spikes appear in 12 month cycle and decrease gradually, it can be judged that seasonal difference is needed.
For estimation of ACF and PACF, 63 maximum degrees
of autocorrelation and Bartlett‘s approximation as the
standard deviation method were used.
ARIMA (0,1,0) (0,1,0)
ARIMA (0,1,1) (0,1,0)
ARIMA (1,1,0) (0,1,0)
ARIMA (0,1,1) (0,1,1)
ARIMA (0,1,9) (0,1,1)
R-squared 0.988 0.988 0.988 0.992 0.992
RMSE 50378 50408 50378 41425 42347
Normalized BIC 21.7 21.7 21.7 21.3 21.3
Ljung-Box Q sig. 0.000 0.000 0.000 0.005 0.000
Fig. 3 Structuring of effects affecting the economic size
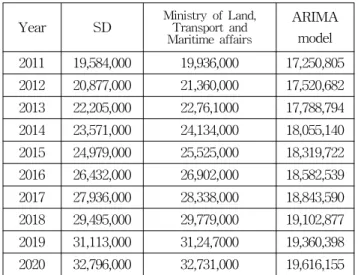
Year ARIMA
Ministry of Land, Transport and Maritime affairs
2011 17,250,805 19,936,000
2012 17,520,682 21,360,000
2013 17,788,794 22,76,1000
2014 18,055,140 24,134,000
2015 18,319,722 25,525,000
2016 18,582,539 26,902,000
2017 18,843,590 28,338,000
2018 19,102,877 29,779,000
2019 19,360,398 31,24,7000
2020 19,616,155 32,731,000
By combining these circumstances, the national container volume forecasting models can be tentatively identified by the models such as ARIMA(0,1,0)(0,1,0)
12, ARIMA(0,1,1) (0,1,0)
12, ARIMA(1,1,0) (0,1,0)
12etc.
In addition, to reflect seasonality, ARIMA(0,1,1)(0,1,1)
12model was added in the analysis by considering the spike identified in residual ACF and PACF and ARIMA(0,1,9) (0,1,1)
12presented in Expert Modeller of SPSS is also added to the analysis.
The models and goodness of fit index considered in this study are as follows.
Table 1 Estimation of ARIMA
Looking at the descriptive power of the tentatively identified models, all models were found to be significant because the values of Ljung-Box Q sig. appeared lower than 0.05. In particular, R-squared value representing the descriptive power appeared higher in ARIMA(0,1,1)(0,1,1) and ARIMA(0,1,9)(0,1,1) models.
However, in case of the values of root mean square error (RMSE), since the lowest value was shown in ARIMA (0,1,1)(0,1,1), it was selected as the optimal model.
From the result it can be found that the forecast of univariate ARIMA analysis based on the past container volume trend shows a significant difference with that of the Ministry of Land, Transport and Maritime affairs.
To overcome the above limitations, this study considers additional exogenous variables and introduces System Dynamics that can track the dynamic relationships between
variables.
Table 2 Comparison of ARIMA model and the forecast of the Ministry of Land, Transport and Maritime affairs (unit: TEU)
Source: Ministry of Land, Transport and Maritime affairs(2009), Forecasting report on port container volume by item / Calculating loading and unloading capacity of TOC ports by the type of a ship, pp.231
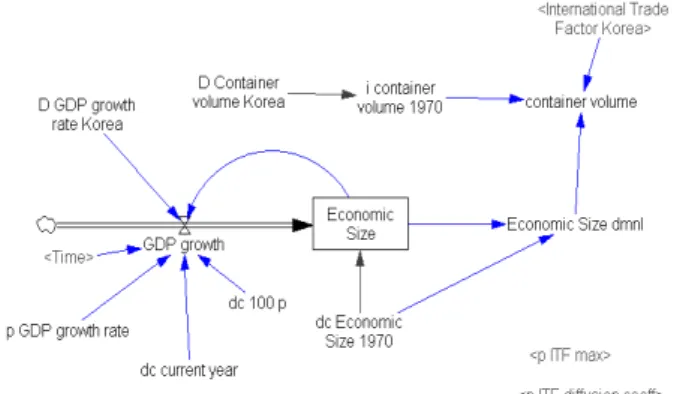
3.2 Application of System Dynamics
System Dynamics is the technique that defines the system composed of the variables directly or indirectly related to them about given problems or expected a set of problems and does modeling by studying the relationship between variables quantitatively and then helps solve the problem by finding out dynamic characteristics of a system through a series of simulations (Gwak, 2005)
This study forecasts future Korea container volume by using the vensim program, a software for SD.
Because forecasting the demand of the container volume is difficult, it is important to utilize system dynamics for several reasons(Lyneis, 2000). First, SD model can provide more reliable forecasts of short-to mid-term trends than statistical methods and therefore lead to better decisions, Second, forecasts using calibration can minimize the error between real data and forecasting data ,SD model are likely to be better and more informative than those from other approaches. Third, SD model provide a means of determining key sensitivities and therefore of developing more robust sensitivities and scenarios.
The analysis is based on the container volume data from
1970s and is progressed in the order of finding the factoring
affecting container volume and identifying feedback
structure between factors and building an overall model by using them.
The part considered in the 1st step to forecast national container volume in this study is the effect by changes in international trade. This element can be expressed as the change of Korea container volume according to the changes in international trade.
Fig. 4 shows the influence on container volume that international trade has.
This model was built based on Bass diffusion model.
Bass(1979) showed the diffusion process as the sum of market external factors (technology development etc.) and internal factors (the imitation factor by word of mouth effect etc.)
This is obtained from Logistics model (