*1 Received on February 13, 2008; accepted on March 3, 2008.
*2 Laboratory of Adhesion and Bio-Composites, Program in Environmental Materials Science, Seoul National University, Seoul 151-921, Korea.
*3 National Instrumentation Center for Environmental Management, Seoul National University, Seoul 151-921, Korea.
*4 R&D Center Wooden Materials Team, Eagon Industrial co., LTD, Incheon 402-060, Korea.
† Corresponding author : Hyun-Joong Kim ([email protected])
Influence of Surface Finishing Material Types to Formaldehyde and Volatile Organic Compounds
Emission from Plywood*
1Ki-Wook Kim*
2, Jin-Kyoung Oh*
2, Byoung-Ho Lee*
2, Hyun-Joong Kim*
2†, Young-Kyu Lee*
3, Sung-Hun Kim*
4, and Gwan-Eui Kim*
4ABSTRACT
Formaldehyde and volatile organic compounds (VOCs) are emitted from wood-based panels that have been made using wood particles, wood fiber, wood chips, formaldehyde-based resins and so on. In this study, we examined formaldehyde and total VOCs (TVOC) emission behaviors for plywood overlaid with water-soluble phenolic resin impregnated linerboard (PL), and two kinds of surface materials (decorative veneer and pre-impregnated finishing foil) that were adhered onto the PL that named DPL and PPL. EVA (ethyl vinyl acetate) was used to overlay the decorative veneer and pre-impregnated finishing foil on the plywood with water-soluble phenolic resin impregnated linerboard by a hot press instrument. The debond- ing test and accelerated aging test were conducted to assess their mechanical properties. Formaldehyde and TVOC emission concentrations were measured using the FLEC method and a VOC Analyzer, respectively.
The debonding test results of PL, DPL and PPL were 1.2, 1.5, and 0.5 N/mm2, respectively. The surface appearance of the samples were not changed after the accelerated aging test. The PL and DPL exhibited reduced formaldehyde and TVOC emission levels, respectively. In the case of PPL, the VOC value was relatively higher than those of PL and DPL.
Keywords : phenolic resin, linerboard, TVOC, formaldehyde, interior panel
1. INTRODUCTION
Wood-based panels, such as particleboard (PB), medium density fiberboard (MDF), ply- wood and so on, are widely used in the manu- facture of furniture, flooring, housing and other
industrial products (Anonymous, 2000). The raw materials of these consumer products are mainly imported from abroad. However, it is becoming difficult to obtain these raw materials due to their increasingly high price. For exam- ple, faultless veneers made of Oceania timber
have been used as the face/back surface veneers of plywood (top and bottom surface veneers of plywood) to cover up the knurls of the general veneers used in the interior of the plywood.
Also, a lot of Oceania timbers have been spent in developing countries. Therefore, wood-based panels made of low quality raw materials have to be treated in order for their properties to match those of general panels and to satisfy the specific requirements of their final use.
Therefore, finishing treatment methods which produce an overlaying or coating, such as paints, prints, varnishes, veneers, laminates, im- pregnated papers, finishing foils, etc., are used to reduce the absorption of water and moisture, and prevent the release of harmful gases (Vansteenkiste, 1981). These surface materials, such as decorative vinyl film and melamine im- pregnated paper, can lower the formaldehyde emission concentration from wood-based panels (Grigoriou, 1987). Nemli examined the effects of the process parameters used for the applica- tion of coating materials on the technological properties of particleboard and stated that the surface coating decreased the formaldehyde emission (Nemli, 2003). Building and furnishing materials may also emit many volatile organic compounds (VOCs) into the indoor air (Gustaffson, 1992). Due to the toxicity of these compounds and their severe impact on human health, it is necessary to use low level polluting materials instead (Report EUR 14086 EN 1991). VOCs are primarily composed of BTEX (benzene, toluene, ethylbenzene, and xylene) and halogenated hydrocarbons (Afshari et al., 2003). Among the numerous VOC compounds, toluene, ethylbenzene, xylene and styrene were chosen for this study, because they are the ma- jor VOCs found in indoor environments in dif- ferent countries (Risholm-Sundman et al., 1999).
There are various methods of measuring the formaldehyde emission from wood-based panels
such as the perforator (EN 120), flask (DIN EN 717-3), gas analysis (DIN EN 717-2), desiccator (JIS A 1460), and large-scale chamber (EN 717-1) methods (Marutzky, 1994).
The 20 ℓ small chamber and Field and Laboratory Emission Cell (FLEC, EN13419-2) methods were also designed for the measure- ment of the emission of formaldehyde and VOCs from planar surface building materials, paints and so on (Guo et al., 1998; Kim et al., 2006).
The Korean government started controlling indoor air quality in 2004. The guidelines pre- pared by the Ministry of Environment regulate the use of building materials which emit pollutants. The use of materials with a TVOC (Total VOC) emission level above 4.0 mg/m2h (JIS A 1901, small chamber method) is prohibited.
The aims of study were to investigate the formaldehyde and TVOC emissions from in- terior panels using water-soluble phenolic resin impregnating linerboard for the covering up of knurls of general veneers and to confirm their applicability for the interior panels of structures.
2. EXPERIMENTAL
2.1. Preparation of Materials
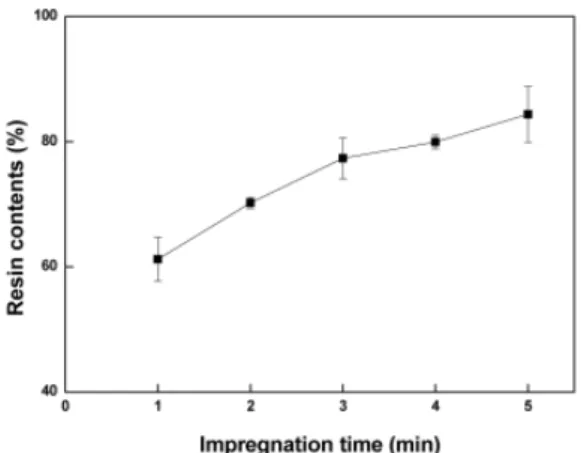
Linerboard with a basis weight of 180 g/m2 was donated by Korea Paper Mfg. Co., LTD (Republic of Korea). This linerboard was im- mersed for 3 minutes in water-soluble phenolic resin that was supplied by Tae Yang Co., LTD (Republic of Korea) and had a solid content of about 47%. The resin retention of the impreg- nated linerboard was about 77%, as shown in Fig. 1. In this study, we used tow kinds of sur- face finishing materials (veneer and pre-impreg- nated finishing foil) that have been widely used for the interior of structures. The decorative ve-
Fig. 1. Resin retention of linerboard as a function of impregnation time.
Pulp blending with resin (acrylic, melamine, urea)
↓
Impregnated raw paper
↓ Printing
↓ Coat with lacquer
Fig. 2. The pre-impregnated finishing manufacture flow diagram.
Table 1. The properties of the FLEC method
Test condition FLEC
Sample area 0.0177 m2
Volume 0.035 ℓ
Loading factor (area of
sample/Volume, m2/m3) 505.71 Air change rate (h-1) 428.57
Air supply (ℓ/min) 250
Equilibration time sampling after 15-30 mi- nutes
Temperature, humidity 23 ± 2.0°C , 50 ± 5%
Compounds, sampling
flow and total sampling High purity air Inlet air High purity air Background concentration VOC : 2 µg/m3, TVOC :
20 µg/m3
Cleaning process
Vacuum oven or clean- ing by methylene (chlor- ide?) then high purity air
for 1 day Analysis method GC/MS for VOC, HPLC
for formaldehyde neer was manufactured by dry pressing in an
oven after slicing logs which had moisture con- tents of 12 wt%. A pre-impregnated finishing foil was used in this study and the manufactur- ing method is shown in Fig. 2.
These water-soluble phenolic resin impreg- nated linerboards were overlaid on gnarled ply- wood (PL) using a hot press for 3 min at 140°C. The decorative veneer and pre-impreg- nated finishing foil were coated on the PL with approximately 20 g of EVA resin and are re- ferred to hereafter as DPL and PPL, respectively.
2.2. Methods
2.2.1. Mechanical Measurements
The debonding test and heat and cold repeti-
tion test were conducted using a Universal Testing Machine (Zwick Co.) and a Chamber (Weiss Co.), respectively, whose performances were in compliance with the Korean Standards (KS F 3106). The results of the debonding test represent the average of four samples. The re- sults were compared with the values specified in KS F 3106.
2.2.2. Measurement of Formaldehyde and TVOC Emission Concentrations by Field and Laboratory Emission Cell Test
The TVOC and formaldehyde emissions of the surface materials were measured by Field
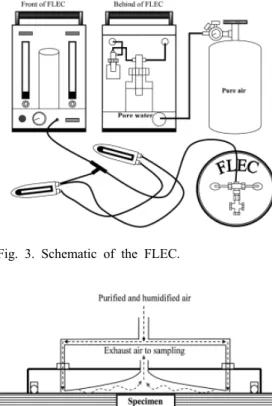
Fig. 3. Schematic of the FLEC.
Fig. 4. Schematic diagram of the flow direction in the FLEC.
- PL : water-soluble phenolic resin impregnated lin- erboard was overlaid on plywood
- PPL : pre-impregnated finishing foil was overlaid on PL
- DPL : decorative veneer was overlaid on PL Fig. 5. Results of debonding test.
and Laboratory Emission Cell (FLEC) techni- ques (ISO, 2006b) with the test conditions and structures shown in Table 1 and Fig. 3, respectively.
Dry air (with a moisture content of less than 5 ppmv) from a gas cylinder was passed through a water bubbler in an air supply instru- ment to obtain a moisture content of 50%. The air was introduced into the inlet of the FLEC and formed a laminar flow in the slit of the FLEC (Luo 2004) After the convective mass transfer of the air onto the surface of the mate- rial, it was discharged out of the FLEC, as shown in Fig. 4 The rate of exchange of air was controlled by an air pump. To monitor the pressure, temperature and RH of the air, the air supply pump was fitted with a sensor.
2.2.3. Measurement of Emission Concent- rations of 4 VOCs by VOC Analyzer To prepare the samples for the VOC ana- lyzer, the specimens were cut into pieces with a size of 100 × 100 mm and placed in a 3-l polyester bag. The bag was purged 3 times with N2 gas, and then filled with N2 gas by pulling up the plunger. For the blank control, an empty bag with N2 gas was prepared. The gases for the VOC analysis were collected from the 3-l polyester bag in a gas-tight (0.5 ㎖) manner at the required time, placed into the VOC analyzer and analyzed (Kim et al., 2006).
3. RESULTS AND DISCUSSION
3.1. Mechanical Properties
3.1.1. Debonding Properties
The results of the debonding test performed according to KS F 3106 for the manufactured samples are shown Fig. 5. The results for PL,
Fig. 6. The heat and cold repetition test.
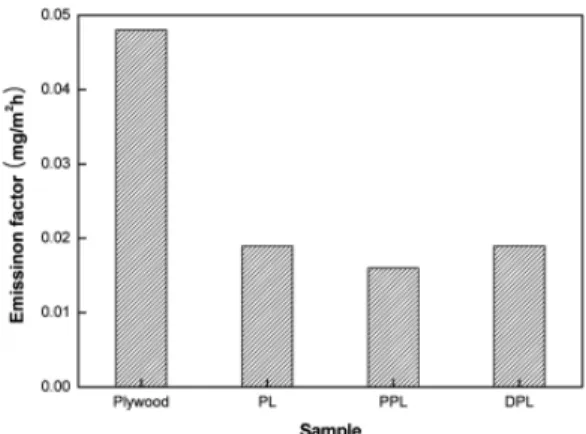
Fig. 7. Formaldehyde emission levels measured us- ing FLEC.
DPL and PPL were 1.2, 1.5, and 0.5 N/mm2, respectively. The debonding strengths of PL and DPL were about 3 times higher than that of PPL. However, the debonding test values of PL, DPL and PPL all exceeded the value of 0.4 N/mm2 specified in KS F 3106 and these mate- rials can therefore be used for the interior of structures from the viewpoint of their degree of strength.
3.1.2. Heat and Cold Repetition Properties Fig. 6 shows the apparatus used to perform the heat and cold repetition test that was con- ducted according to KS F 3106. The samples were kept in the chamber while the temperature was varied from 80 ± 3°C to - 20 ± 3°C two times over a total period of 2 hours. The ap- pearances of all of the samples were unchanged.
3.2. Formaldehyde and TVOC Emi- ssion Levels Measured by Field and Laboratory Emission Cell Test
Formaldehyde is released from hot press- ed-wood products made with urea-formaldehyde (UF) resin or phenolic-formaldehyde (PF) resin (e.g., plywood, particleboard (PB), medium den-
sity fiberboard (MDF), and oriented strand board) (Kim et al., 2005). For this reason, formaldehyde was an main aldehyde emitted from the wood-based products. Fig. 7 shows the formaldehyde emission values of the plywood, PL, DPL, and PPL measured using the FLEC method. The plywood had the highest form- aldehyde emission value of about 0.048 mg/m2h and those of PL, PPL, and DPL were 0.019, 0.016, and 0.019 mg/m2h, respectively. The wa- ter-soluble phenolic resin impregnated liner- board, pre-impregnated finishing foil, and deco- rative veneer cut off emitted formaldehyde from their plywood components and it was found that the level of formaldehyde emitted from the cured water-soluble phenolic resin of the over- laid plywood (PL, PPL, DPL) was lower than that from the plywood.
The TVOC emission levels from the speci- mens are shown Fig. 8. The emission values of plywood, PL, PPL, and DPL were 9.7, 2.4, 6.7, and 2.1 mg/m2h, respectively. Thus, plywood had the highest TVOC emission level. However, as in the case of the formaldehyde emissions, the TVOC levels of PL, DPL, and PPL were al- so reduced., because PL and DPL were manu- factured with low VOC emission grade materi-
Fig. 8. TVOC emission levels measured using FLEC.
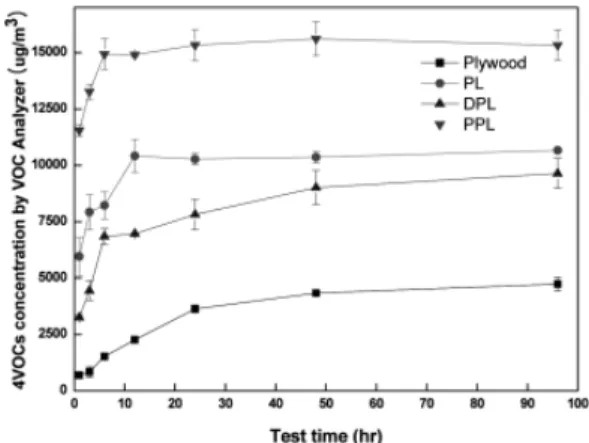
Fig. 9. VOCs emission concentrations of four finish- ing materials measured by using VOC Analyzer.
als (EVA, decorative veneer, linerboard, etc.), thus reducing the amount of VOCs emitted from the plywood within them, while the TVOC of DPL was about 3 times lower than that of PPL.
3.3. 4 VOCs Emission Concentrations by VOC Analyzer
Fig. 9 shows that the emission concentrations
of the 4 VOCs (Toluene, Ethylbenzene, Xylene, Styrene) from the specimens monitored during a period of 96 hours increased at first and then remained stable thereafter. When the VOC emission test by the VOC Analyzer was fin- ished, the values of the 4 VOCs from plywood, PL, DPL, and PPL were about 4730 µg/m3, 10669 µg/m3, 9643 µg/m3, and 15328 µg/m3, respectively.
The emission values of the 4 VOCs from plywood were lower than those of the other ma- terials, and PPL showed the highest emission tendency. The emission of the 4 VOCs from PL was higher than that of plywood, because it contains water-soluble phenolic resin. The 4 VOCs emitted from the water-soluble phenolic resin were captured in the 3-l polyester bag.
Because the decorative veneer partly pre- vented the 4 VOCs from being emitted from PL, the emission levels of the 4 VOCs from DPL were lower than those from PL. However, decorative veneer has low air tightness, because it is made from logs that have porosity.
Therefore, the concentrations of the 4 VOCs from DPL were higher than those from plywood.
On the other hand, PPL showed higher emis- sion concentrations of the 4 VOCs than the oth- er materials, because of the finishing foils being pre-impregnated with resins and lacquer and the linerboard impregnated with water-soluble phe- nolic resin.
4. CONCLUSIONS
The following conclusions can be made based on the results of this investigation:
The plywood had the highest formaldehyde emission level of about 0.048 mg/m2h, while those of PL, PPL, and DPL were 0.019, 0.016, and 0.019 mg/m2h, respectively. The TVOC emission levels from the specimens of plywood, PL, PPL, and DPL were 9.7, 2.4, 6.7, and 2.1
mg/m2h, respectively. The DPL specimen showed particularly low formaldehyde and TVOC emis- sion levels in the FLEC test.
The emission values obtained using the VOC analyzer for the 4 VOCs from plywood, PL, DPL, and PPL were about 4730 µg/m3, 10669 µg/m3, 9643 µg/m3, and 15328 µg/m3, res- pectively.
ACKNOWLEDGEMENTS
This work was financially supported by the Korea Forest Service program (500-20070113).
REFERENCES
1. Afshari, A., B. Lundgren, and L. E. Ekberg.
2003. Comparision of there small chamber test methods for the measurement of VOC emission rates from paint, Indoor Air. 13: 156∼165.
2. Anonymous. 2000. Particleboard-from start to finish. National Particleboard Association, Gai- thersburg.
3. Commission of the European Communities.
1991. Effects of indoor air pollution on human health, Report EUR 14086 EN 1991.
4. Grigoriou A. 1987. Formaldehyde emission from the edges and faces of various wood based mate- rials, Holz als Roh und Werkstoff. 45(2):63-7.
5. Guo Z, L. E. Sparks, B. A. Tichenor, and J. C.
S. Chang. 1998. Prediction the emissions of in- dividual VOCs from petroleum-based indoor coatings, Atmospheric Environment. 32: 231∼7.
6. Gustaffson H. 1992. Building materials identified as major emission sources for indoor air pollu- tants – a critical review of case studies. Docu- ment D10 1992 ISBN 91-540-5471-0 Stockholm, Sweden: Swedish Council for Building Research.
7. JIS 1901: 1995. Determination of the Emission of Volatile Organic Compounds and Aldeehydes for Building Products-Small Chamber Method.
Japan Institute of Standard, Tokyo.
8. Kim, S., J.-A. Kim, J.-Y. An, H.-J., Kim, and S.-J. Moon. 2006. Development of a test method using a VOC analyzer to measure VOC emission from adhesives for building materials J.
Adhesion Sci. Technol., 20(15): 1783∼1799.
9. Kim, S., J.-A. Kim, J.-Y. An, H.-S. Kim, H.-J.
Kim, Y. Deng, O. Feng, and J. Luo. 2006.
Physico-Mechanical Properties and the TVOC Emission Factor of Gypsum Particleboards Manufactured with Pinus Massioniana and Eucalyptus Sp., Macromolecular Materials and Engineering. 20(14): 1561∼1571.
10. Kim, S. and H.-J. Kim. 2005. Comparison of standard methods and gas chromatography meth- od in determination of formaldehyde emission from MDF bonded with formaldehyde-based resins. Bioresource Technol., 96: 1457∼1464.
11. Luo, R. 2004. Int. J. Heat. Mass Tran. 47, 2061.
12. Marutzky, R. 1994. Release of formaldehyde by wood products. In: Pizzi A, editor. Wood adhe- sives-chemistry and technology, vol. 2. New York and Basel: Marcel Dekker Inc.; 1994 [Chapter 10].
13. Nemli, G. 2003. Effects of coating materials process parameters on the technological proper- ties of particleboard, PhD. Dissertation Thesis, Karadeniz Teknik University, Trabzon, Turkey.
14. Risholm-Sundman, M. and N. Wallin. 1999.
Comparison of different laboratory methods for determining the formaldehyde emission from three-layer parquet floors, Holz als Roh-und Werkstoff. 57: 319∼324.
15. Vansteenkiste, R. 1981. Surface treatment of wood based panels. Seminar on wood based pan- els and furniture industries, Beijing, China.