1. Introduction
Pitch canker is a pine disease caused by the fungus Fusarium circinatum and has been mostly reported in
warm temperate climate regions of southern U.S.A.
(Florida, southern California), South Africa, Spain, Italia and Japan where the average temperature in January is higher than 0°C (Lee et al., 2000; Gordon
Multi-temporal Analysis of High-resolution Satellite Images for Detecting and Monitoring
Canopy Decline by Pine Pitch Canker
Hwa-Seon Lee 1)†
·
Kyu-Sung Lee2)Abstract: Unlike other critical forest diseases, pine pitch canker in Korea has shown rather mild symptoms of partial loss of crown foliage and leaf discoloration. This study used high-resolution satellite images to detect and monitor canopy decline by pine pitch canker. To enhance the subtle change of canopy reflectance in pitch canker damaged tree crowns, multi-temporal analysis was applied to two KOMPSAT multispectral images obtained in 2011 and 2015. To assure the spectral consistency between the two images, radiometric corrections of atmospheric and shadow effects were applied prior to multi-temporal analysis. The normalized difference vegetation index (NDVI) of each image and the NDVI difference (ΔNDVI = NDVI2015– NDVI2011) between two images were derived. All negative ΔNDVI values were initially considered any pine stands, including both pitch canker damaged trees and other trees, that showed the decrease of crown foliage from 2011 to 2015. Next, NDVI2015was used to exclude the canopy decline unrelated to the pitch canker damage. Field survey data were used to find the spectral characteristics of the damaged canopy and to evaluate the detection accuracy from further analysis. Although the detection accuracy as assessed by limited number of field survey on 21 sites was 71%, there were also many false alarms that were spectrally very similar to the damaged canopy. The false alarms were mostly found at the mixed stands of pine and young deciduous trees, which might invade these sites after the pine canopy had already opened by any crown damages. Using both ΔNDVI and NDVI2015could be an effective way to narrow down the potential area of the pitch canker damage in Korea.
Key Words: Pine pitch canker, Forest disease, Multi-temporal analysis, KOMPSAT, High-resolution, NDVI difference
Korean Journal of Remote Sensing, Vol.35, No.4, 2019, pp.545~560
https://doi.org/10.7780/kjrs.2019.35.4.5 ISSN 1225-6161 ( Print )
ISSN 2287-9307 (Online)
Article
Received July 16, 2019; Revised July 24, 2019; Accepted August 19, 2019; Published online August 31, 2019
1)PhD Candidate, Department of Geoinformatic Engineering, Inha University
2)Professor, Department of Geoinformatic Engineering, Inha University
†Corresponding Author: Hwa-Seon Lee ([email protected])
This is an Open-Access article distributed under the terms of the Creative Commons Attribution Non-Commercial License (http://creativecommons.org/licenses/by-nc/3.0) which permits unrestricted non-commercial use, distribution, and reproduction in any medium, provided the original work is properly cited.
et al., 2001; Wingfield et al., 2008). The pathogen of pitch canker infects pine trees through wounds made by insects, wind, hail, and machinery. The early symptoms of pitch canker are the wilting and discoloration of needles and branch dieback. Advanced symptoms of the disease are crown dieback and resinous canker on branches and main stems (Gordon et al., 2001; Wingfield et al., 2008).
In Korea, pine pitch canker is a relatively new forest disease that was firstly found in 1996 and then spread out over the country. The major host of pitch canker is confined to an exotic species of pitch pine (Pinus rigida, PR) that was planted widely over the country.
While the Korean red pine (Pinus densiflora), which is the primary native pine species in Korea, is known to be resistant to pitch canker (Woo et al., 2011), another native black pine (Pinus thunbergii, PT) was found to be susceptible to the disease. Considering that pitch canker mainly occurs in warm temperate climate regions, the occurrence of pitch canker in Korea appears to be an exceptional case and has drawn special attention regarding the regional climate change (Lee et al., 2000;
Choi et al., 2010). Although pitch canker has not been considered as a critical forest disease in Korea, with only minor crown damage and low mortality in Korea (Choi et al., 2010), it has the potential to cause serious damage over the country. Due to the difficulty of detecting the damaged trees over large geographical area, the outbreak of pitch canker has been monitored at only a few field sites. Therefore, it has been rare to find pitch canker related studies analyzing the spatial pattern of its occurrence and spread.
Remote sensing has been an effective and efficient way of monitoring forest disease by providing timely information of the disease over a wide geographical area. The spatial resolution of remote sensing data is an important factor to detect the extent and spatial distribution of forest disease. Since the 1970s, medium- resolution satellite images such as Landsat, SPOT, and ASTER have been extensively used for detecting forest
diseases at a stand level (Franklin et al., 2003; Skakun et al., 2003; White et al., 2006). However, the use of these medium-resolution images is limited when the size of the canopy damage is much larger than the spatial resolution of images. The development of the commercial high-resolution satellite images, such as IKONOS, QuickBird, and WorldView, allows us to detect forest damage at a fine spatial scale (Kim et al., 2003; White et al., 2005; Coops et al., 2006; Wulder et al., 2008; Hicke and Logan, 2009; Dennison et al., 2010; Poona and Ismail, 2013; Ortiz et al., 2013;
Vaughn et al., 2018). Recently, digital aerial photographs acquired by unmanned aerial vehicles that provide centimeter-resolution images are becoming an effective tool for detecting damage at the individual tree level (Näsi et al., 2015; Kim et al., 2017; Lee et al., 2019;
Safonova et al., 2019).
The typical way of detecting forest disease using remotely sensed data has been based on the spectral reflectance between damaged trees and healthy trees (Lee et al., 2014; Kim et al., 2015). The detectability with remote sensing data depends upon the severity of crown damage. A severely damaged tree such as a dead tree with red foliage was successfully detected (Coops et al., 2006). While intermediate-damaged trees were detected with lower accuracy due to their spectral similarity with healthy trees (Dennison et al., 2010;
Meddens et al., 2011). Intermediate-damaged trees represent minor symptoms associated with a slight leaf discoloration, a partial loss of foliage mass, or decrease of leaf water content. Since multi-temporal analysis can emphasize the slight difference of spectral reflectance caused by leaf discoloration and decreased foliage mass (Hart and Veblen, 2015), it has been commonly used for detecting the intermediate-damaged trees.
Meddens et al. (2013) classified mountain pine beetle
tree mortality using single- and multi-date Landsat TM
and ETM+ images and noted that the multi-temporal
analysis produced higher accuracy for detecting
intermediate-mortality forest. DeRose et al. (2011) and
Hart and Veblen (2015) detected minor damage by spruce beetle using single- and multi-date Landsat images and multi-temporal analysis produced more accurate results than single-date analysis. Multi-temporal analysis has been also utilized for monitoring minor forest decline caused by environmental and ecological stresses such as drought, frost, cold wave, and pollutant (Wang et al., 2007; Xi et al., 2016; McCarthy et al., 2018).
Only a few studies have examined pine pitch canker using remotely sensed data. High-resolution satellite images and digital aerial photography were used to detect pitch canker damaged trees in South Africa and California (Crowley et al., 2009; Poona et al., 2013).
In these studies, stand density was low and individual tree crowns were sparsely distributed with low canopy closure. The severity of the tree crown damage in these regions was also different from that in Korea where pitch canker damage is found in groups of a few trees each within dense plantation pine stands. This study tries to find a suitable method for detecting and monitoring the canopy decline by pine pitch canker in Korea where the spatial pattern and the severity of crown damage are different from those of other critical forest diseases. Although the pitch canker damage shows the partial loss of foliage mass and leaf discoloration, they are not well distinguished even from very high-resolution aerial photographs. Considering the lack of pitch canker related studies in Korea, the effective way of detecting the damaged trees over wide geographic area can provide valuable information to characterize and to prevent the disease.
2. Study area and Data Used
The study area covers an area of 6.4 × 13.5 km
2located in Heanam, Jeollanamdo, which is the southwestern coastal area of the Korean. Jeollanamdo has the largest plantation pine forests in Korea, in
particular for PR that is the major host species of pitch canker. PR was introduced from the North America in 1970s and extensively planted. Native PT trees were mostly planted near the coastal areas. The plantation pine forests have reached 30 to 40 years old age and mean diameter at breast height (DBH) of the trees is larger than 20 cm. Some of these pine forests had been harvested and either replanted or converted to other land uses. The pitch canker damage reached the highest in 2004 and has been gradually decreased since then (Choi et al., 2010). However, Jeonllanamdo showed a rapid increase of pitch canker damage particularly in 2014 and 2015 (Choi et al., 2015). Average monthly temperature in January in this area is 1°C, which equates to a warm temperate climate condition for pitch canker, although it also occurs in other colder regions in Korea.
We used multi-temporal images obtained from the Korean Multi-Purpose SATelite (KOMPSAT) satellites with a spatial resolution of KOMPSAT multispectral image was comparable to the average crown diameter of pine trees. The KOMPSAT-3 multispectral image has a finer spatial resolution of 2.8 m, compared to 4 m for the KOMPSAT-2 multispectral image. Both KOMPSAT-2 and KOMPSAT-3 have four multispectral bands of blue (450-520 nm), green (520-600 nm), red (630-690 nm), and near-infrared (NIR; 760-900 nm) and have the same spectral wavelength region.
Table 1 details the KOMPSAT-2 and KOMPSAT-3
images used for the study. The two images were
provided as L1B processing level after preliminary
radiometric and geometric corrections. In using multi-
temporal images for detecting forest change, two
images must be acquired in a similar phenological stage
to avoid any inconsistence due to leaf growth. As the
pitch canker has occurred in PR and PT trees only, the
effects of deciduous tree and other herbaceous plants
need to be considered. In the greening season, the
crowns of coniferous trees and the crown of a few
deciduous trees was mixed even in these relatively
homogenous plantation pine forests. In the fall season, the green foliage of deciduous trees changes to red and yellow, which might be confused with leaf discoloration resulting from pitch canker. Thus, the optimal period for detecting pitch canker damage is prior to the greening season. Considering the increased pitch canker damage in 2014 and 2015 and the low damage in 2011, we selected two KOMPSAT images acquired on March 15, 2015, and April 20, 2011, when leaf growth of deciduous trees had not yet fully started yet in this area. Although the 2015 image was obtained about one month prior to the 2011 image, the growing stage of the forest canopy between the two images was not greatly different in these pine plantation forests.
In addition to the satellite images, the digital map of forest stands was also used to extract only the areas of the PR and PT forests. The digital forest stand map over the study area was produced in 2009 by the visual interpretation of the aerial photos taken in 1999 and the field survey by the Korea Forest Service (Ryu et al., 2010). The map classifies forest stands by species, age, DBH, and crown closure.
3. Pre-processing of the KOMPSAT multispectral images
To detect pitch canker damage, the processing of KOMPSAT multispectral images can be divided into two parts. The first part is a preprocessing step to minimize atmospheric and shadow effects on the two images. When applying a multi-temporal approach for forest change detection, the radiometric and spectral properties between the two images should be consistent.
The second part is for the detection of pitch canker damage using the multi-temporal images.
1) Ortho-rectification
To identify meaningful change in surface parameters from multi-temporal images, the images should be precisely registered at the same geographic coordinates.
The geographic coordinates were often inconsistent in mountainous area due to terrain relief displacement.
Further, the two KOMPSAT images were obtained at different viewing and sun angles, which cannot be corrected by a simple rubber-sheeting geometric correction. The two KOMPSAT images were ortho- rectified using digital elevation model (DEM) data with twenty-eight ground control points and were registered to the plane rectangular coordinate system (UTM zone 52 North). The KOMPSAT-2 image was resampled into 2.8 m to match the spatial resolution of the KOMPSAT-3 image. Geometric accuracy of the ortho-rectification was less than one-pixel distance, in which the total root mean squared error of the KOMPSAT-3 and KOMPSAT-2 images were 0.45 and 0.97, respectively.
2) Radiometric corrections of atmospheric and shadow effects
To compare spectral signals between the two images, digital number (DN) values should be converted into surface reflectance, normalizing the difference in
Table 1. Details of the two KOMPSAT multispectral imagesused in this study
Satellite KOMPSAT3 KOMPSAT2
Altitude 685 km 685 km
Inclination 98.13 degree 98.13 degree Swath width 16 km (nadir) 15 km (nadir)
Spatial resolution 2.8 m 4 m
Spectral bands
Blue 450-520 nm Green 520-660 nm
Red 630-690 nm NIR 760-900 nm
Blue 450-520 nm Green 520-660 nm
Red 630-690 nm NIR 760-900 nm Radiometric
resolution 14 bit 10 bit
Acquisition date Mar 15, 2015 Apr 20, 2011
Time (UTC) 04:33 01:09
Center Lat/Lon 34.53/126.61 34.65/128.65
Solar Zenith 55.7 39.7
Solar Azimuth 205.7 116.6
Viewing Zenith 16.7 17.6
Viewing Azimuth 164.3 257.1
atmospheric effects, solar irradiance, sensor viewing angle, and shadow effects between the two images.
Atmospheric correction that converts a raw DN to surface reflectance (ρ) on both images was conducted using the quick atmospheric correction method, which determines atmospheric compensation parameters directly from the image, without any ancillary information (Bernstein et al., 2012). It is based on the empirical line correction using the average reflectance over various material spectra. The spectral response functions of the two KOMPSAT multispectral sensors were used.
Unlike medium-resolution images such as Landsat ETM+ obtained at almost the same local time, high- resolution satellite images were often obtained from off-nadir viewing angles because of the narrow swath width (Fan et al., 2014). The study area includes mountainous forests with shadow effects that were produced by both topography and tree crowns. Shadow effects are not the same between the two KOMPSAT images because they were obtained at different viewing and sun angles. In addition to the shadow effects produced by topography, the high-resolution image also shows site-specific shadow effects caused by neighboring tree crowns. These shadow effects in multi-temporal images limit the detection of any canopy change caused by forest damage, growth, and drought (Gu and Gillespie, 1998).
Topography-induced shadow effects could be reduced by normalizing the different solar irradiance using DEM data. However, such methods often produced problems of under-correction and over-correction due to the Lambertian assumption and neglect of the effects of diffuse sky irradiance. Recently, improved shadow correction methods based on the sun-canopy- sensor (SCS) or the sun-crown-sensor geometry have been developed (Gu and Gillespie, 1998; Fan et al., 2014). We applied the SCS+C based shadow correction method (Equation 1) (Fan et al., 2014). The C- correction coefficients can address the effect of diffuse irradiance. The C-correction coefficients for each band
were derived from the semi-empirical equation between ρ and cosi obtained over homogenous forest stands having the same stand age and density for both the 2011 and 2015 images. For every pixel, local incidence angles and slope angles were derived from the DEM data.
ρ
o= ρ ( ) (1)
Where ρo= normalized reflectance of a horizontal surface,ρ = reflectance of an inclined surface shown in image,
c = correction coefficients,
i = solar incidence angle relative to the local terrain surface,
θs= solar zenith angle, α = slope angle,
φn= aspect angle
3) Verification of radiometric corrections After correcting the atmospheric and shadow effects, the surface reflectance from the two KOMPSAT satellite images should be comparable. We selected several invariant targets (artificial turf, green track, concrete, asphalt, and water) that were assumed to have been unchanged between 2011 and 2015 and compared their surface reflectance. As seen in Fig. 1, the surface reflectance of the sample invariant targets extracted from the two corrected images were highly correlated (r
2= 0.97) and very consistent (slope is close to 1.0) between 2011 and 2015 in both red and NIR bands.
Since the spectral reflectance was comparable between the two images, any decrease in NIR reflectance and normalized difference vegetation index (NDVI) from 2015 to 2011 can be regarded as due to a decline of pine canopy for any reasons, including pitch canker.
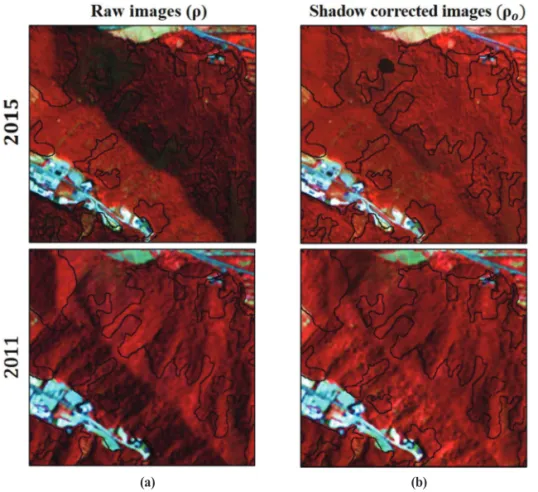
The raw KOMPSAT images over the mountainous area clearly show sunlit and shade areas (Fig. 2(a)). The solar zenith angle in the 2015 image was larger than in the 2011 image, generating a wider shadow area over mountainous forests. The direction of sunlit and shaded parts was almost opposite in the two images since the 2015 and 2011 images were acquired at a solar azimuth angles of 206 and 117 degrees, respectively. After
cosθ
scosα + c
cosi + c
applying the SCS+C shadow correction method, the tonal and color difference between the sunlit and shaded areas was diminished (Fig. 2(b)). In addition to
the visual comparison on the shadow correction effect, spectral reflectance values were derived from each of sunlit and shaded area having the same homogeneous
(a) (b)
Fig. 2. Comparison of raw (a) and shadow-corrected (b) images. The two KOMPSAT images show different shadow effects due to the different viewing and solar angles.
(a) (b)
Fig. 1. Comparison of the surface reflectance of invariant targets in red band (a) and NIR band (b) between 2011 and 2015 KOMPSAT images after the radiometric correction of atmospheric and shadow effects.
forest stand characteristics. Table 2 compares the spectral reflectance extracted from the raw image (ρ) and from the corrected image (ρ
o). The difference in the spectral reflectance between the sunlit and shaded areas was relatively large before the correction, but noticeably decreased in both red and NIR bands after the correction.
Although NDVI has been known to normalize certain amount of the topography-induced shadow effect, the NDVI difference between the sunlit and shaded areas substantially diminished after the correction.
4. Detection of pitch canker damaged canopy
After the radiometric corrections of the atmospheric and shadow effects on the two KOMPSAT images, we tried to detect pitch canker damaged canopy by multi- temporal analysis of 2015 and 2011 images. First, we tried to detect any canopy decline using the NDVI difference (ΔNDVI) alone. Field survey was conducted on the initial candidate sites to find spectral properties of pitch canker damaged canopy and to assess the detection accuracy of pitch canker damages from further analysis using both ΔNDVI and NDVI
2015. 1) Detection of canopy decline using NDVI
difference
If pitch canker damages bring high mortality, such as pine wilt disease, it would show fully discoloration
or complete loss of tree crown and it can be detected in single image of 2015. However, when we selected a few damaged trees of known locations in the color composite of the 2015 KOMPSAT image, they were not well distinguished from the surrounding healthy trees. The minimal difference in spectral reflectance between the damaged and healthy trees, which was also reported in a previous pitch canker study (Poona and Ismail, 2013), can be explained by the partial loss of crown foliage.
Considering the difficulty of detecting the pitch canker damage by the 2015 image alone, we tried to compare the NDVI of two KOMPSAT images.
NDVI
2011and NDVI
2015were produced using the red band (630 nm ~ 690 nm) and NIR band (760 nm ~ 900 nm) from the radiometrically corrected KOMPSAT images (equation 2). The NDVI data were only calculated for the area of PR and PT forest stands that were extracted from the forest stand map.
NDVI = (2) In the absence of any substantial change, the NDVI would increase due to ingrowth from 2011 to 2015.
However, as seen in Fig. 3, the average NDVI
2015was lower than NDVI
2011. Fig. 3 shows that low NDVI (less than about 0.5) pine stands increased while high NDVI pine stands (larger than 0.5) decreased in 2015 as compared to 2011. There was no difference in stand age, DBH, and crown closure between these two groups (less and larger than 0.5) as assessed by the
ρ
NIR– ρ
redρ
NIR+ ρ
red Table 2. Comparison of spectral reflectance between the raw and shadow corrected imagesρ (raw) ρo(corrected)
Sunlit part
ρsunlit Shaded part
ρshaded Difference
ρ Sunlit part
ρo, sunlit Shaded part
ρo, shaded Difference
ρo
Red2015 0.0374 0.0274 0.0100 0.0337 0.0340 -0.0003
NIR2015 0.1875 0.1200 0.0675 0.1627 0.1661 -0.0034
Red2011 0.0337 0.0296 0.0041 0.0367 0.0391 -0.0024
NIR2011 0.1915 0.1603 0.0321 0.2055 0.2157 -0.0102
NDVI2015 0.6670 0.6269 0.0400 0.6558 0.6579 -0.0020
NDVI2011 0.6996 0.6883 0.0113 0.6962 0.6930 0.0039
forest stand maps. The increase of low NDVI stands may be explained by the ingrowth of healthy pine trees from 2011 to 2015. In contrast, the decrease of high NDVI stands might be related to the relatively mature pine trees that had been suffered canopy decline caused by pitch canker and other damages.
We used the NDVI difference (ΔNDVI) between the two images. It was produced by subtracting the NDVI
2011from the NDVI
2015(Equation 3).
ΔNDVI = NDVI
2015– NDVI
2011(3) Initially, ΔNDVI was used for separating pine stands that were assumed to be suffered any canopy decline.
As seen in Fig. 1, the radiometrically corrected two images show 1:1 relationship in red and NIR reflectance in invariant targets. Therefore, the zero ΔNDVI can imply that there was no substantial change in pine canopy if the slight ingrowth from 2011 to 2015 was not accounted for. The negative ΔNDVI indicates the decrease of crown foliage and the discoloration of pine needles in 2015. The loss of crown foliage and discoloration are closely related to pitch canker damage that should be included within the range of negative ΔNDVI values. We initially selected only those sites having negative ΔNDVI that include pitch canker damaged trees as well as other trees suffered canopy decline.
2) Field survey
Field survey was conducted to find the spectral characteristics of damaged canopy and to evaluate the detection accuracy of pitch canker damages. We visited 29 sites of the canopy decline sites determined by the negative ΔNDVI threshold and collected canopy decline status, forest type, average tree size on November 6 and 7, 2015. Each of the field survey sites was large enough to cover several pixels of the KOMPSAT image. We used portable global position system (GPS) to record the exact location of the 29 sample sites. The time gap between the 2015 image acquisition and the field survey could be a problem when new outbreak of pitch canker occurred after the image acquisition. Knowing that there was no typhoon and heavy wind damages that cause wounds for pitch canker to infect in 2015, the time gap would not be serious problem.
After the field survey on the negative ΔNDVI sites, the survey sites were divided into three classes of damage of pitch canker, no-damage, and regeneration.
Among the 29 sites, 18 sites were confirmed as the pitch canker damaged canopy and all these sites were PR although two sites were mixed with deciduous trees (PRM). We found that most pitch canker damaged trees still had crown although they showed different levels of branch loss and leaf discoloration. The seven sites did not show pitch canker damages and they were pine stands mixed with a few deciduous trees (PRM, PTM).
Although black pine (PT) was known to be susceptible to pitch canker, no PT stands showed pitch canker damage. Remaining four sites were replanted forest after clear-cut between 2011 and 2015.
3) Detection of pitch canker damage using both NDVI difference and NDVI
2015Although the pine stands of the negative ΔNDVI include pitch canker damaged trees, they also include other types of canopy decline from 2011 to 2015. To
Fig. 3. Comparison of histograms of NDVI2015and NDVI2011within the pine forests.
find spectral characteristics of three classes, we extracted ΔNDVI and NDVI from the multi-temporal images.
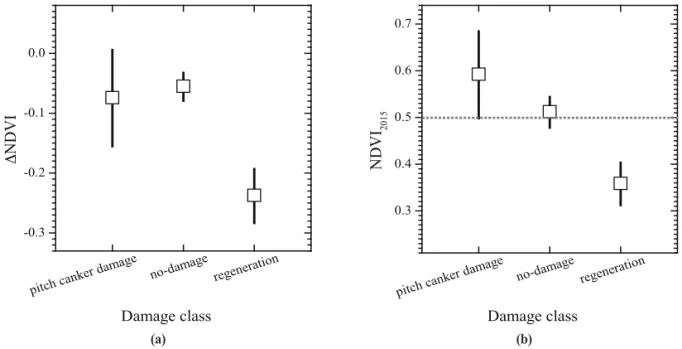
We randomly selected only 11 sites (4 sites from the damage, 3 sites from the no-damage, and 4 sites from the regeneration) to minimize the dual use of samples for setting thresholds and for assessing the detection accuracy.
Among the three classes, the regeneration can be easily separated from the ΔNDVI statistics (Fig. 4(a)).
The low ΔNDVI threshold (less than about -0.2) can easily eliminate the regeneration stands from the other two classes. The forest stand map did not exactly correspond to the forest cover type status in 2011 since it was made in 2009 using aerial photos taken in 1999.
The ΔNDVI statistics of the damage and no-damage classes were completely overlapped. Hence, using ΔNDVI alone is not appropriate to correctly detect the pitch canker damage.
Since the use of ΔNDVI alone generates too many candidates of pitch canker damage site, we further used NDVI
2015to separate the pitch canker damaged canopy from the no-damage PRM and PTM stands. In Fig. 4(b), the NDVI
2015of the two classes show slight
difference although they still have some overlap. Since pitch canker damaged trees show relatively mild crown damage in lower part of the crown, they still maintain relatively high NDVI
2015value. The no-damage PRM and PTM class shows slightly lower NDVI
2015than the damage class, which might be due to the leaf-off condition of deciduous trees in March. Possible threshold to separate the two classes would be somewhere around 0.54 that is about the middle of the two classes. However, the minimization of omission error has been always priority in detection of forest disease for preventing further spread. Therefore, we applied the 0.5 threshold in the NDVI
2015to reduce the missing error of detecting the pitch canker damage. Eventually, the twofold thresholds of (ΔNDVI < 0) and (NDVI
2015> 0.5) were used to detect the pitch canker damaged canopy.
5. Results and Discussion
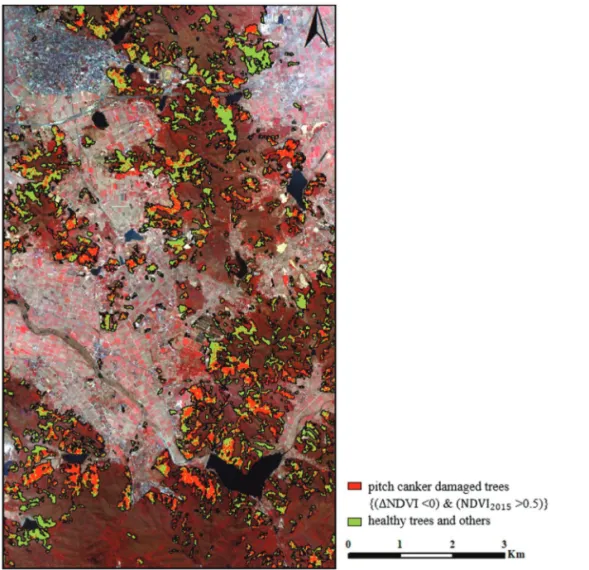
Fig. 5 shows the potential sites of pitch canker damage detected by the twofold thresholds on ΔNDVI and NDVI
2015. The total area of pitch canker damage is 384
(a) (b)
Fig. 4. Statistics of ΔNDVI and NDVI2015for the three classes obtained from the field survey sample sites (mean ± standard deviation).
hectares, which is 33.7% of entire PR and PT forests.
Although there was no accurate survey on pitch canker damage in this area, as well as the other part of the country, the damage ratio of 33.7% may be slightly overestimated since pitch canker in this area is not very contagious and found sporadically with groups of a few trees. The damaged area could be decreased if we narrow down the thresholds on ΔNDVI and NDVI
2015. Selection of proper threshold is always subjective to the availability of reference data. In the detection of forest insect and damaged trees, minimizing omission error should be prioritized to prevent the spread of the damage. A loose threshold may provide low omission error but include many false alarms. The potential
sites of pitch canker damage detected by the twofold thresholds may include not only the actual damage in 2015 but also the damage occurred between 2011 and 2015. The use of ΔNDVI and NDVI
2015detects the canopy damage condition of 2015. For any pitch canker damage occurred from 2011 to 2015, the loss of crown foliage condition may have remained in 2015.
To evaluate the accuracy of pitch canker detection using ΔNDVI and NDVI
2015, field survey data were used. Out of the total 29 field samples, 21 sites corresponded to the twofold thresholds (ΔNDVI < 0) and (NDVI
2015> 0.5). Table 3 shows the results of the detection accuracy as well as the commission and omission errors. Among the 21 sites detected as the
Fig. 5. KOMPSAT high-resolution multispectral images obtained on March 15, 2015 and the distribution of potential sites of pitch canker damage detected by ΔNDVI and NDVI2015.
pitch canker damage, 15 sites were correctly detected as the damage. Although the accuracy assessment was based on the limited number of sample sites, the resulting 71.4% detection accuracy was encouraging considering the subtle spectral difference of the damaged tree crowns. The severity of pitch canker damage is often graded as the ratio between the numbers of damaged branches and the total number of branches. The severity of pitch canker damage in this region was reported to be less than 40% by the Korea Forest Service (Choi et al., 2010). The damage was more evident in the low part of a tree crown, which might not be clearly shown in a single-date high resolution image (Gooshbor et al., 2016). Therefore, an accuracy of 71.4% could be obtained only by the multi-temporal analysis. Multi-temporal analysis can enhance the minor change associated with the decrease of foliage mass and can alleviate background effects once the tree canopy is open.
Among the 21 sites detected as the damage by the dual thresholds, the six sites did not show the pitch canker damage. The incorrectly detected six sites were pine canopy mixed with young deciduous trees (PRM, PTM). Most of the PR and PT forests were pure plantation stands and, therefore, they should have no other species. However, once the relatively mature pine canopy was opened for any reasons such as pitch canker, wind, drought, and natural death, deciduous species might invaded to the pine stand. The 2015
KOMPSAT image used was obtained in March when the deciduous trees had no leaves yet. The total amount of pine canopy foliage of the six PRM and PTM was less than that of the purely dense pine stands because of the leaf-off condition in deciduous trees. Therefore, the mixed PRM and PTM were incorrectly detected as damaged trees. Among the 18 sites of true damage, three sites were missed by the twofold thresholds.
These three sites turned out as relatively sparse canopy condition in 2015 and, therefore, excluded by the second threshold of (NDVI
2015> 0.5). If the proportion of young deciduous trees was higher than that of pine trees, NDVI
2015value in the spring image would be even lower than healthy pine trees, which might be the case of the missing error.
Although the additional use of NDVI
2015enabled us to exclude the regeneration class, it was not very effective to separate the true pitch canker damage from the no-damage mixed stands. The use of NDVI
2015reduced only one false alarm in the PRM, in which the NDVI
2015threshold selected from the sample sites in Fig. 4(b) might not be effective to remove the no- change class.
As seen in Fig. 4(a), the regeneration class could be easily separated by a ΔNDVI threshold (less than -0.2) without the use of NDVI
2015. Since the twofold thresholds did not contribute much to remove the false alarms, one might think the use of only ΔNDVI alone.
However, when we look at the joint distribution of
Table 3. Detection accuracy by applying twofold thresholds on ΔNDVI and NDVI2015Damage
Class Forest type # of survey sites # of detection by the
twofold thresholds commission error
(# of false alarms) omission error (# of missing)
Damage PR 16 15 0 1
(PR mixed with deciduous)PRM 2 0 0 2
No-damage PTM
(PT mixed with deciduous) 4 4 4 –
PRM 3 2 2 –
Regeneration after clear-cut 4 0 0 –
Total 29 21 6 3
Detection accuracy = 15/21 = 71.4%
ΔNDVI and NDVI
2015over the whole pine forests, we can find the advantage of using the twofold thresholds to narrow down the potential sites of the pitch canker damage (Fig. 6). The total area of the pitch canker damage by the twofold thresholds of (ΔNDVI <0) and (NDVI
2015>0.5) yield 384 hectares (red box in Fig. 6).
If we use only a single threshold (-0.3 < ΔNDVI < 0) without the NDVI
2015, the total damaged area would be 763ha that would include too many false alarms.
We extracted those pixels corresponding to the location of the 21 field survey sites detected by the twofold thresholds on the ΔNDVI and NDVI
2015images and then analyzed their distribution. All 21 sites had negative ΔNDVI ranging from -0.02 to -0.09.
NDVI
2015values of the 15 sites confirmed as pitch canker damaged trees ranged between 0.5 to 0.7 because of the different levels of damage severity. NDVI
2015of the six mixed stands were distributed within a narrow range between 0.50 and 0.55 regardless of ΔNDVI value. While the 15 sites of pitch canker damage showed different levels of crown closure, the six sites of PRM and PTM had relatively open canopy because of the leaf-off condition of deciduous trees in early spring.
The detection accuracy may vary by the thresholds
used. The initial thresholds were determined by the presumed canopy conditions of 2015 and 2011.
Because of the limited number of field sample plots, we could have not applied a statistically meaningful thresholding. In this study as well as other forest disease detections, the priority has been to minimize the omission errors. If we apply a narrower NDVI
2015threshold of 0.54 rather than 0.5 used, the detection accuracy would increase to 76.5% yielding the higher omission error of 5 sites. If we apply a wider NDVI
2015threshold of 0.48 rather than 0.5, the detection accuracy would decrease to 68.2% yielding the more false-alarms. As suggested by Pause et al. (2016), accurate thresholds can be set by using reliable field samples, which can reduce uncertainty for detecting forest disease. If we applied the same method used in this study to other forests, proper thresholds on ΔNDVI and NDVI
2015should be obtained by careful and more field works that are temporally close to the image acquisition time.
Since the pine forests in the study area have high density, the tree crown shadow effects might have affected NDVI. Asner and Warner (2003) reported that crown shadow effects become stronger with increasing forest stand density. The NDVI values of shadowed crown and pitch canker damaged crown could be similar each other. Since the KOMPSAT images used were obtained at different viewing and sun angles, the shadow produced by nearby trees may have affected the canopy reflectance. Although we applied the shadow correction method, the crown shadow effect may have remained in these high-resolution images. In further study, microsite crown shadow effect should be carefully investigated in multi-temporal analysis to minimize the detection error.
6. Conclusions
In this study, we tried to find a proper method for detecting pitch canker damage that showed rather
Fig. 6. Density scatter-gram of NDVI2015and ΔNDVI. TheNDVI2015shows the canopy condition in 2015 while the ΔNDVI indicates the difference of NDVI2015and NDVI2011.