1. Introduction
Since the rapidly increasing trend of global warming, meteorological disasters have frequently occurred
across the world. Losses of human life and property have steadily increased due to heavy rainfall, typhoons, tornadoes, and flash flooding. Atmospheric water vapor is a key quantity in severe weather and climate studies
Retrieval and Validation of Precipitable Water Vapor using GPS Datasets of Mobile Observation Vehicle
on the Eastern Coast of Korea
Yoo-Jun Kim*
†, Seon-Jeong Kim*, Geon-Tae Kim*, Byoung-Choel Choi*, Jae-Kwan Shim* and Byung-Gon Kim**
* High Impact Weather Research Center, Observation Research Division, National Institute of Meteorological Sciences, Korea Meteorological Administration
** Department of Atmospheric and Environmental Sciences, Gangneung-Wonju National University
Abstract : The results from the Global Positioning System (GPS) measurements of the Mobile Observation Vehicle (MOVE) on the eastern coast of Korea have been compared with REFerence (REF) values from the fixed GPS sites to assess the performance of Precipitable Water Vapor (PWV) retrievals in a kinematic environment. MOVE-PWV retrievals had comparatively similar trends and fairly good agreements with REF- PWV with a Root-Mean-Square Error (RMSE) of 7.4 mm and R
2of 0.61, indicating statistical significance with a p-value of 0.01. PWV retrievals from the June cases showed better agreement than those of the other month cases, with a mean bias of 2.1 mm and RMSE of 3.8 mm. We further investigated the relationships of the determinant factors of GPS signals with the PWV retrievals for detailed error analysis. As a result, both MultiPath (MP) errors of L1 and L2 pseudo-range had the best indices for the June cases, 0.75-0.99 m. We also found that both Position Dilution Of Precision (PDOP) and Signal to Noise Ratio (SNR) values in the June cases were better than those in other cases. That is, the analytical results of the key factors such as MP errors, PDOP, and SNR that can affect GPS signals should be considered for obtaining more stable performance. The data of MOVE can be used to provide water vapor information with high spatial and temporal resolutions in the case of dramatic changes of severe weather such as those frequently occurring in the Korean Peninsula.
Key Words : Global positioning system, Mobile observation vehicle, Precipitable water vapor, Eastern coast of Korea
Received June 9, 2016; Revised July 7, 2016; Accepted July 16, 2016.
†
Corresponding Author: Yoo-Jun Kim ([email protected])
This is an Open-Access article distributed under the terms of the Creative Commons Attribution Non-Commercial License (http://creativecommons. org/licenses/by-nc/3.0) which permits unrestricted non-commercial use, distribution, and reproduction in any medium, provided the original work is properly cited
Article
due to its status as not only a greenhouse gas but also an energy source that generates meteorological disasters (Lee et al., 2013; Webb et al., 2016). While Global Positioning System (GPS) technology has been applied in such sectors as transportation, communication, agriculture, and tourism, the retrieval techniques of Precipitable Water Vapor (PWV) from a ground-based GPS have been utilized to validate satellite and reanalysis data for the meteorological purpose (Kuo et al., 1993; Dietrich et al., 2004). In particular, PWV estimates from static ground-based GPS receivers have been operationally assimilated into Numerical Weather Prediction (NWP) models to be used alone or as a component of the Zenith Total Delay (ZTD).
Despite progress made in the numerical forecasting skill, NWP model performance is still limited in areas with data sparse such as mountains and oceans (Webb et al., 2016). Therefore, a well-designed observation method and relevant new paradigm for the observation framework are required to capture accurate information of the atmospheric state such as PWV in the applicable regions. In addition, it is necessary to understand the characteristics of PWV with high temporal resolution for detecting very small-scale meteorological phenomena. However, radiosondes, MicroWave Radiometers (MWRs), and meteorological satellites often do not provide sufficient accuracy and temporal/ spatial resolution to capture the distribution of PWV (Rocken et al., 2005).
In this regard, retrieval techniques of PWV based on moving platforms with GPS have been attempted to obtain high-resolution data in areas with sparse data.
Rocken et al. (2005) demonstrated that the accuracy of PWV by using GPS data from a cruise ship is quite reliable under cloud-free conditions in the open ocean, showing a Root-Mean-Square Error (RMSE) at the millimeter level. Moreover, Webb et al. (2016) reported the results of validation between the interpolated Zenith Wet Delay (ZWD) of the fixed
GPS site and the retrieval of ZWD by using GPS receivers and pressure sensors installed on a moving train platform of a mountain railway with a repeatable trajectory.
Although other studies have been conducted on the applications of mobile GPS, most focus on the geology, geodesy, and positioning (Daud et al., 2008;
Chen et al., 2011; Martin et al., 2012). Moreover, the application of GPS-related PWV retrieval to meteorological fields based on a mobile vehicle platform is extremely rare except for that by ship, train, or airborne (Rocken et al., 2005; Skone et al., 2006;
Fujita et al., 2008; Boniface et al., 2012; Webb et al., 2016). GPS observations by using mobile vehicles are needed, because tracking of human activity is rather important and observation of inland vertically- integrated water vapor can be useful for meteorology and climate studies. In addition, it is important to obtain useful data for high resolution PWV from mobile vehicles with GPS in areas of limited permanent GPS station such as those with complex terrain and rugged mountains in the Korean Peninsula.
In this study, we conduct PWV retrieval
experiments by using received GPS datasets of mobile
observation vehicle on the eastern coast of Korea in
2014. For the purpose of evaluation with reliable
statistical results, we compare mobile GPS-derived
PWVs to those of three nearby fixed sites situated
along the east coastline. As shown in previous studies
(Kjørsvik, 2006; Kwon et al., 2011; Yao et al., 2014),
it is important to consider the characteristics of GPS
signals contaminated with Multi-Path (MP) error,
Signal to Noise Ratio (SNR), and satellite geometry
such as Position Dilution Of Precision (PDOP) and the
number of satellites. Since few previous studies
include meteorological applications in Korea, we
further investigated the relationships of determinant
factors such as PDOP, SNR, and MP of the GPS
signals with the PWV retrievals for meteorological
application by using the collected data from GPS
receivers in kinematic environments to conduct error analysis.
2. Data and Method
1) Mobile Observation Vehicle
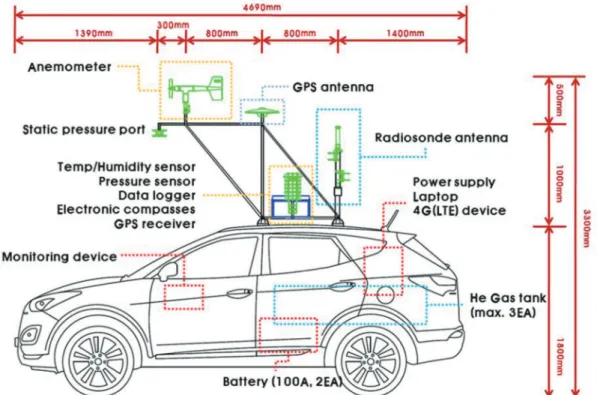
Mobile Observation Vehicles (MOVE), first introduced by the National Institute of Meteorological Sciences, Korea Meteorological Administration, have been used to investigate target observations and meteorological disasters since 2012 (Kim, Y. et al., 2014). The MOVE used in this analysis is equipped with a GPS receiver system including a Zephyr Geodetic II antenna and a NetR9 receiver (Trimble, California) in addition to a ground Automatic Weather System (AWS) including temperature and pressure sensors and an upper-air sounding system including a radiosonde receiver and a Helium gas tank. These
instruments and a detailed schematic diagram of MOVE are shown in Fig. 1. The PWV in the atmosphere and positional information by using MOVE were retrieved through a signal delay from the GPS receiver. The detailed retrieval methods of PWV are described in section 2.2.
To analyze long-term GPS data received from the antenna mounted on the roof of the MOVE, we selected moving cases on the eastern coast of Korea in 2014.
Data were collected for 33 days between March 27 and July 14. The MOVE was driven on a local road (Route 7) along the east shore with data retrieved at a rate of 30-s. The moving route and corresponding time of the MOVE are shown in Fig. 2. Data were collected at 2- h and 30-min between 0000 and 0230 UTC. The vehicle began to move at point A (Gangneung city) and ran 48 km to point B (Naksan Beach) in about 1-h.
After a 20-min stop at point B in static mode, the MOVE resumed running through point C (Jumunjin- eup) and finally arrived at point D. The cruise control
Fig. 1. Detailed schematic diagram of mobile observation vehicle (MOVE) equipped with global positioning system (GPS) instruments.
was set at 60 km h-1 for each route. The road is two- laned with little traffic on week days. The route observation was mostly clear except for some areas obscured by trees and construction.
2) Retrievals of PWV
In most commercial and scientific GPS kinematic methods, the differential approach is used with data from a base station and a rover receiver. Satellite clock errors and some portion of orbit errors can be effectively resolved during the double-differencing process (Zhang et al., 2007; Lee et al., 2013). Despite its obvious advantages, however, the main limitation in double differencing is that the volume of residual errors increases as the distance between the base and rover receivers increases (Martin et al., 2012). An alternative method is a kinematic precise point positioning (Kinematic-PPP), which does not require differential infrastructure in the form of data from regional or local base receivers. Moreover, this method requires only a single GPS receiver, thus yielding significant operational flexibility and cost reduction.
Therefore, the GPS-based application for land vehicles is of particular interest (Kjørsvik, 2006).
The GPS data were processed in a Kinematic-PPP mode to retrieve water vapor with an absolute solution not limited by distance from a base station on kinematic platforms utilized for previous studies (Rocken et al., 2005; Webb et al., 2016). In addition, Real-Time Kinematic LIBrary (RTKLIB) software 2.4.2 developed by Takasu et al. (2007) was used for post-processing with a Kinematic-PPP strategy by using a Kalman-type filter to estimate the ZTD. For the offline experiments, we used the Receiver INdependent EXchange format (RINEX) to apply RTKLIB for RTK positioning (RNX2RTKP) for post- processing analysis. RTKLIB is an open source program package with a Command-line User Interface (CUI) similar to the LINUX operation system. We input RINEX observation and navigation data received from the GPS of the MOVE to execute RNX2RTKP.
The option settings for RNX2RTKP reproduced from
Takasu and Yasuda (2010) were utilized. A 30-s time
interval of ZTD estimation was set for RTKLIB
Fig. 2. Moving route of the mobile observation vehicle (MOVE) and locations of fixed global positioning system (GPS) sites on the
eastern coast of Korea. The different symbol colors indicate different institutes that operate the sites used in this study, as listed
in Table 1. The inset displays a map of the Korean Peninsula; shading indicates topographic elevation (m).
processing. The minimum elevation cutoff angle was set to 10° according to the operational GPS observation settings in the worldwide International Global Navigation Satellite System (GNSS) Service (IGS) network.
Finally, to retrieve the PWV from the ZTD solution described above, the value of the Zenith Hydrostatic Delay (ZHD) should be known so it can be subtracted from the ZTD. The ZHD model used in this study is that given by Saastamoinen (1972), which uses a ground AWS and GPS data observed by the MOVE:
ZHD = (1)
PWV = × 10
6(2)
Here, P
Mand Φ
Mrepresent the surface pressure and H
Mlatitude of the MOVE, respectively, and is the ellipsoidal height determined by adding the mean sea level to the orthometric height at the observing point of MOVE-GPS (Groves, 2007). The ZWD was derived by subtracting the ZHD from the ZTD value derived from RTKLIB processing (Bevis et al., 1992) that was finally transformed to PWV. In Eq. (2), ρ is the density of water, R
vis the specific gas constant of the water vapor, and k
2and k
3are constants for the atmospheric refractivity index used by Davis et al. (1985).
In this study, we used the surface temperature data of the MOVE for the mean temperature equation (T
M),
which is suitable for the weather conditions of the Korean Peninsula as suggested by Ha et al. (2008).
AWS data of the meteorological sensor are needed to determine PWV at a specific GPS station. However, this method is a proxy for usage and interpolation of AWS data because few sites have their own weather sensors connected directly to the GPS receiver (Kim et al., 2010). Therefore, this study is expected to be useful for direct meteorological information from the MOVE with high temporal and spatial resolution.
3) Validation
Validation of PWV on a mobile vehicle platform on land is inherently difficult. Moreover, mobile GPS- related studies do not provide sufficient methods for validating the spatial and temporal distribution of PWV. Moreover, both radiosonde and MWR have poor temporal resolutions and are weather- sensitive.
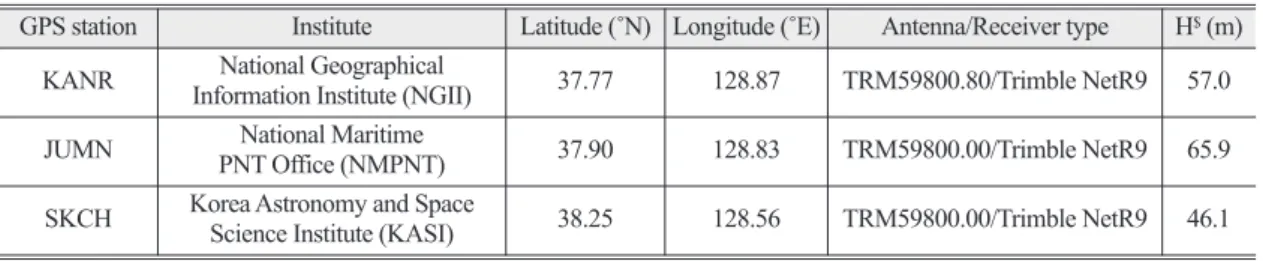
Therefore, three fixed GPS sites on the eastern coast of Korea were selected as the REFerence (REF) for the validation (Fig. 2). Each fixed GPS site is operated by three different institutes; further details of these stations are summarized in Table 1. Kim, Y. et al. (2014) demonstrated that GPS-sensed PWV estimates by using Bernese software overall agree with MWR or radiosonde measurements within a RMSE of 1.2 mm based on two months of data. That is, the performance of the GPS-PWV is quite reliable and useful for data validation.
On the contrary, post-processing software for PWV retrievals of permanent GPS stations used Bernese 5.0 ZWD
ρR
v(k
2+ ) k
3T
m(2.2779 ± 0.0024)P
M1 _ 0.00266 cos 2 Φ
M_ 0.00028 H
MTable 1. Information of fixed global positioning system (GPS) stations on the eastern coast of Korea
GPS station Institute Latitude (˚N) Longitude (˚E) Antenna/Receiver type H
$(m) KANR National Geographical
Information Institute (NGII) 37.77 128.87 TRM59800.80/Trimble NetR9 57.0 JUMN National Maritime
PNT Office (NMPNT) 37.90 128.83 TRM59800.00/Trimble NetR9 65.9 SKCH Korea Astronomy and Space
Science Institute (KASI) 38.25 128.56 TRM59800.00/Trimble NetR9 46.1
$
H means ellipsoidal height at each station.
with high precision developed by the Astronomical Institute of the University of Bern (Dach et al., 2007).
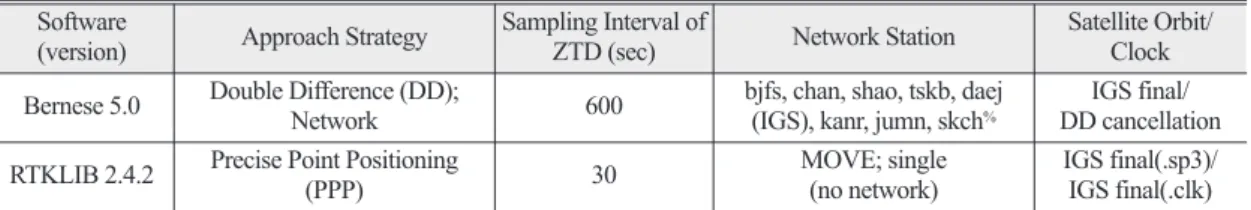
To minimize the impact of baseline length and to remove satellite and receiver clock errors, we used IGS final products in addition to the double-difference strategy of multi-network processing including IGS sites (Eckl et al., 2001; Kwon et al., 2007; Lee et al., 2013). A brief summary of the double differencing method compared with Kinematic-PPP processing of MOVE data is displayed in Table 2. For PWV retrieval from the fixed sites, surface pressure and temperature at nearby surface meteorological stations were used because no GPS sites on the eastern coast of Korea had in- situ meteorological sensors to compare with the AWS deployment of the MOVE (Kwon et al., 2007;
Kim et al., 2010).
Considering that validation time does not always coincide with the spatial resolution of MOVE data, we set a 10-min PWV interval for Bernese processing, which could accordingly raise the number of sampling and representativeness of validation data. In addition, these data require even matching for comparisons with the Bernese and RTKLIB solutions, which have different sampling intervals of 600-s and 30-s, respectively (Table 2).
Therefore, we used instantaneous PWV values estimated by RTKLIB software at approximately 20- min including the REF time to validate GPS-derived PWV of MOVE (ref. Fig. 2). The statistical results from the comparisons of PWV for the three fixed sites are presented in Section 3.
3. Results 1) Reference PWV
To confirm the quality of the REF data and to ascertain the PWV accuracy of the fixed GPS sites, we used Bernese 5.0 to process data from three fixed sites during the moving period of the MOVE. Data were collected for 33 days between March and July 2014 except for the missing data of June 11 at Jumunjin (JUMN) station. First, we compared 1-h PWV values with those of 10-min derived from different optional settings of Bernese processing. As a result, the Mean Bias (MB) of both results on a 1-h basis were small, ranging from -0.06 mm to 0.25 mm, and the RMSE and R
2values show good agreement between 1-h and 10-min processing (Table 3). The statistical results of JUMN station were worse with a slightly negative bias than those of other stations, with a RMSE of 1.37 mm, R
2of 0.98, and MB of -0.06.
These results might be associated with the site dependency in Bernese processing, although these differences are not significant. 10-min solutions with the GPS measurements of fixed sites were fairly Table 2. Summary of post-processing method by Bernese and real-time kinematic library (RTKLIB) software. Reproduced from Kwon
et al. (2007) Software
(version) Approach Strategy Sampling Interval of
ZTD (sec) Network Station Satellite Orbit/
Clock Bernese 5.0 Double Difference (DD);
Network 600 bjfs, chan, shao, tskb, daej
(IGS), kanr, jumn, skch
%IGS final/
DD cancellation RTKLIB 2.4.2 Precise Point Positioning
(PPP) 30 MOVE; single
(no network) IGS final(.sp3)/
IGS final(.clk)
%
IGS stations in East Asia (China, Japan, and Korea) for network processing.
Table 3. Statistical summary from a comparison between 1-h and 10-min processing of precipitable water vapor (PWV) by using Bernese 5.0 software. The bias indicates the results of 10-min minus those of 1-h
KANR JUMN SKCH
MB (mm) 0.25 -0.06 0.16
RMSE (mm) 1.28 1.37 1.23
R
20.99 0.98 0.99
N 792 768 789
comparable with 1-h solutions.
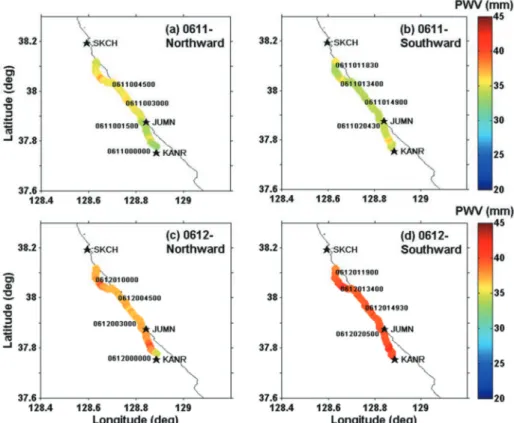
Figure 3 shows the differences between the PWV retrievals of three fixed sites with 10-min intervals during the moving cases. It is interesting to note that the PWV of each station had a high correlation and similar tendency with meridional gradient of water vapor during the entire period, as expected. The mean values of PWV at Sokcho (SKCH), JUMN, and Gangneung (KANR) were 22.1, 24, and 25 mm, respectively, from north to south. This result suggests that the meridional gradient of the sea surface temperature in association with the latitudinal distribution of water vapor may play an importance role in the north-south gradient of moisture (Larson and Hartmann, 2003; Bock et al., 2008). The tendency of the PWV time series exhibited a similar day-to-day variation at all stations, despite the gap of discontinuous data, particularly on April 28.
The accumulated precipitation amount along with the PWV time series at three GPS sites are shown in Fig. 3. Meteorological data with a 10-min interval at the Bukgangneung site were used for the REF value of precipitation due to a small difference in the precipitation amount at a nearby surface meteorological
station. During the analysis period, the number of days and total amount of precipitation were 12 days and 190.5 mm, respectively. A significant consistency in peak time between both variables was noted in most cases, particularly on July 9. On the contrary, almost no precipitation occurred when the PWV was less than 10 mm. These features demonstrate support that water vapor is a key component of the water cycle and its related processes such as precipitation (Bock et al., 2008).
2) Performance of the Proposed Method To verify and evaluate the performance of the proposed Kinematic-PPP strategy in a kinematic environment, we conducted a retrieval experiment in the post-processing mode by using RTKLIB software options as described in section 2.2. The 33-day MOVE trajectories on the eastern coast of Korea in three routes of A-B, B-C, and C-D shown in Fig. 2 were chosen for their general applications of kinematic GPS. PWV estimation was included in the comparison when the MOVE was truly kinematic and was validated against three fixed stations for a kinematic platform undergoing nearly 20 m of height change per trajectory.
Fig. 3. Time series of precipitable water vapor (PWV) retrievals (left axis; solid line) of fixed sites including Gangneung (KANR), Jumunjin (JUMN), and Sokcho (SKCH) determined by using Bernese 5.0 software along with the precipitation amount (right axis; vertical bar) at the Bukgangneung site at a 10-min interval.
Fig. 4. Comparison of precipitable water vapor (PWV) retrievals
from the global positioning system (GPS) receiver of a
fixed site with data of the mobile observation vehicle
(MOVE) by using the two different types of software.
Figure 4 shows the time series from the comparison of RTKLIB-derived PWV from our MOVE-GPS data and REF products at a 10-min interval on the moving
period. Despite the appearance of both positive and negative biases relative to the REF products, a seasonal trend appeared in the REF time series, shown in the figure by a vertical gray bar, and a signature was observed similar to that of the RTKLIB-PWV time series. The maximum bias of the PWV shown for 0000-0230 UTC on July 9 and 11, and the minimum value shown for June 9 and 13 are in fairly good agreements compared with the REF values. This result implies that the PWV solution can be successfully retrieved in the Kinematic-PPP mode for the moving cases of the MOVE, even though the bias for PWV derived from RTKLIB was greater than that typically reported for fixed land-based sites.
For detailed statistical analysis, we compared the values of RTKLIB-PWV with those of REF-PWV.
Because the time intervals of PWV differ among
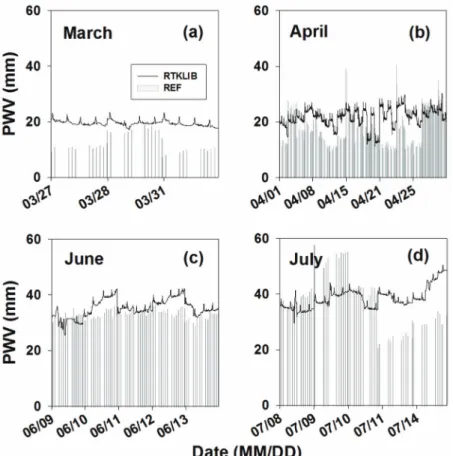
Fig. 6. Time series of precipitable water vapor (PWV) retrievals of fixed sites (REF; vertical gray bar) and real-time kinematic library (RTKLIB; solid black line) during moving cases in (a) March, (b) April, (c) June, and (d) July.
Fig. 5. Scatter plot of precipitable water vapor (PWV) for the
reference (REF; y-axis) relative to the real-time
kinematic library (RTKLIB; x-axis) during moving cases.
datasets, we used 10-min values for longer time intervals of each comparison. A scatter plot for the 33- day period is shown in Fig. 5. RTKLIB-derived PWV resulted in an RMSE of 7.4 mm and an R
2of 0.61 against REF-PWV. Statistical measures of the regression line by using correlation coefficient (R) and Degree of Freedom (DF) as functions of sampling number (N) for the scatter plot indicate a p-value of 0.01, which implies statistical significance at the 1%
level. The MB and slope of the regression line were 3.1 mm and 1.07, respectively, demonstrating a linear relationship with a positive bias of PWV retrievals.
The higher RMSE value is primarily due to the added error from the kinematic environment such as MP signals, SNR, and other factors. In addition, tendencies of bias showing over- or under-retrievals were not consistent when grouped to determine month-to-month variation, except for a couple of outlier points.
Therefore, we conducted additional error analysis of PWV on a monthly basis.
Figure 6 shows the time series of PWV retrievals of fixed sites and RTKLIB for each month. As indicated in Fig. 6a, the RTKLIB-derived PWV on March yielded a steady value of around 20 mm during the entire three-day period. On the contrary, the REF values were less than 10 mm against RTKLIB, except for a good agreement case on March 28. Figure 6b shows that the trend for the RTKLIB-PWV time series of April cases is consistent with the day-to-day cycle, particularly on April 28-30, despite some large differences. In June, the RTKLIB and REF products generally agreed well for the five-day comparison cases in terms of both trend and difference, although the number of cases was low (Fig. 6c). This feature is closely related to the high quality of data collected from GPS receiver. Furthermore, it is interesting to note that the accuracy of RTKLIB-PWV was continuously good during a 10-day period from April 28 to July 8. On the contrary, the accuracy of July cases was poor with the RTKLIB-PWV (Fig. 6d). In
particular, the product showed both positive and negative PWV biases on July 9 and 11 with almost the 20 mm.
The results obtained by comparison between the two PWV solutions in 10-min intervals are summarized in Table 4. As shown in Fig. 6, the RMSEs were high, ranging from 7.2 mm to 12 mm, except for June cases in which the best agreement had a RMSE of 3.8 mm.
All of the products indicated positive biases ranging from 1.1 mm to 6.9 mm, which shows the over- retrieval tendency of PWV in RTKLIB against the REF values in the daily average perspective. The highest and smallest biases appeared in March and July at 6.9 mm and 1.1 mm, respectively. However, one opposite feature was shown as the smallest bias of 1.1 mm in July with the highest RMSE value of 12 mm, which corresponds to cancellation of the large differences between both cases of July 9 and 11, as shown in Fig.
6d. These biases could be associated with the surrounding environment of the GPS receiver such as SNR, MP signals, and other factors. Detailed error analyses for PWV validation are further discussed in section 3.3.
3) Error Analysis
Because the convergence time is critical for receiving data from the GPS antenna mounted on a MOVE, error analysis must be considered for validation (Huber et al., 2010; Martin et al., 2012). The convergence time is generally several tens of minutes to a few hours depending on the antenna’s motion and environment; thus, strategies for speeding up the convergence will be covered in the near future.
Therefore, considering the first hour of convergence time in this study, we have examined an additional period as the residual in the calculation statistics shown in Table 4.
As expected, significant differences were noted in
the statistical results between the two periods. The
first period presented the worst results in terms of MB
and RMSE, ranging from 2.1 mm to 8.2 mm and 8.6 mm to 12.3 mm, respectively, except for the June cases (Table 4). A possible reason for these differences can be associated with the impact of convergence time. That is, convergence time is needed to stabilize variables such as determination of the ambiguity integer for post-processing because the estimated variables are not precise during the initial time period (Martin et al., 2012). However, it should be noted that features related to convergence time could not be confirmed in the June cases. This result may be partially attributed to accuracy in the different environments of GPS such as PDOP and SNR, although accounting for the explicit differences is difficult.
In addition, we used the Translation, Editing, and
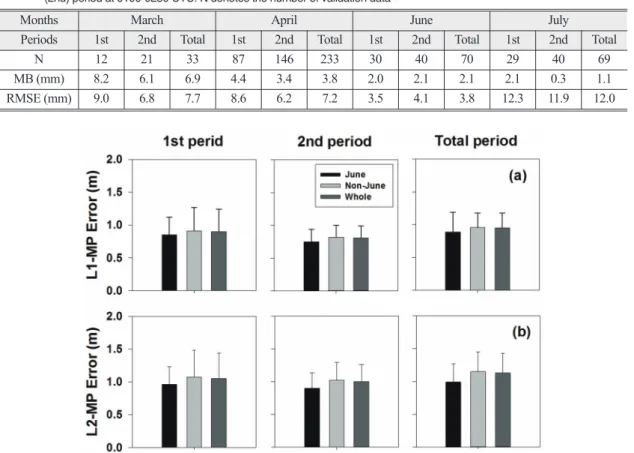
Quality Checking (TEQC) program developed by the University Navstar Consortium (UNAVCO) for detailed quality testing of the GPS datasets received from the MOVE. The results suggest four indices of quality checking including observing rate, L1 and L2 pseudo-range MPs, and frequency of cycle slip events (Estey and Meertens, 1999). The current analysis is limited to the moving period of the selected 33 days. The results are represented by the vertical bars with mean and standard deviations of each variable, as shown in the Fig. 7, which were stratified by different period using the same method as in Tables 5 and 6.
First, we analyzed the observing rate, the ratio of possible observation to complete observation of GPS signals, as the percentage of missing data. The rates Fig. 7. Quality check indices of (a) (upper panel) L1 and (b) (lower panel) L2-multipath (MP) error of global positioning system (GPS) data during the 33-day moving period determined by using the Translation, Editing, and Quality Checking (TEQC) program.
Table 4. Statistical results from a comparison between the real-time kinematic library (RTKLIB) and reference (REF) solutions in terms of monthly and time variation. We divided the time into two periods; the first (1st) period at 0000-0100 UTC and the second (2nd) period at 0100-0230 UTC. N denotes the number of validation data
Months March April June July
Periods 1st 2nd Total 1st 2nd Total 1st 2nd Total 1st 2nd Total
N 12 21 33 87 146 233 30 40 70 29 40 69
MB (mm) 8.2 6.1 6.9 4.4 3.4 3.8 2.0 2.1 2.1 2.1 0.3 1.1
RMSE (mm) 9.0 6.8 7.7 8.6 6.2 7.2 3.5 4.1 3.8 12.3 11.9 12.0
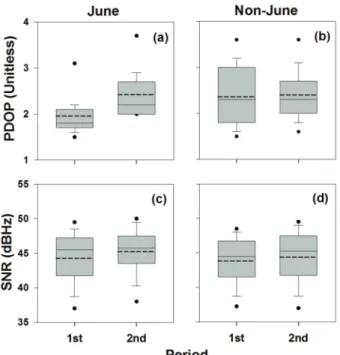
overall showed lower percentages, at largely 90%, in comparison with those of IGS fixed sites, at greater than 95%, for the entire periods (Table 5). The highest and lowest values, 87.9% and 85.0%, occurred in the second and first periods of non-June cases with 5.2% and 5.9% standard deviation, respectively. On the contrary, cycle slip frequencies per 1000 observations, created by the blocking of GPS signals, suggest that the June cases have larger mean values, particularly 14.0 in the first period, than those in other cases. However, these features might have affected the number of sampling data due to the high standard deviation (12.3) in June case of the first period (Table 5).
Finally, a quality check of the MP effects on L1 (MP1) and L2 (MP2) pseudo-range measurements is shown in Fig. 7. It is interesting to note that the mean values of both MP1 and MP2 errors in the June case were the lowest for entire time periods with values less than 1.0 m, ranging from 0.75 m to 0.89 m and 0.90 m to 0.99 m, respectively (Table 5). In addition, the results could suggest that the qualities of the first period were generally worse than those in the second period in the perspective of the same group by month, which led to improvement in GPS signals in the second period. The difference levels of mean MP1 for the first period were 11% to 13%
of those values of the second period, and the MP2
showed slight differences of 5% to 6%. The standard deviations of both MP errors also tended to be significantly higher in the first period than those in the second period (Table 5), although the mean value was not comparable to that of the IGS fixed sites, approximately 0.3 m.
These results are consistent with statistical results of PWV, which showed higher bias and RMSE values for the first period with a maximum RMSE difference of 39%; this could be related to the impact of convergence time. MP errors caused by the reflection of satellite signals from the ground, buildings, or other obstacles incur rapidly changing errors in GPS observations (Kim et al., 2014). In particular, we could not exclude the MP effect by wave reflection from the sea such as that on the eastern coast of Korea. In most quality parameters, the data quality results in worse values than those from IGS fixed sites. We confirm that the impacts of convergence time are more susceptible to MP effects relative to observing rates or cycle slip frequencies.
As previously mentioned, an additional study of the impacts of SNR or satellite geometry such as PDOP is needed with quantitative analysis of the characteristics of GPS signals caused by the MP effect. To investigate such indices, we used the solution extracted by RTKPLOT after archiving the GPS datasets of MOVE including navigation and observation. Especially, the impact of the satellite geometry is crucial in estimating Table 5. Summary of quality check indices including observing rate, L1-multipath error, L2-multipath error, and cycle slip from datasets of mobile observation vehicle-global positioning system (MOVE-GPS) using Translation, Editing, and Quality Checking (TEQC) program
Indices 1st period 2nd period Total period
June Non-June Whole June Non-June Whole June Non-June Whole
Observing rate
(%) 87.6
&±5.4 85.0 ± 5.9 85.4 ± 5.9 87.0 ± 1.0 87.9 ± 5.2 87.8 ± 4.8 86.4 ± 4.7 86.4 ± 4.0 86.4 ± 4.0
Cycle slip
(frequency) 14.0 ± 12.3 8.1 ± 2.1 9.0 ± 5.2 12.4 ± 3.2 11.0 ± 3.2 11.2 ± 3.2 12.4 ± 6.0 9.1 ± 1.8 9.6 ± 2.9 L1-mutipath
error (m) 0.85 ± 0.27 0.91 ± 0.36 0.90 ± 0.34 0.75 ± 0.19 0.82 ± 0.18 0.81 ± 0.18 0.89 ± 0.30 0.96 ± 0.22 0.95 ± 0.23 L2-mutipath
error (m) 0.96 ± 0.27 1.07 ± 0.41 1.05 ± 0.39 0.90 ± 0.23 1.02 ± 0.27 1.00 ± 0.26 0.99 ± 0.28 1.15 ± 0.30 1.13 ± 0.30
&