F
ORESTS
OCIETYComparison of Major Monoterpene Concentrations in the Ambient Air of South Korea Forests
Gil-Young Oh
1*, Gui-Hwan Park
1, Ik-San Kim
1, Ju-Soon Bae
1, Hye-Young Park
1, Yun-Gyu Seo
1, Soo-In Yang
1, Joong-Ki Lee
1, Sun-Ho Jeong
1and Wan-Jin Lee
21Jeollanam-Do Institute of Health and Environment, 291-1 Nongsung-dong, Seo-gu, Gwangju 502-810, South Korea
2Faculty of Applied Chemical Engineering, Chonnam National University, 300 Yongbong-dong, Buk-gu, Gwangju 500-757, South Korea
Abstract :
The concentration of monoterpenes (12 species) was measured from spring to fall in 2008 in ambient air at six different forests located in the southern parts of Korea. Sampling - using a Solid Adsorption Tube - was conducted at 2-hour-interval a day (24 hours) of each season. The highest annual average concentration of total monoterpene was 0.715 ppbv, which occurred at Mt. Baega.
a-Pinene, sabinene and
β-pinene were the most abundant compounds throughout the sampling periods and areas. The concentrations of monoterpene were higher in spring than in any other seasons. The compositions and concentrations of monoterpene displayed a distinct pattern by area. Most of monoterpenes had diurnal variations with higher concentrations during the daytime, and lower during the nighttime. This may be due to the fact that the amount of monoterpenes emitted increases at elevated ambient temperatures and increased sunlight intensity. The results of this study showed that each area had distinct monoterpene compositions, which depended on the tree species, topography and local climate at each area.
Key words :monoterpene, a-pinene, β-pinene, Forested ambient air
Introduction
BVOCs (Biogenic Volatile Organic Compounds), includ- ing isoprene and monoterpenes, play an important role in the photochemical reactions that occur in the presence of excess ozone and other oxidants. In addition, they can have a strong effect on atmospheric chemistry and can be a major source of organic aerosols. A significant amount of work has been carried out in order to obtain the emis- sion rates and concentration distribution for different sources and BVOCs classification at different regions (Dwivedi
et al., 2004; Chang
et al., 2005; Zou
et al., 2006; Evtyugina
et al., 2007; Bouvier-Brown
et al., 2009). Monoterpene compounds represent a major por- tion of BVOCs, and
a-,
β-pinene, and
d-limonene are representative monoterpene compounds that are found in forests (Isidorov
et al., 1985; Hsieh
et al., 1999; Kes- selmeier
et al., 2000; Hakolar
et al., 2000; Cooke
et al., 2001).
In other hand, there has been increased interest in
“Forest bath” known to be good to all kinds of stresses
from urbanization and industrialization. Forest bath is the health-improving activity for the body that people do in the forest. Forests have historically attracted people due to its green color, fragrances, and beautiful shapes of trees. It is an easy method for people of all ages to improve their health. The so-called phytoncide from plants purifies the ambient air of forests and moreover is good for human's health. Breathing in or exposing the skin to the forest ambient air, which is full of phytoncide volatilized from the forest, will help the body and mind to recover from what. Recently, alternative medicine, along with aromatherapy, has been used to imitate the effect of these phytoncide. It has been reported that phytoncide plays an important role in this effect. Especially, the con- centration of phytoncide and their matrix in the forest ambient air seems to be the key factors dictating the healing activities of a forest bath (Na
et al., 1998, 1999).
Since “Recreation Forests” are often used for healing activities, there is a need to measure monoterpene con- centration and their matrix in the air of these forests.
But only a few work has been carried out about the concentration distribution for different sources and BVOCs classification at different regions in southern Korea.
In this study, we measured the concentration and dis-
*Corresponding author E-mail: [email protected]
tribution of major monoterpenes in forest ambient air (six “Recreation Forest” areas) in the southern parts of Korea, during three seasons in 2008, in order to compare the monoterpene composition and concentration in each areas and tree species. We expect that the results will be useful for understanding the status of monoterpene dis- tribution in the level of human breathing at actual cir- cumstance.
Materials and Methods 1. Location and description of the study areas
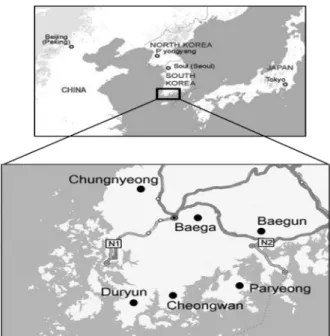
The research areas are located at Mt. Baegun, Mt.
Paryeong, Mt. Baega, Mt. Cheongwan, Mt. Duryun, and Mt. Chungnyeong, adjacent a trail through a forest sur- rounded by specific dominant trees. The location of where these measurements were obtained is illustrated in Figure 1. The selected forests, all public-run Recreation Forests, except Mt. Duryun, were situated far away from significant pollutants emission sources. There are no significant resi- dential, commercial, or industrial sources within 10~35 km. The main tree species growing around the Mt. Bae- gun, Mt. Duryun and Mt. Chungnyeong is Cupressaceae, and the dominant tree species at the Mt. Paryeong, Mt.
Baega and Mt. Cheongwan areas are Fagaceae and Pinaceae (Table 1). During 2~3 days before the sampling day there were rain events at Mt. Paryeong (fall), Mt.
Cheongwan (spring), Mt. Duryun (summer and fall), and Mt. Chungnyeong (spring and summer). On the sampling day there was a rain event only at Mt. Duryun in spring.
2. Collecting sample and analysis
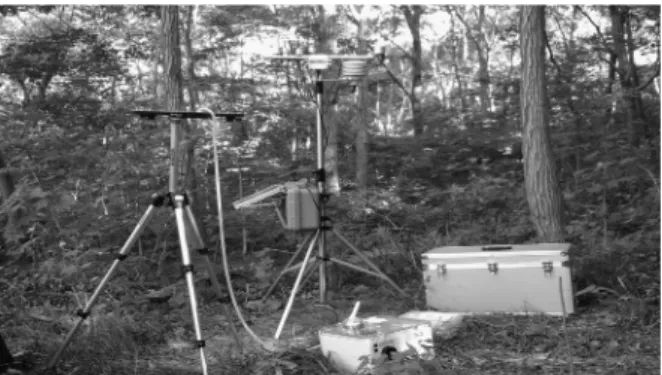
The air samples were collected on adsorbent tubes
filled with Carbopack-B and Carbosieve SIII (air toxics PerkinElmer, USA) about 1.5 m above the ground (Figure 2). Flow through the sample tube was main- tained in the range of 0.08~0.10 L/min by a constant flow type pump (minipump SIBATA, Japan) flow- checked by KTL (Korea Testing Laboratory) before.
Samples were collected at 2-hour-interval a day of each season (April, August, and October in 2008). Once col- lected, samples were stored in a gas-tight container under a cool condition (< 4
oC). Prior to field sampling, the sample tubes were pre-purged with nitrogen and their blank status was checked according to the sample Figure 1. Map of southern Korea with location of sampling areas.
Table 1. Details of sampling sites .
Site Main family Age of trees
(year) Height of
canopy (m) Interspersed with Baegun
(Mt.) Cupressaceae 20 - 30 < 20
Chamaecyparis obtusaCryptomeria japonica Pinus densiflora Pinus koraiensis
Paryeong
(Mt.) Fagaceae 15 - 20 < 15
Quercus acutissimaQuercus variabilis Quercus aliena
Baega
(Mt.) Pinaceae 25 - 30 < 20
Pinus taedaPinus rigida
Cheongwan
(Mt.) Pinaceae 20 - 30 < 20
Pinus taedaPinus rigida
Duryun
(Mt.) Cupressaceae 30 - 35 < 25
Chamaecyparis obtusaCryptomeria japonica
Chungnyeong
(Mt.) Cupressaceae Over 50 < 40
Chamaecyparis obtusaCryptomeria japonica Abies koreana
analysis routine. The potassium iodide (KI, Supelco USA) packed cartridge was attached to the entrance of the tube to prevent interference from oxidants such as ozone.
At the same time, the meteorological conditions were measured (NOMAD CASELLA, UK) at the research areas and the same height during the sampling period (Table 2).
The samples were analyzed using a thermo-desorption instrument (ATD-650 PerkinElmer, USA) connected to a GC/MS (Clarus-500 PerkinElmer, USA) equipped with a capillary column (Perkinelmer Elite-1; 60 m long, 0.32 mm I.D., 3.0 m film thickness). Samples were concen- trated on the cold trap (-30
oC) filled with Tenax-TA in the thermo-desorption instrument, and analyzed using the selected ion mode (SIM).
Calibration standards were prepared by making a
multi-solution (methanol solvent;
a-pinene, camphene,
β- pinene, myrcene, 2-carene,
a-phellandrene, 3-carene,
a- terpinene,
p-cymene,
d-limonene,
γ-terpinene, 11 spe- cies) along with sabinene. Multi-solutions containing sabinene did not show good results due to unknown rea- sons. One micro liter of the standard solution (5~20 ng) was spiked into the clean tube with nitrogen make-up gas by pumping to allow the standard solution to be adsorbed on the tube's pore surface without any loss.
The method detection limit (MDL) for GC/MS anal- ysis was less than 0.38 ng (n=7) for all monoterpenes studied. Overall relative standard deviation (RSD) and coefficient of determination (r
2) for this measurement were estimated as < 10% (n=3), and > 0.90 (st=3). Cal- ibration routines were performed at every time when GC/MS analysis was conducted.
Results and Discussion 1. Distribution of major monoterpenes
Mt. Baega had the highest annual average concentra- tion (0.715 ± 0.57 ppbv) followed by Mt. Baegun (0.678 ± 0.52 ppbv), Mt. Duryun (0.516 ± 0.69 ppbv), Mt. Cheon- gwan (0.432 ± 0.59 ppbv), Mt. Chungnyeong (0.257 ± 0.33 ppbv), and Mt. Paryeong (0.169±0.16 ppbv). Overall, annual average concentrations in coniferous forests were higher than those in broadleaf forests. However, the annual average concentration of Mt. Baega, which was predom- Table 2. Seasonal variation of meteorological conditions .
Site Season Wind
Speed (m/s) Air temp.
(
oC) Relative
Humidity (%) Radiation
(W/m
2) Other condition
BS OS
Baegun (Mt.)
spr. 0.3 14.4 70.2 39.1 C C
sum. 0.1 24.1 89.1 30.9 C C
fall 0.4 16.8 63.1 21.2 C C
Paryeong (Mt.)
spr. 0.8 16.1 33.0 56.1 C C
sum. 0.3 20.4 80.5 13.8 C C
fall 0.3 18.0 69.9 35.6 R (< 5 mm) C
Baega (Mt.)
spr. 0.4 17.4 49.2 27.2 C C
sum. 0.3 20.8 75.7 30.9 C C
fall 0.3 18.4 47.2 19.9 C C
Cheongwan (Mt.)
spr. 0.6 10.3 53.3 44.5 R (< 5 mm) C
sum. 0.1 26.2 84.9 20.6 C C
fall 0.6 14.4 61.8 7.6 C C
Duryun (Mt.)
spr. 0.5 15.8 46.3 9.6 C R (< 3 mm)
sum. 0.0 24.3 90.5 8.0 R (< 20 mm) C
fall 0.4 16.9 77.9 4.4 R (< 2 mm) C
Chungnyeong (Mt.)
spr. 0.4 18.0 76.7 23.3 R (< 3 mm) C
sum. 0.1 20.1 81.8 26.6 R (< 3 mm) C
fall 0.2 16.9 84.6 4.6 C C
Figure 2. Sampling apparatus photograph.
inantly populated by the Pinaceae, was higher than those of Mt. Baegun and Mt. Chungnyeong, which were pre- dominantly populated by the Cupressaceae. This finding was somewhat surprising and unexpected because the essential oil content of trees are related to amounts of emitted monoterpenes, and the Cupressaceae have more essential oils than the Fagaceae (Gang, 2003).
In particular, Mt. Chungnyeong, a representative affor- estation area in southern korea, had a lower average con- centration than those of the other areas. This result may be explained by the following reasons: First, the monot- erpene concentration in the sampling air seemed to be more diluted due to the refinement of the afforestation and a lower density of trees. Second, this lower value may have originated from the distance between the monoterpene emitting parts of the tree and where sam- pling was collected. It is well known that the main emis- sion parts of tree are around of its canopy (Harrison
etal.
, 2001). The trees at Mt. Chungnyeong were over 50 years old, so the average tree height was about 30~40 m and the canopy was located in higher regions of the trees relative to the trees at the other area. The sampling height at all areas was around 1.5 m from the ground.
Thus, though a more detailed evaluation of the essential
oil from trees should be part of future studies. It has been suggested that essential oil contents, emission rate, density of tree, and configuration of the ground should be considered in assessing the regional concentrations of monoterpene in forest air.
The composition of monoterpenes at all areas was very similar:
a-pinene, sabinene and
β-pinene were found as high concentration at all areas. Especially,
a-pinene was found to be the most abundant component of the monoterpenes at Mt.
Figure 3. Seasonal variation of monoterpene concentrations (2-hour interval from spring to fall at each sites, etc:
camphene + 2-carene +
a-phellandrene + 3-carene +
γ- terpinene +
p-cymene +
a-terpinene).
Table 3. Seasonal average concentrations of monoterpenes on sites. (unit : pptv) Site season
a- Pinene Sabinene
β- Pinene Myrcene
d- Limonene Others Sum Baegun
(Mt.)
Spr. 332 179 115 75 90 215 1,006
Sum. 102 183 37 29 44 63 458
Fall 210 60 183 38 47 31 569
Mean 215 141 112 47 60 103 678
Paryeong (Mt.)
Spr. 49 92 51 10 21 111 334
Sum. 8 25 bdl 18 9 34 94
Fall 5 23 bdl 40 bdl 10 78
Mean 21 47 17 23 10 52 169
Baega (Mt.)
Spr. 319 80 153 19 62 91 724
Sum. 168 84 57 37 86 75 507
Fall 395 173 146 40 94 67 915
Mean 294 112 119 32 81 78 715
Cheongwan (Mt.)
Spr. 330 76 66 25 31 84 612
Sum. 81 28 26 19 25 33 212
Fall 278 37 61 52 36 9 473
Mean 230 47 51 32 31 42 432
Duryun (Mt.)
Spr. 335 362 54 93 189 302 1,335
Sum. 6 83 14 14 5 29 151
Fall bdl 37 bdl 8 5 12 62
Mean 114 161 23 38 66 114 516
Chungnyeong (Mt.)
Spr. 156 105 16 68 81 133 559
Sum. 16 99 bdl 8 7 29 159
Fall 26 20 bdl 8 bdl bdl 54
Mean 66 75 5 28 29 54 257
*bdl: below detection limit.
Cheongwan in the fall (2.122 ppbv, 2-hour average). In the spring and fall at Mt. Baegun and in the spring at Mt. Baega, the concentration of
a-pinene was relatively high (>1.000 ppbv). Myrcene and
d-limonene were found in high levels at Mt. Chungnyeong and Mt. Paryeong (Figure 3).
For most of the monoterpenes, maximum concentra- tions were observed during the daytime and minimum concentrations were observed during the night. This is contrary to the diurnal pattern reported by Riba
et al.(1987) and Hakola
et al.(2000). They believed that the lower daytime concentrations were due to an efficient sink reaction with O
3, OH and NO
3radicals and dilution by vertical transport. It is difficult to provide exact rea- sonable explanations for our results. However, Schuh
etal.
(1997) and Staudt
et al.(1997) observed maximum sabinene concentrations during the day, which was most likely due to efficient emission during that time. Because the areas in this study were adjacent to trees and located in the middle of the forest, we concluded that the con- centrations measured were directly influenced by the emissions from trees, and not by vertical transport or dilution from wind. The average wind speed was deter- mined to be as low as 0.8 m/s.
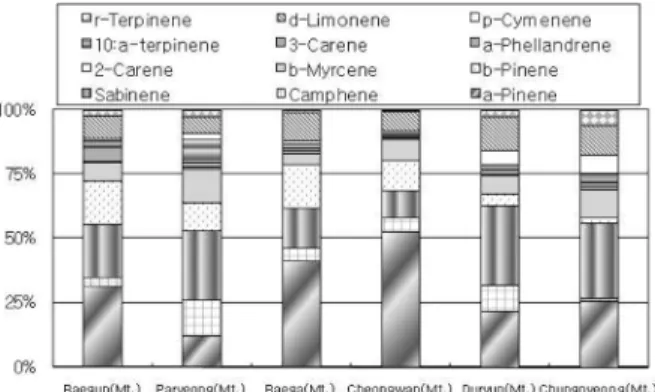
Figure 4 shows the distribution ratio of the monoter- penes studied (spring + summer + fall) at each area. At Mt. Baegun, the most abundant component was
a-pinene (32%), followed by sabinene (20%) >
β-pinene (17%) >
d
-limonene (7%). Sabinene was the dominant kind (27%), followed by camphene (14%) > myrcene (13%) >
a-pinene (12%) at Mt. Paryeong. The distribution ratios at Mt.
Baega, Mt. Cheongwan, Mt. Duryun, and Mt. Chung- nyeong were as follows:
a-pinene (41%) >
β-pinene (17%)
> sabinene (16%) >
d-limonene (11%),
a-pinene (53%) >
β
-pinene (12%) > sabinene (11%) > myrcene (8%), Sab- inene (31%) >
a-pinene (22%) >
d-limonene (13%) >
β- pinene (10%), and sabinene (29%) >
a-pinene (26%) >
d
-limonene (12%) > myrcene (11%), respectively.
Overall,
a-pinene and sabinene were the most abun- dant components. The ration of
a-pinene was 41% at
Mt. Baega and 53% at Mt. Cheongwan. This is assumed to be one of the emission characteristics of the Pinaceae.
a
-pinene has been well known as the most popular com- ponent in the forest air and the high concentrations of sabinene are in agreement with a study conducted by Hakola (2003) in boreal coniferous forest.
Myrcene was found at a relatively higher percentage (11%) at Mt. Chungnyeong. Na
et al.(1998) reported that essential oils are capable of producing sedative effect in response to stress by reducing the concentration of cor- tisol (hormone indicator of stress) in the blood. Na
et al.(1999) presumed that these effects were due to myrcene.
2. Seasonal and diurnal variations of major monoter- penes
The seasonal variations of monoterpene concentration are shown in Figure 5. The sum of the monoterpene con- centration at five areas in spring, except Mt. Baega, was higher than those obtained in summer and fall. Janson (1993) reported that the compositions and fractional hydrocarbons from Scots pine varied seasonally and dif- ferent relative quantities of terpene were observed in the emission from buds' emission than from needles. In addition, Kim (2001) reported that slash pine buds appeared to be actively growing in the spring. Flyckt (1979) also inves- tigated the seasonal variations in the monoterpene emis- sion from Ponderosa pines. In this study, he reported that hydrocarbons were emitted throughout the year with a significantly greater emission rate in spring. The average terpene emission rate in May was 18 times greater than that in the July-September period (Flyckt, 1979).
The seasonal mean concentrations at Mt. Baega reached their maximum values in fall. There is noteworthy dif- ference; Relatively lower humidity (47%) was measured at this area, and humidity had the negative correlation with concentration of monoterpene species in this study.
Kim (2001) found that slash pine emissions decreased in rain simulation study.
At Mt. Duryun, there were quite large fluctuations in the seasonal average concentrations 1.335 ppbv in spring,
Figure 4. Relative distribution of monoterpenes studied
(spring + summer + fall) at sampling areas. Figure 5. Seasonal variation of total monoterpene concen-
trations at sampling areas.
0.151 ppbv in summer, and 0.062 ppbv in fall. However, it had rained 2~3 days before field sampling and even drizzled on the sampling day in spring.
The highest seasonal average concentrations of
a-pinene/
sabinene were determined to be 0.335 ppbv/0.362 ppbv at Mt. Duryun in spring, 0.102 ppbv/0.183 ppbv at Mt.
Baegun in summer, and 0.395 ppbv/0.173 ppbv at Mt.
Baega in fall. The highest seasonal average concentra- tions of
β-pinene were 0.153 ppbv and 0.057 ppbv at Mt. Baega in spring and summer, respectively and 0.183 ppbv at Mt. Baegun in fall.
It is hard to directly compare our results with others because many of the factors in this study such as sam- pling area, tree species, period, method, and local weather condition were different relative to previously published studies. However, by comparing with previously reported average values, it is possible to identify a trend. Although the annual averages at Mt. Baega, Mt. Baegun, and Mt.
Cheongwan were lower than those of Amazonia, it was still higher than those of Finland (2000-2002
a-pinene 0.048-0.109 ppbv, Hakola
et al., 2003), Portugal (1996 day
a-pinene 0.180 ppbv, Cerqueira
et al., 2003), Florida USA (1994-1995
a-pinene 0.177 ppbv, Kim and Kim, 2002), and Pochun Korea (2006
a-pinene 0.094 ppbv, Kim
et al., 2005). On the average, the composition of
a-
pinene and
β-pinene were 0.215-0.294 ppbv at Mt. Baega, Mt. Baegun, and Mt. Cheongwan.
3. Distribution of major monoterpenes by tree species Many researchers have reported that the quantitative changes in monoterpene concentration could occur due to factors such as the monoterpene content in tree spe- cies, tree age, humidity, and temperature (Dement
et al., 1975; Riba
et al., 1987; Yatagai
et al., 1995; Kim, 2001;
Cerqueira, 2003). And it has been assumed that there are
relationships between the monoterpene concentrations in
the forest ambient air and emission rates according to
tree species. The seasonal variation of average monot-
erpene concentrations by dominant tree species (Cupres-
saceae, Pinaceae, Fagaceae), maximum concentration was
measured during spring, followed by fall and summer
for areas containing the Cupressaceae. In regions con-
taining the Fagaceae, the highest average concentration
was observed during the fall, followed by spring and
summer. For areas predominantly containing the Pinaceae,
the highest value was observed during spring, followed
by summer and fall. In general, it is well known that the
emission rate from trees and the monoterpene concen-
trations in the forest ambient air are influenced by tem-
perature and sunlight, which are maximal during the
Figure 6. Relative contribution of monoterpenes in the ambient air of forests dominated by: (a) Cupressaceae (b)
Fagaceae (c) Pinaceae.
summer season (Yatagai
et al., 1995). However, in this study, unique seasonal variations in the monoterpene concentrations due to different dominant tree species were observed. More extensive research will be needed to obtain a better understanding of these observations.
As shown in Figure 6, there were big differences in the relative compositions of the major components accord- ing to the dominant tree species.
a-pinene (28%) was the most abundant monoterpene followed by sabinene (25%),
β- pinene (11%), and
d-limonene (10.8%) at the Cupres- saceae dominant area. At the Pinaceae dominant area,
a- pinene was the most abundant component (45%) fol- lowed by
β-pinene (15%), sabinene (14%), and
d-limonene (10%).
A fairly different pattern was observed at the Fagaceae dominant area: sabinene (27%) > myrcene (13%) >
a-pinene (12%) >
β-pinene (11%). These results are in agreement with a study conducted by Hakola (2003). In this study, he reported that a substantial amount of sabinene was emitted from deciduous trees, such as Fagaceae, and the level of emission increased 3~5 weeks after leaf emer- gence and declined in September. This could be the rea- son that the maximum average concentration at the Fagaceae dominant area occurred during the spring, as discussed earlier. The amount of camphene and myrcene, which were minor components in the coniferous forest, were quite high in the broadleaf forest, 14% and 13%, respectively.
Conclusion
This paper attempted to compare the distribution of monoterpenes above the human-height in south korea forest air. The concentrations of monoterpene species were measured for one day in spring, summer and fall of 2008 in the ambient air at six forests in southern parts of Korea.
Overall, annual average concentrations in coniferous for- ests were higher than those of broadleaf forests.
a-Pinene, sabinene and
β-pinene were the most abundant com- pounds throughout the sampling period. The major com- ponents, such as
a-pinene, sabinene and
β-pinene, showed very similar pattern at all areas. Especially,
a-pinene was found to be the most abundant monoterpene. The sum of the monoterpene concentration at the five areas in spring, except Mt. Baega, was higher than those obtained in the summer and fall. For most of the monoterpenes, maxi- mum concentrations were found to occur during the day- time and minimum concentrations occurred at night.
The results showed that the unique seasonal variation of monoterpene concentrations by the dominant tree spe- cies. Maximum concentration was measured during the spring followed by fall and summer at areas containing the Cupressaceae. In regions dominated by the Fagaceae,
the highest average concentrations were observed during the fall, followed by spring and summer. And finally in regions primarily containing the Pinaceae, the highest values were observed during spring.
The information gathered from this study may improve our understanding on the BVOCs chemistry of forest surface air in southern parts of Korea.
Literature Cited
1. Bouvier-Brown, N.C., Holzinger, R., Palitzsch, K. and Goldstein, A.H. 2009. Large emission of sesquiterpen- ens and methyl chavicol quantified from branch enclo- sure measurements. Atmospheric Environment 43: 389- 2. Cerqueira, M.A., Pio, C.A., Gomes, P.A., Matos, J.S. and 401.
Nunes, T.V. 2003. Volatile organic compounds in rural atmospheres of central Portugal. The Science of the Total Environments 313: 49-60.
3. Chang, K.H., Chen, T.F. and Huang, H.C. 2005. Esti- mation of biogenic volatile organic compounds emis- sion in subtropical island-Taiwan. Science of The Total Environment 346: 184-199.
4. Cooke, K.M., Hassoun, S., Saunders, S.M. and Pilling, M.J. 2001. Identification and quantification of volatile organic compounds found in a eucalyptus forest during FIELDVOC'94 in Portugal. Chemosphere-Global Change Science 3: 249-257.
5. Dement, W., Tyson, B. and Mooney, H. 1975. Mech- anism of monoterpene volatilization in
Salvia mellifera. Phytochemistry 14: 2555.
6. Dwivedi, P., Gaur, V., Sharma, A. and Verma, N. 2004.
Comparative study of removal of volatile organic com- pounds by cryogenic condensation and adsorption by activated carbon fiber. Separation and Purification Technology 39: 23-37.
7. Evtyugina, M.G., Pio, C., Nunes, T., Pinho, P.G. and Costa, C.S. 2007. Photochemical ozone formation at Portugal West Coast under sea breeze conditions as assessed by master chemical mechanism model. Atmo- spheric Environment 41: 2171-2182.
8. Flyckt, D.L., 1979. Seasonal variation in the volatile hydrocarbon emissions from Ponderosa Pine and Red Oak. Master's Thesis, Washington State University, Pull- man, pp. 21-22.
9. Gang, H.Y., 2003. Phytoncide. Yeoksanet, Seoul.
10. Hakola, H., Laurila, J.R. and Puhto, K. 2000. The ambi- ent concentrations of biogenic hydrocarbons at a north- ern European, boreal site. Atmospheric Environment 34: 4971-4982.
11. Hakola, H., Tarvainen, V., Laurila, T., Hiltunen, V., Hellen,
H. and Keronen, P. 2003. Seasonal variation of VOC
concentrations above a boreal coniferous forest. Atmo-
12. Harrison, D., Hunter, M.C., Lewis, A.C., Seakins, P.W., Bonsag, B., Gros, V., Kanakidou, M., Touaty, M., Kavou- ras, I., Mihalopoulos, N., Stephanou, E., Alves, C., Nunes, T. and Pio, C. 2001. Ambient isoprene and monot- erpene concentrations in a Greek fir (
Abies borisii- regis) forest. Reconciliation with emissions measure- ments and effects on measured OH concentrations.
Atmospheric Environment 35: 4699-4711.
13. Hsieh, C.C., Chang, K.H. and Wang, L.T. 1999. Ambi- ent concentrations of biogenic volatile organic com- pounds in southern Taiwan. Chemosphere 39: 731-744.
14. Isidorov, V.A., Zenkevich, I.G. and Ioffe, B.V. 1985.
Volatile organic compounds in the atmosphere of for- ests. Atmospheric Environment 19: 1-8.
15. Janson, R. 1993. Monoterpene emissions from Scots pine and Norwegian Spruce. Journal of Geophysical Research 98: 2839-2850.
16. Kesselmeier, J., Kuhn, U., Wolf, A., Andreae, M.O., Ciccioli, P., Brancaleoni, E., Frattoni, M., Guenther, A., Greenberg, J., De Castro Vasconcellos, P., de Oliva, T., Tavares, T. and Artaxo, P. 2000. Atmosphere volatile organic compounds (VOC) at a remote tropical forest site in central Amazonia. Atmospheric Environment 34: 4063-4072.
17. Kim, J.C. 2001. Factors controlling natural VOC emis- sions in a southeastern US pine forest. Atmospheric Environment 35: 3279-3292.
18. Kim, J.C. and Kim, K.H. 2002. Seasonal variations of Monoterpene Concentrations in a Pine Forest in Flor- ida, USA. Journal of Korean Society for Atmospheric Environment 18: 175-180.
19. Kim, K.J., Kim, J.C. and Lim, J.H. 2005. Comparison of Anthropogenic and Natural VOC Condensations in the Forest Ambient Air. Journal of the Korean Society
for Environment Analysis 8: 132-136.
20. Na, K.J., Kang, H.Y., Oh, J.H., Choi, I.G., Yun, Y.W.
and Jeung, E.B. 1998. The Sedative Effect of Stress by Essential Oils Purifed from Softwoods. Korean journal of the Laboratory Animal Science 14: 93-96.
21. Na, K.J., Kang, H.Y., Yoon, S.K. and Jeung, E.B. 1999.
Biological Efficacy of Essential Oils form softwood.
Korean journal of the Laboratory Animal Science 15:
79-81.
22. Riba, M.L., Tathy, J.P., Tsiropoulos, N., Monsarrat, B.
and Torres, L. 1987. Diurnal variation in the concen- tration of
a- and
β-pinene in the landes forest (France).
Atmospheric Environment 21: 191-193.
23. Schuh, G., Heiden, A.C., Hoffmann, Th., Kahl, J., Rockel, R., Rudolph, J. and Wildt, J. 1997. Emissions of Volatile Organic Compounds from Sunflower and Beech: Dependence on Temperature and Light Inten- sity. Journal of Atmospheric Chemistry 27: 291-318.
24. Staudt, M., Bertin, N., Hansen, U., Seufert, G., Ciccioli, P., Foster, P., Frenzel, B. and Fugit, J.L. 1997. Seasonal and diurnal patterns of monoperpene emission from
Pinus pinea
(L.) under field conditions. Atmospheric Environment 31: 145-156.
25. Yatagai, M.,Ohira, M., Ohira, T. and Nagai, S. 1995.
Seasonal variations of terpene emission from trees and influence of temperature, light and contact stimulation on terpene emission. Chemoshpere 30: 1137-1149.
26. Zou, L., Lou, Y., Hooper, M. and Hu, E. 2006. Removal of VOCs by photocatalysis process using adsorption enhanced TiO
2-SiO
2catalyst. Chemical Engineering and Processing 45: 959-964.
(Received June 24, 2010; Accepted July 14, 2010)