A research on the Design and Construction of Smart Environmental Protection Information Platform in Nanjing
Shi XiaoHe
1, Younghwan Pan
2*1
Ph.D. Course, Department of Smart Experience Design, TED, Kookmin University
2
Professor, Department of Smart Experience Design, TED, Kookmin University
난징시의 지능형 환경 보호 정보 플랫폼의 디자인 및 구축에 관한연구
시효하
1,반영환
2*1
국민대학교 테크노디자인전문대학원 스마트경험디자인학과 박사과정
2
국민대학교 테크노디자인전문대학원 스마트경험디자인학과 교수
Abstract Environment is an important factor in city life. Environmental elements are a subject that must be discussed in the smart city plan, but there is still a lack of information and data sharing in the urban environment, so improvements are needed. As part of the intelligent of Nanjing, this research has made in-depth investigation into the construction and service demand of environmental information, and has carried out the research on the design and construction of intelligent information platform that conforms to Nanjing intelligent city planning, improves environmental quality and provides environmental information service. The visualization of information is also studied. The result is an important module in the construction of intelligent city in Nanjing.
Key Words : Smart environmental protection, Big data, Information platform, Application system,
Environment simulation
요 약 도시생활에서 환경은 매우 중요한 요소이다. 환경요소는 스마트 도시 계획에서 꼭 다루어야 하는 주제이나, 도시 환경의 정보화 및 데이터 공유 부분은 현재 미흡한 상태여서 이를 개선할 필요가 있다. 본 연구는 난징시의 스마 트화의 일환으로 친환경 정보화 건설 및 서비스 수요에 대한 심층조사를 진행하였고, 난징시의 스마트 도시 계획에 부합하면서, 환경의 품질을 개선하고 환경정보 서비스를 제공하는 지능형 친환경 정보 플랫폼의 디자인 연구와 그 구축 에 대한 연구를 수행하였다. 또한 정보를 시각화 하는 부분에 대한 연구도 진행을 하였다. 이 결과는 난징 시 스마트 도시 구축에 중요한 모듈이다.
주제어 : 스마트 환경 보호, 빅 데이터, 정보플랫폼, 애플리케이션 시스템, 환경 시뮬레이션
*Corresponding Author : Younghwan Pan([email protected])
Received December 7, 2020 Revised January 4, 2021 Accepted January 20, 2021 Published January 28, 2021
1. Introduction
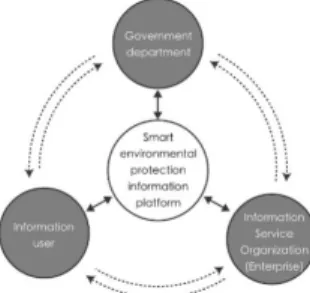
"Smart environmental protection" is to use a new generation of information technology to change the way of interaction between the government, enterprises and people(Fig. 1), in order to improve the clarity, efficiency, flexibility and response speed of the interaction, and
"Smart Environmental Protection" based on the original "digital environmental protection", with the help of the Internet of Things technology, embedded sensors and equipment into various environmental monitoring objects, and integrate the Internet of Things in the environmental protection field through supercomputers and cloud computing to realize humanity Integration of social and environmental business systems[1]. It is an extension and expansion of the concept of
"digital environmental protection" and an inevitable trend of information technology progress [2]. At present, most environmental protection departments face problems such as lack of management personnel and backward information methods, so they must use information platforms and intelligent systems to optimize the urban environment [3]. Therefore, the construction of a smart environmental protection information platform highlights its importance.
Fig. 1. Main factor relationship diagram
With the advancement of Nanjing's smart city construction process, the amount of data from various environmental protection departments has continued to rise, but the current
environmental administrative law enforcement, environmental monitoring and analysis, environmental protection infrastructure construction, ecological protection and other environmental protection administrative departments’ data are still in their original state.
Preservation is not conducive to the sharing of information [4].
(1) The independent construction of various business systems and equipment of the Nanjing environmental protection department belongs to the same unit, which makes it difficult for the platform to integrate data and realize information sharing. Therefore, it is difficult to use environmental protection information to complete the supervision and environmental management work, such problems can be solved by rebuilding a platform covering various business systems.
(2) In terms of waste pollution source monitoring, there are 20 key sources of waste gas national control in Nanjing. In fact, there are only 13 and 37 outlets reported. Although most of the pollution source and sewage companies have installed online monitoring equipment, the monitoring process is very important. The lack of one link can easily lead to falsification of on-site end-of-site monitoring data.
(3) There are currently three landfills in Nanjing, namely in LiShui District, JiangNing District, and Pukou District. These areas are currently in the development stage. The odor generated in such places needs to be automatically monitored on-line to ensure the surrounding areas during the development process. The air quality is normal.
(4) River section monitoring. The water quality
of 7 provincial-controlled sections including
JinChuan River and Wai QinHuai River and 14
state-controlled tributaries into the river
continued to improve. At present, the water
quality monitoring system has not been put into
operation.
(5) Surface water monitoring. The main lakes in Nanjing are ShiJiu Lake, GuCheng Lake, BaiJia Lake, XuanWu Lake, QianHu Lake, MoChou Lake, YueYa Lake and ZiXia Lake. The lakes in the main urban area have serious eutrophic, JinNiu Lake and DongPing Lake are all classified as reservoirs by the water conservancy department, and automatic monitoring has not yet been realized.
In response to the current actual needs of Nanjing's ecological, humanistic and economic development, this article puts forward the concept of a smart environmental protection information platform design, which provides real-time data and intelligent auxiliary decision-making for environmental protection departments and urban users.
2. Design process 2.1 Design goal
The intelligent environmental protection information platform will aim at data integration, collaborative interaction, efficient service, and intelligent analysis, and establish a comprehensive and technologically advanced smart environmental protection information platform [5],provide more intelligent information services for governments, enterprises and urban users.
2.2 Design method
In the design process, factor analysis method, literature research method and expert consultation method were used respectively.
(1) Factor analysis method
Through the analysis of the four major elements of "Internet +" smart environmental protection construction, resource input capacity, integrated application level, collaborative innovation capacity and economic and social benefits, the overall framework of the system construction plan is determined. The ability to
invest in resources mainly measures the level of information application, which is the security guarantee for platform construction; the level of integrated application mainly measures the level of interaction between environmental protection departments and users and the level of user experience; the ability to coordinate innovation is to test the ability of environmental protection departments to integrate internal and external resources; the last item It is to judge the production efficiency of platform construction.
(2) Literature research method
In view of the four major elements, conduct policy literature research on smart city evaluation index system, environmental information construction guidelines, ecological environment status evaluation and other aspects, and it has guiding significance for the construction and development of intelligent environmental protection information platform.
clarify the sources of relevant indicators related to smart environmental protection, and enhance the feasibility of platform system construction.
(3) Expert consultation method
The construction of the "Internet +" smart environmental protection platform involves the standard level of comprehensive evaluation indicators (such as environmental supervision and law enforcement capacity building standard level, environmental emergency response capacity building standard level, macro decision-making capacity building standard level, environmental public opinion monitoring and policy guidance Standard level, etc.) [6].As some smart environmental protection evaluation indicators cannot be quantified yet, it is necessary to consult with experts in related fields and integrate their experience to adjust and modify the platform architecture in real time.
2.3 Design idea
The intelligent environmental protection information
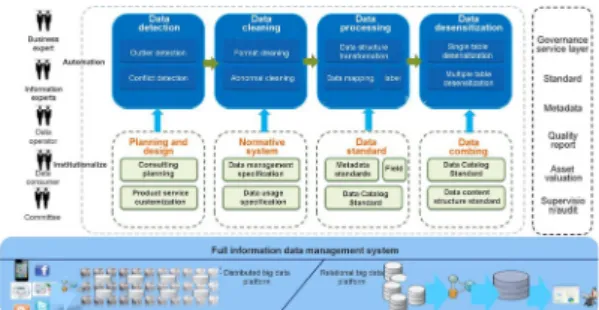
integrated platform uses a unified authentication single sign-on method to complete “Sign in once” and “Multiple system access”, realizes Multi-departmental collaboration, integrates independent and decentralized information systems, and enables various systems to work together to form a complete and efficient whole [7]. There are three main modules, namely the data management platform, the big data basic platform and the application system. The data management platform is responsible for the collection, cleaning, conversion and loading of source data, including loading the original data into the “Hadoop” platform and loading the processed data into the distributed database and main data warehouse(Fig. 2). The basic platform is responsible for storing massive traffic bill data, providing parallel computing and unstructured data processing capabilities, storing processed, associated, and summarized business data, and providing distributed computing, and outputting KPI to the main data warehouse and highly aggregated data(Fig. 3). Data governance, data mining algorithm and model management platform, support the whole process of data mining algorithm management, business analysis model construction and analysis model application, realize the unified management and maintenance of data assets, and provide the required intelligent analysis and analysis for upper application Decision support capabilities, through data modeling analysis and remote data sharing, to provide strong support for water, soil, gas, environmental assessment, law enforcement, early warning, emergency response and other businesses (Fig. 4), with standardized and standardized systems, safety assurance systems, and operation and maintenance management The system provides safe and reliable technical support for the system, effectively improving the comprehensive capabilities of the information platform.
Fig. 2. The overall design model of the data governance platform
Fig. 3. Big data basic platform architecture design model
Fig. 4. The overall business support model of the smart environmental protection data platform
3. Platform strategy analysis
Based on the above analysis of the demand for
smart environmental protection in Nanjing, in
order to avoid the data sharing difficulties of the
independent construction of the traditional
integrated information system and the large
investment in system operation and maintenance
[8],Based on current domestic and international
platform building experience, building intelligent
integrated information platform and application
system, unified processing of required data into
real-time database and historical database;
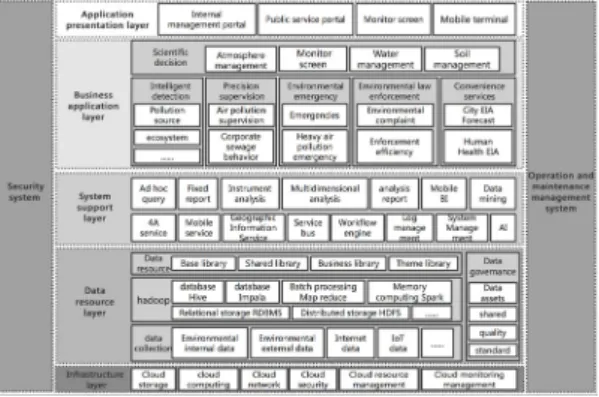
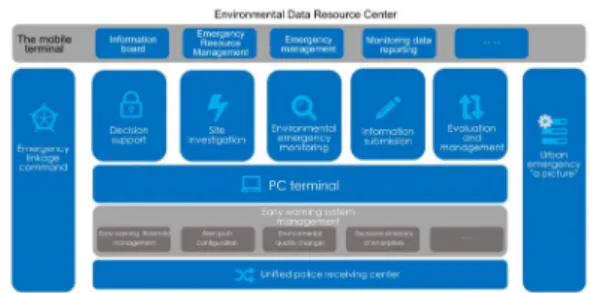
Through the intelligent integrated information platform, it provides unified comprehensive data application support, and realizes the comprehensive application of environmental protection portal web site, regional grid geographic coding, large-screen display systems, data visualization, environmental protection mobile APP systems, and environmental decision-making assistance systems(Fig. 5).
Fig. 5. The overall framework of the intelligent environmental protection information platform Through the construction of a smart environmental protection information platform, with information driving modernization as the main line, we will promote the development of big data, information sharing and a smart society [9]. Integrate intelligent applications and Internet-based facilities and products, improve the information exchange and sharing system, and ensure the construction of a unified platform, unified standards, and unified information security by improving internal comprehensive management capabilities [10].
4. Application system construction 4.1 Regional grid geographic coding
Grid geographic coding is the basis for the supervision platform to realize grid management,
so its accuracy must be guaranteed:(1) Establish a geographic coding collection and update mechanism for key pollution sources, emission sources, dust points, coal burning points and other data to realize the spatial management of key pollution sources, dust points, coal burning points and other data; (2) Provide problem locations The labeling function realizes the spatial position labeling of regional pollution prevention and control problems, and the integrated graphic and text display of the distribution position of the problem; (3) Compilation of the "ChangShu City Air Pollution Prevention and Control Grid Division Standard"
to realize the docking of four levels of users in the grid organization system [11].
4.2 Grid atmosphere monitoring system The main performance of the monitoring equipment is the concentration of particulate matter in the detection area (PM2.5, PM10, CO, O3,NO2,O3, TVOC)(Fig. 6), and it can also be used to detect the temperature, humidity, air pressure, wind speed and direction of the environment and many other parameters.
Fig. 6. Physical map of atmospheric monitoring micro-station
Table 1. Basic parameters of atmospheric monitoring micro-station
Communication method GPRS wireless communication Positioning Support GPS or BeiDou satellite
positioning Storage environment temperature -30 ° C~50 ° C
Storage environment humidity <90%RH Working environment
temperature -30 ° C~60 ° C
Working environment humidity 15%RH~95%RH
Function Functional description Real-time monitoring Directly check the location and name of
the catering units on the map Data query Latest data, historical data, exceed
standard data, run rate check Data analysis Check the trend of oil fume concentration
change and compare with emission standard
Analysis report Daily, weekly, monthly, quarterly and annual reports can be accessed and
exported according to time Early warning
management
The data in the platform for early warning rules, alarm management, alarm
processing.
Operations and maintenance management
Site management, equipment operation and maintenance records, equipment
operation statistics
Table 2. Function of On-line Monitoring System for Fume
4.3 Grid water quality monitoring system The basis for the construction of a grid-based water quality monitoring system is to document the sources of water pollution in the area, record the main emission sources and identify potential emission sources. The system uses water quality and pollution source discharge response relationship modeling, real-time online monitoring equipment data, combined with basic database data comprehensive analysis(Fig. 8),traces the source of water pollution, and provides modern application methods for accurately grasping the first-hand data of the monitored environment [12].
Fig. 7. System flow
4.4 Online monitoring system for cooking fume There are more than 300 harmful substances in cooking fume, which is one of the main sources of urban PM2.5. The catering oil fume online monitoring system can simultaneously display oil fume concentration, temperature, fan status, purifier status, monitoring time, etc., and can compare and analyze the oil fume concentration emission of multiple catering units [13]. When the monitoring data is within the scope of the rules, the system will automatically send the alarm to the front-end page and mobile application in real time at the same time, so that it is convenient to view the alarm information and deal with emergencies. The catering oil fume online monitoring system mainly realizes the following functions (Table 2).
4.5 Large screen display system
The system integrates all kinds of environmental information, and provides a unified large-screen display of the air, water, and pollution source
monitoring points on the map, as well as monitoring data and over-standard data(Fig. 9).
Through big data analysis and early warning of various environmental sensitive issues, highly integrated monitoring data of key pollution sources, scattered source monitoring data, video monitoring data, etc., through technical means to ensure synchronization of large-screen programs and software platform data, and display key information through GIS Partition display is used as an auxiliary support for real-time monitoring and environmental management decision-making [14].
Fig. 8. The reality of large screen display system (taking HuaXian County, HeNan Province as an example)
4.6 Data Visualization
Data visualization uses graphical "visualization" to
briefly and effectively output environmental
information to the audience for further
processing of environmental problems. Its
essence is the mapping from data space to
graphic space, including various environmental
models, The visual processing of various data, etc., uses computer graphics and data mining techniques and methods to vividly display the information hidden in the data to users in an interactive way [15]. As can be seen from the figure below, visualization is the link where users directly perceive data. End users can either modify the visualization results interactively, or adjust parameters to modify the model(Fig. 10).
In the interactive process of visualization and visual analysis, the perception and cognitive abilities of end users directly affect the process of information acquisition and processing, and then affect the final decision-making and iteration of data information.
Fig. 9. Data visualization basic process and expansion process
The environmental protection information platform is visually designed according to the thinking model, from the aggregation of business data, Internet of Things data, Internet data, to the application of data to the supervision of pollution source environment, pollution source monitoring, environmental emergency, public services, corporate services and other scenarios.
The entire data flow process in which the Ministry of Environmental Protection, the provincial government, the public, and enterprises provide data services.
Fig. 10. Data visualization design thinking model
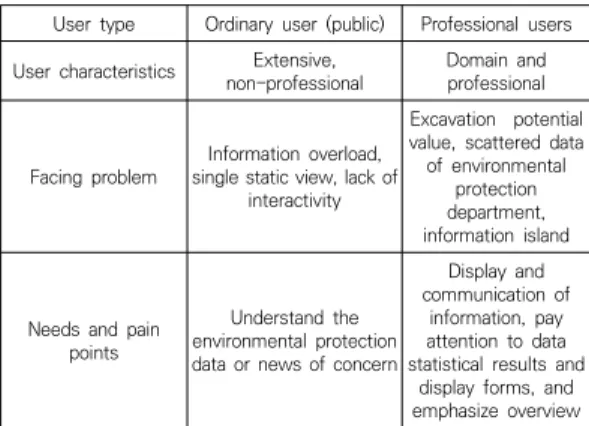
When constructing data visualization, taking into account the needs of different users for visualization a nd the purpose of reading information, through field research and user interviews, the needs and pain points of stakeholder are found. The target user groups can be divided into two categories(Table 3): (1) Orientation Public data visualization:
Environmental protection data visualization needs to convey to the public the status quo of environmental protection supervision and increase public awareness of environmental protection. Therefore, public-oriented data visualization does not emphasize the flexibility and agility of data display too much, but takes the visual effects of data visualization and the speed of building data visualization systems as important indicators. (2) Data visualization for government and enterprise departments: For government management and business personnel, they hope to use data visualization to assist environmental protection supervision and related business development. Government managers can only see the static data charts of each environmental protection department separately , No additional data, so data visualization is best to support the collaboration of various environmental protection departments and the report of environmental protection work.
User type Ordinary user (public) Professional users User characteristics Extensive,
non-professional Domain and professional
Facing problem Information overload, single static view, lack of
interactivity
Excavation potential value, scattered data of environmental
protection department, information island
Needs and pain points
Understand the environmental protection data or news of concern
Display and communication of
information, pay attention to data statistical results and
display forms, and emphasize overview
Table 3. Comparison of ordinary users and professional
users
Combined with the user’s actual scenario, the relatively required information architecture and application platform are different. Small-screen data visualization can only meet the needs of ordinary users or small groups: while large-screen data visualization is for professional users and is often used Multi-user real-time collaboration and monitoring decision-making, from the existing intelligent environmental protection visualization large screen can summarize three key elements: intelligence, efficiency, and intuitive.
Fig. 11. Design elements in the case study
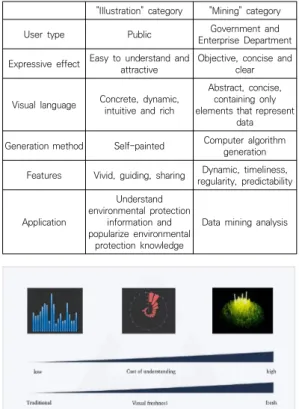
Based on the classification of the target user group and the elements of data visualization, data visualization can be divided into
"illustration" and "exploitation" categories(Table 4):(1)"illustration" category to facilitate the general public to understand as the primary goal, focusing on the use of visual and intuitive Graphics convey complex information to end users, mostly in the form of a comprehensive application of graphics, maps, graphic symbols, etc.; (2) "Excavation" is the easiest way to explain the logic behind the data, serving the professional population. Mainly summarize the internal patterns and structures in a large amount of abstract data. The presentation forms are mainly simple shapes such as dots and straight lines. Dot maps and starry sky 3D maps
increase the dynamics, but the cognitive cost is relatively increased(Fig. 13). The overall analysis of different trajectory information is emphasized.
Explore its relevance to assist government companies in handling environmental issues in a timely manner.
Table 4. Comparison of data visualization for different users
"Illustration" category "Mining" category
User type Public Government and
Enterprise Department Expressive effect Easy to understand and attractive Objective, concise and
clear Visual language Concrete, dynamic,
intuitive and rich
Abstract, concise, containing only elements that represent
data Generation method Self-painted Computer algorithm
generation Features Vivid, guiding, sharing Dynamic, timeliness,
regularity, predictability Application
Understand environmental protection
information and popularize environmental
protection knowledge
Data mining analysis
Fig. 12. Comparison of chart types and cognitive costs for different users
The data visualization of the smart environmental protection platform is not only the work of data presentation, it is also an effective way for ordinary users to interact with a large amount of data. As an important carrier for the government, enterprises, and media to display data, the large screen is very interactive.
Particularity requires thinking from the
perspective of the viewer. What they focus on
determines the display direction(Fig. 14).
Fig. 13. Static visualization (left) Interactive visualization (right)
4.7 Mobile APP system
The environmental protection mobile APP system uses smart phones (including Android &
IOS systems), tablet computers and other portable terminals as carriers to realize intelligent applications for environmental business and supervision work, and can be connected to various existing business systems, including mobile law enforcement, pollution source supervision, and environmental quality Early warning, emergency command, information inquiry, etc. "My Nanjing" is a fully real-name certified "Internet + City Service" mobile phone application software. The "Smart Environmental Protection" application is one of the modules.
The main function of this module is to measure environmental protection business information applications and user participation. Level and ability, and can integrate the application of environmental protection department online and offline interaction, environmental protection business intelligent applications and user experience.
4.8 Environmental Assistant Decision System and Environmental emergency system The goal of the environmental decision-making system is to timely grasp hazardous chemicals, key risk sources, environmentally sensitive points, environmental emergency material reserves, and basic disposal methods for various pollutants. Relying on the platform function, it can quickly and quickly Accurately provide support for event decision-making and minimize losses as much as possible.
Fig. 14. Environment-assisted decision-making systems The environmental emergency system is based on the professional requirements of environmental emergency, based on the concept of full-process control of environmental emergency incidents, and establishes an emergency response command system that combines information technology, communication technology and GIS technology to achieve rapid and timely response to environmental emergencies , Accurate response and disposal. The content of the system includes emergency prevention management, emergency preparedness management, emergency command management, diffusion simulation analysis, emergency summary and evaluation management, and mobile emergency.
Fig. 15. Environmental Emergency Response System
4.9 Integrated law enforcement system
The integrated mobile law enforcement system
uses wireless network, GPS, GIS and other
technologies to use wireless-enabled PDA, smart
phones, laptops and other handheld mobile
devices as information processing terminals[16],
according to the law enforcement process of the
environmental protection agency's supervision and law enforcement agencies, An information processing system that realizes the functions of inquiring law enforcement business information, obtaining historical data of enterprises, confirming the geographical location of pollution sources, recording on-site pictures and texts and recording, video evidence, and back- end management at any time at the environmental law enforcement site.
5. Discussion and outlook
This article is mainly based on the current status of intelligent environmental protection information management in Nanjing, proposes a preliminary idea of an integrated application platform for intelligent environmental protection information, integrates various systems of the original business, supplements the construction of new business systems, and accelerates the information management of Nanjing's ecological environmental protection system process. In addition to the ability to invest in resources such as platform construction, the level of integrated applications such as intelligent applications and user participation is also an indispensable link in the construction of smart environmental protection. At the same time, through the analysis of the current situation of Nanjing's environmental protection information platform construction and the summary of the platform design process methods, it has reference value for the construction of other urban information platform. Subsequent research will conduct in-depth research on the needs, functions, and goals of intelligent city information services in Nanjing. Oriented to enhance user experience,
promote the construction of Nanjing's smart city and the transformation of information services.
REFERENCES
[1] X. Yao et al. (2014). Theory and practice of intelligence and environmental protection.
Beijing:
China Science Publishing & Media Ltd.
[2] R. Liu. (2013). Smart environmental protection: Escort for the construction of beautiful China.
Environmental Management in China, 5(5),
2–3.[3] X. J. Yang & Z. Q. Xu. (2014). Discussion on the promotion of smart environmental protection strategy and its top-level design path under the background of smart city.
Urban Development Research, 21(6),
22-25.[4] B. Y. Zhou, R. R. Xu, X. L. Xu & H. Hu. (2018). Study on the application of smart environmental protection in urban environmental governance.
Electronic Government, 2018(2),
82-88.DOI:10.16582/j.cnki.dzzw.2018.02.009
[5] W. Q. Chen. (2017). Considerations on the construction of environmental protection big data platform in Jiangxi Province.
Jiangxi Science, 35(6),
997-1000.DOI: 10.13990 /j.issn1001-3679.2017.06.034 [6] R. Liu, W. Q. Liu, J. J. Wei, T. Xie, F. Wang, H. H. Li
& J. W. Yang. (2018). Research on "Internet +" Smart Environmental Protection Evaluation Index System.
Engineering Science in China, 20(2) ,
120-128.DOI 10.15302/J-SSCAE-2018.02.018
[7] G. L. Qu, X. G. Zhong & X. L. Li. (2016). Integrated application of intelligent environmental protection information based on cloud computing and Internet of Things.
China Science and Technology Information, 2016(12) ,
57-59.DOI:10.3969/j.issn.101- 8972.2016.12.022
[8] W. Sun & Y. N. Wang. (2016). The design concept of a smart environmental protection information platform.
Smart Factory, 2016(9),
57-60+68.DOI:10.13719/j.cnki.cn14-1279/tu.2020.07.086 [9] A. R. Dang et al. (2018). The development process and
trend of new smart cities in China.
Science &
Technology Review, 36(18),
16-29;DOI: 10.3981/j.issn.1000-7857.2018.18.002
[10] X. Y. Fei. (2019). Exploration and Practice of Smart Environmental Construction Path——Taking Shenzhen as an Example.S
mart Buildings and Smart Cities, 2019(5),
95-97.DOI:10.13655/j.cnki.ibci.2019.05.032
[11] S. Feng. (2017). Countermeasures to strengthen smog control in county-level cities: Taking Changshu as an example.
Pollution Control Technology, 30(5),
47-51.[12] Y. Xu, S. Chen & D. Q. Xu. (2013). Environmental protection information construction and application research.
Resource Conservation and Environmental Protection, 2013(9),
70.[13] H. B. Ji & H. F. Zhu. (2016). Online monitoring system
for cooking fume based on "Internet+".
China Environmental Protection Industry, 2016(2),
45-49.[14] R. Liu, J. W. Yang, X. Zhou. (2018). The application of large-screen visualization products in the command center and the display and control system solution—
—Taking the command center of a certain energy industry as an example.
Smart Buildings and Smart Cities, 2018(4),
41-45.DOI:10.13655/j.cnki.ibci.2018.04.014
[15] Y. J. Hou & Y. Ding. (2016). On the application of information visualization in news communication.
Publishing Wide Angle, 2016(5),
80-81.DOI: 10.16491/j.cnki.cn45-1216/g2.2016.0200 [16] X. Feng, Y. Liu & H. J. Ma. (2017). Research on
Application Framework of Cloud Platform for Smart Environmental Law Enforcement.