Superconductivity and Cryogenics Vol.12, No.2, (2010), pp.17~20
```
Abstract-- A considerable amount of research material discussing designs and properties of High Temperature Superconducting Fault Current Limiter (HTS FCL) is available. However, a shortage of research concerning positioning of HTS FCL in power grid is felt. In this paper a feasibility study of HTS FCL positioning in Smart Grid through simulation analysis is carried out. A complete power network (including generation, transmission and distribution) is modeled in Simulink / SimPowerSystems. A generalized HTS FCL is also designed by integrating Simulink and SimPowerSystem blocks. The distribution network of the model has a wind turbine attached to it forming a micro grid. Three phase fault have been simulated along with placing FCL models at key points of the distribution grid. It is observed that distribution grid, having distributed generation sources attached to it, must not have a single FCL located at the substation level. Optimized HTS FCL location regarding the best fault current contribution from wind turbine has been determined through simulation analysis.
1. INTRODUCTION
High Temperature Superconducting Fault Current Limiter's (HTS FCL) ability to reduce fault current level in the first cycle cannot be replaced by conventional protection devices (CPD) being used for fault current protection at substation level like circuit breakers (CB), over-current protection relays (OCR) etc [1]. The CPD has a response-time delay that allows initial two to three fault current cycles to pass through before getting activated. The first-cycle suppression of fault current by HTS FCL results in an increased transient stability of power systems leading to power systems carrying higher power with greater stability [2].
Smart grid is the name of future power grid which will cope with challenges such as depleting conventional energy resources, higher power demands, global warming and efficient energy consumption. One of the key features of this grid is the large number of distributed generation sources (DG) connected to it. However, when DGs were integrated with conventional power grid, many new challenges surfaced. One of the key challenge is the DG behavior
* Corresponding author: [email protected]
behavior in case of fault and its contribution in initial fault current.
In this paper, the effect of HTS FCL installed in a distribution network having a Wind Turbine (WT) DG integrated with the network is evaluated. It has been observed that HTS FCL should not be installed directly at the location of CPD. This placement of HTS FCL results in abnormal fault current contributions from the WT.
Moreover, rapid suppression of fault current by HTS FCL might also result in fault being not detected by CPD. If HTS FCL can have a certain kind of intelligence built-in that detects its transition into limiting mode and inform the CPD (for example through wireless communication) the problem for fault being undetected and islanding can be solved. The strategic location of HTS FCL in a power grid along with fault occurrence detection is of immense importance for HTS FCL to become a practicable protection device.
2. BACKGROUND
2.1. Smart Grid
The conventional power resources are depleting rapidly with every passing day. The energy demand on the other hand is rising exponentially. The survival of electric grid in the future is highly dependent on utilization of renewable energy resources, adopting energy conservation in daily lives and modernizing the century old power grid topology with latest technological developments.
DG will be an imperative part of the future power grid and WT utilizing wind energy will have a considerable share in this grid.
2.2. Wind Energy and Wind Turbine
Wind energy is playing an increasingly important role in global electricity generation, showing an annual growth rate of more than 32% [1]. By the end of year 2009 the total global installed capacity has increased to 160 GW. It depicts that a large number of power transmission and distribution networks around the world has WTs attached with them. If HTS FCL technology has to be commercially introduced, it must be ensured that its installation does not impose any negative effect on the already installed WTs.
Modeling and Simulation using Simulink and SimPowerSystem of optimized HTS FCL location in a Smart Grid having a Wind Turbine
connected with the grid
Umer Amir Khan, Sang-Hwa Lee, Jae-Kyu Seong, Bang-Wook Lee*
Department of Electronic and Electrical Control and Instrumentation Engineering, Hanyang Univeristy, ERICA Campus, Korea
Received 31 March 2010; accepted 11 May 2010
Modeling and Simulation using Simulink and SimPowerSystem of
optimized HTS FCL location in a Smart Grid having a Wind Turbine connected with the grid
The two major types of WT are fixed-speed WT and variable-speed WT. In fixed-speed WT the generator is directly connected to power grid and WT upto 2.3 MW are being widely used. In variable-speed systems the generator is normally connected to the grid by power electronic system [4]. In our proposed study fixed-speed WT directly coupled with a power grid is considered. As there is no power electronics involved in integration, the fault current contribution is a major area of concern with these kinds of WT.
2.3. HTS FCL
High Temperature Superconductors are a promising technology of future with many great applications ranging from power lines, motors and generators, transformers, fault current limiter etc [1]. Due to the internal property of HTS, it limits the fault current in the first cycle making it the most suitable device for initial fault current limitation.
HTS FCL can be characterized by four fundamental parameters which are 1) Transition Time (Response Time), 2) Maximum Impedance, 3) Triggering Current and 4) Recovery time [6]. The generalized FCL model designed for this research paper is based on these four parameters.
HTS FCL is probably the most mature application of HTS which is very close of deployment in Electric Power Systems [1]. Therefore, a generalized HTS FCL model can be useful in developing applications for various and variant power grid structures. Matlab's Simpowersystem provides the necessary tools and applications for designing HTS FCL models and simulating their practical effectiveness.
3. SYSTEMSTUDIES
Matlab/Simulink/Simpowersystem is used to design and simulate models in this research paper. These models are used for the feasibility analysis of HTS FCL in Smart Grid application. Simpowersystem is a toolbox of Simulink that allows rapid designing and simulation of power systems.
Various other Simulink toolboxes can be integrated with these power models for developing comprehensive and innovative smart grid applications.
3.1. Power Network Model
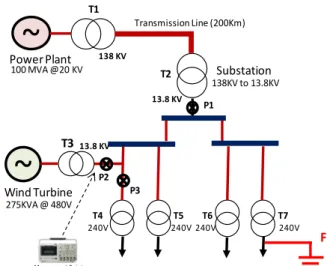
To analyze the effect of HTS FCL on smart grid a detailed power network is modeled. Fig. 1 shows the line diagram of the developed power network. The power network is composed of a 100 MVA conventional powerplant, a 200 kilometers long 138KV (distributed parameter) transmission line and a distribution network of approximately 5 MVA load. The distribution network is assumed to be supplying electricity to a small town far away from the conventional power plant.
A 275KVA windturbine is connected with the distribution network forming a micro grid. The WT is equipped with fixed speed induction generator directly connected to the grid. In Fig. 1 T1 is a step-up transformer (20 kV to 138 kV), T2 is a step-down tranformer (138 kV to 13.8 kV) and T3 is step-up tranformer (480 V to 13.8 kV) connecting WT to the grid. T4, T5, T6 and T7
Fig. 1. Line diagram of simulated power grid.
represents pole-mounted distribution tranformers with output voltage of 240 V. P1, P2 and P3 are the locations where HTS FCL will be installed and analysis performed.
3.2. Generalized FCL Model
A generalized HTS FCL is modeled on the bases of the four fundamental parameters as mentioned in Section 2.3.
Transition or Response Time is the time taken by the HTS FCL to change from normal operating mode to current limiting mode. Maximum Impedance is the impedance attained by FCL in current limiting mode. Triggering current is the current required to force FCL to move into current limiting mode. Recovery time is time required by FCL to get back into normal state after the current has decreased to a level lower than transition current [6]. The line diagram of designed HTS FCL model is shown in Fig.
2.
The model senses the current passing through it. It calculates the RMS value of the current and then compares it with a characteristic table. The characteristic table contains the data of above mentioned four parameters. If the current has crossed the triggering current level, FCL's resistance increases to maximum impedance level in defined transition time. When the current level falls below the triggering current level the system waits until the recovery time and then goes into normal state.
Fig. 2. Line diagram of generalized HTS FCL Model.
FAULT CURRENT LIMITER
RMS Value of Current
Comparison
Selection of Resistance Current
Sensing
HTS Characteristics
Simulator
~
~
Power Plant
100 MVA @20 KV Substation
138KV to 13.8KV
Wind Turbine
275KVA @ 480V T1
T2
T3
T4 T5 T6 T7
P1
P2 P3
Transmission Line (200Km)
138 KV
240V 240V 240V 240V
13.8 KV
13.8 KV
F
Measurement Point
18
Umer Amir Khan, Sang-Hwa Lee, Jae-Kyu Seong, Bang-Wook Lee
Fig. 3. HTS FCL model developed in SimPowerSystem. In normal mode it produces a minimal resistance and in current limiting state it produces a resistance equivalent to what is determined in characteristic table.
Fig. 3 shows the HTS FCL model designed in Simulink/SimPowerSystem. Two type of FCL are modeled for the simulation analysis. These models will be placed at different locations in the power grid and the WT reaction to fault will be analyzed.
Type One : This is high power rating FCL installed in the distribution grid. It deals with very large short circuit current. It will be installed at location P1 and P3 in Fig. 1.
Type Two : This is comparatively low power rating FCL designed to be installed with a wind turbine. It deals with smaller short circuit current. It will be installed at location P2 in Fig. 1.
TABLE I
CHARACTERISTICS OF DESIGNED FCLMODELS. FCL Characteristics Type One Type Two
Operating Voltage 13.8 kV 13.8 kV
Trigger Current 300 Amperes 40 Amperes
Response Time 1.15 msec 1.4 msec
Nominal Impedance 0.01 Ω 0.01 Ω
Limiting Impedance 20 Ω 40 Ω
40 Ω 60 Ω Fault Current Reduction 35%@20 Ω
72%@40 Ω
35%@40 Ω 72%@60 Ω
4. SIMULATIONSTUDIES
The generalized FCL model is placed in the Power Network model and FCL's effect has been simulated and analyzed during a three phase to ground fault carried out at t = 0.258 seconds. The location of this fault is marked as 'F' in Fig. 1. Three-phase-to-ground fault is the most severe type of fault and is used in this simulation to determine the network and wind turbine response [9].
Fig. 1 shows the network layout with P1, P2 and P3 representing the various locations where HTS FCL has been installed. Fault current is measured at the output of T3 shown in Fig. 1 i.e. the transformer connecting WT with the grid. Fig. 4 to Fig. 7 shows currents measured at the output of T3 as shown in Fig. 1. The performance and effect of FCL in these locations is explained as follows:
4.1. FCL at Substation (Type One FCL at P1)
Type One FCL is placed at position P1 shown in Fig. 1.
The initial fault current contribution from the wind turbine has drastically increased. Also the induction type WT loses its synchronism and moves into unstable region. The WT is forced to operate in over-rated mode. Also change in output-voltage frequency and voltage spikes will be observed. The WT and power quality of the whole network will be affected. This is a very critical and important observation.
0.250 0.255 0.260 0.265 0.270 0.275 0.280
-140 -120 -100 -80 -60 -40 -20 0 20 40 60 80 100 120 140 160
Current (Amperes)
Time (Seconds)
No FCL A No FCL B No FCL C With FCL A With FCL B With FCL C
Fig. 4. Output of T3 in Fig.1. Abnormal fault current contribution from the wind turbine can be seen.
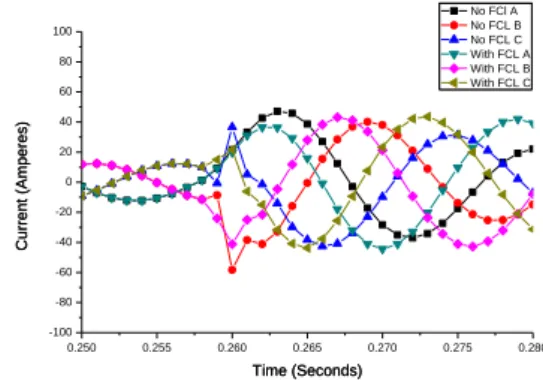
4.2. FCL at Wind Turbine (Type Two FCL at P2) If the FCL is installed at the wind turbine then fault current contribution from the wind turbine can be reduced.
The position of Type Two FCL is marked as 'P2' in Fig. 1.
This location of HTS FCL will only be accessible to the WT Grid and will not contribute in limiting any other fault current flowing in the distribution network. A large amount of fault current, being generated by the power plant, will still flow through the substation.
0.250 0.255 0.260 0.265 0.270 0.275 0.280
-100 -80 -60 -40 -20 0 20 40 60 80 100
Current (Amperes)
Time (Seconds)
No FCl A No FCL B No FCL C With FCL A With FCL B With FCL C
Current (Amperes)
Time (Seconds)
No FCl A No FCL B No FCL C With FCL A With FCL B With FCL C
Fig. 5. Output of T3 in Fig. 1. FCL installed at P2 reduces the fault current contribution from the Wind turbine.
4.3. FCL at Substation and Wind Turbine (Type One FCL at P1 and Type Two at P2)
This configuration involves two different FCLs located at two different locations. These positions are marked as 'P1' and 'P2' in Fig. 1. The Fault Current performance of the network is better than that of single FCL at P1 or P2. The overall fault current of the system has been reduced which includes fault current from the power plant as well as the fault current from the WT. However, this solution is highly uneconomical and also inefficient utilization of HTS FCL technology.
19
Modeling and Simulation using Simulink and SimPowerSystem of
optimized HTS FCL location in a Smart Grid having a Wind Turbine connected with the grid
0.250 0.255 0.260 0.265 0.270 0.275 0.280
-100 -80 -60 -40 -20 0 20 40 60 80 100
Current (Amperes)
Time (Seconds)
No FCL A No FCL B No FCL C With FCL A With FCL B With FCL C
Fig. 6. Output of T3 in Fig. 1. Wind turbine fault current contribution when two FCL are installed in the network.
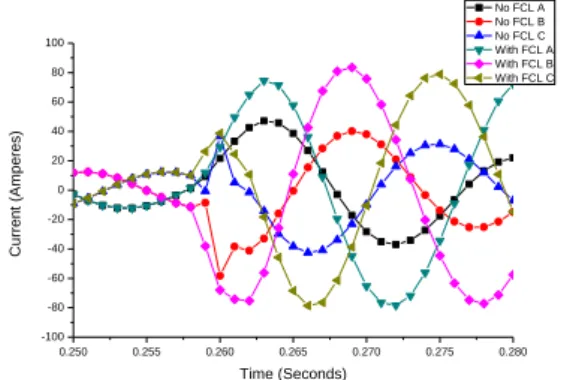
4.4. FCL at WT and Grid Connection Point (Type One FCL at P3)
In this scenario the Type One FCL is placed inside the distribution grid at the point where the wind turbine has been connected with the grid. This point is marked as 'P3' in Fig. 1.
The best performance of the FCL has been observed in this strategic location. WT fault current is automatically limited due to the indirect affect of the FCL located in a strategic position in the power grid. We have observed a reduction of 71% fault current from the substation along with 60% fault current reduction in the current from the wind turbine. Moreover the Wind turbine has not been pushed into instability region.
It can be seen that when HTS FCL was placed at the position of CPD, it imposed a negative effect on the DG connected with the grid. Table II summarizes the characteristics of the FCL that should be strategically installed in the power grid.
0.250 0.255 0.260 0.265 0.270 0.275 0.280
-100 -80 -60 -40 -20 0 20 40 60 80 100
Current (Amperes)
Time (Seconds)
No FCL A No FCL B No FCL C With FCL A With FCL B With FCL C
Fig. 7. Output of T3 in Fig. 1. Wind turbine fault current contribution with Type One FCL installed in the grid.
TABLE II
PROPOSED CHARACTERISTICS OF HTSFCL.
Response Time < 1.5ms
Fault Current Reduction 50% or more
Triggering Current < 20% of peak fault current
Location Distribution Grid
Operational Voltage 13.8 kV
Topology 3 Phase
DG Never connect directly
5. CONCLUSION
The simulation analysis point out toward an important fact that if the distribution grid is composed of DG connected to grid then replacing CPD with HTS FCL will not be a good option. Moreover increasing the number of FCLs is also not a feasible engineering solution. It is the strategic location of the FCL in the grid which determine the Fault performance of the network. In the proposed study the FCL installed in the grid at the point of integration of wind turbine with the grid shows the best fault current performance. It is also suggested that the FCL should have the intelligence to detect its transition into limiting mode and inform the CPD at substation and WT level for protective actions.
ACKNOWLEDGMENT
Gratitude to Higher Education Commission Government of Pakistan for sponsoring the studies of Mr. Umer Amir Khan.
REFERENCES
[1] T. Jamasb, W. J. Nuttall and M.G. Pollitt, “Future Electricity Technologies and Systems”, Cambridge, 235-246 & 83-97, 2006.
[2] B. C. Sung, D. k. Park, J. W. Park, T. k. Ko, “Study on a series resistive SFCL to improve power system transient stability:
Modeling, Simulation and Experimental Verification”, IEEE Trans.
on Industrial Elec., Vol 56, No. 7, pp 2412, 2009.
[3] R. Strzelecki, G. Benysek, “Power Electronics in Smart Electrical Energy Networks”, Springer, 1-9, 2008.
[4] F. Blaabjerg & Z. Chen, “Power Electronics for Modern Wind Turbines”, Morgan and Claypole, 11-24, 2006.
[5] Y. Shirai, M. Taguchi, M. Shiotsu, H. Hatta & T. Nitta, “Simulation study on Operating Characteristics of Superconducting Fault Current Limiter in One-Machine Infinite Bus Power System”, IEEE Trans. on Appl. Superconductivity, Vol. 13, No. 2, pp. 1822-1824, 2003.
[6] K. Maki, S. Repo, P. Jarventausta, “Effect of Wind Power based Distributed Generation on Protection of Distribution Network”, Tampere University of Technology, Finland, pp. 327-330, 2004.
[7] Ismail Kasikci, “Short Circuits in Power Systems, A practical guide to IEC 60 909”, Wiley-Vch, pp. 13, 2002.
[8] H. Hatta, S. Muroya, T. Nitta, Y. Shirai & M. Taguchi,
“Experimental study on limiting operation of superconducting fault current limiter in double circuit transmission line model system”, IEEE Trans. on Appl. Superconductivity, Vol. 12, No. 1, 2002.
20