Changes in Growth and Quality of Melon (Cucumis melo L.) and in Soil Nitrogen Forms due to Organic Fertilizer Application
Yang Ho Park and Beom Seok Seo*
Korea Greenhouse Crop Research Institute, Jeonnam 517-911, Korea
The purpose of this study was to determine the effects of organic fertilizers on soil properties and growth and quality of melon. Organic fertilizer was applied in soil at the rate of 0, 0.5, 1, 2N according to Rural Development Administration guideline in Korea. The fertilizer had no effects on plant growth-rate parameters, including plant height, leaf number, and leaf size. There were minor effects on the fruit quality parameters such as fruit weight, fruit length, fruit width, placenta and seed weights, sugar content, and starch content.
Ascorbic acid level was decreased as fertilizer level was increased. The level of nitrate in groundwater increased with increased levels of N.
Key words: N itrate nitrogen, Ammonia nitrogen, Growth rate, Organic fertilizer
Received : 2012. 11. 23 Accepted : 2012. 12. 6
*Corresponding author : Phone: +82613812891 E-mail: [email protected]
Introduction
The area of melon cultivation in Korea has increased drastically since 2000. It reached 1,410 ha in 2006.
Almost all melon cultivation farms consist of 4-5 green houses measuring 6.6-9.9 a or 2-3 green houses measuring 13.3-19.9 a for year-round production.
Escalating costs, an increasing demand for chemical fertilizers, and reduced soil fertility requires the combined application of organic and inorganic nutrient sources for sustainable crop production and healthier plants (Yang, 2006). Previously, studies examining the effects of organic fertilizers on tomatoes (Akanbi et al., 2000), garden eggs (Akanbi et al., 2001), amaranth (Akanbi and Togun, 2002), and sweet potatoes (Abad et al., 1997) showed positive results. A well-prepared maze compost (5% N), at 3-6 ton ha
-1, was found to be adequate for these crops. This contradicts the results of many previous studies, in which the required amount of organic fertilizer was between 20 and 30 ton ha
-1. On the other hand, high nutrient loss as a result of leaching and volatilization has been observed after application of low C:N ratio plant residue. Therefore, it is necessary to obtain accurate estimates of the level of nitrogen mineralization from soil organic matter and plant material to make the N fertilizer recommendations useful for crops. Furthermore, fortification of compost
with small amounts of N-mineral fertilizer further reduces the quantity required by crops and produces interactions favorable for plant growth and development.
Nitrogen is the element that is most prone to transformations, and this affects the availability to plants. These transformations include mineralization, immobilization, nitrification, and denitrification as well as leaching and ammonia volatilization (Petersen et al., 1998).
Nitrogen as nitrate is soluble, mobile, and easily transported to the groundwater. This is why nitrate levels in groundwater have increased (Strebel et al., 1989). Agriculture is the major contributor to nitrate contamination of groundwater (Fraters et al., 1998). One of the objectives of organic farming is to reduce the amount of nitrate entering the groundwater (Pang and Ltey, 2000). However, whether or not organic farming increased nitrate leaching into groundwater in comparison to conventional practice is unclear (Torstensson et al., 2006).
Nitrogen fertilizer affects melon yield, fruit size, and texture (Bhella and Wilcox, 1986). In addition, the sugar content may also be affected (Hariprakasa and Srinivas, 1990). Heavy N application can stimulate vegetative growth at the expense of fruit yield (Hartz and Hochmuth, 1996).
The effects of different N levels on crop yield and
quality were previously described for tomatoes (Erdal et
al., 2006), potatoes (Darwish et al., 2006), and eggplants
(Aujla et al., 2007). However, few reports exist on
Table 1. Chemical properties of the soil used in the experiment.
NO3--N NH4-N Av. P2O5 Ca K Mg Na CEC pH EC
--- mg kg-1 --- --- Ex. (cmo l+ kg-1) --- (cmol+ kg-1) 1:5 1:5
4.0 9.0 210.6 3.6 1.4 0.9.1 1.5 8.76 6 0.72
melon and often have contradictory conclusions (Kirnak et al., 2005; Panagiotopoulos, 2001). It is likely that the optimal amount of fertilizer depends on the melon variety, plant density, soil type, and climate conditions.
The objective of our experiments was to study the effects of organic fertilizer on soil properties and growth and quality of melon.
Materials and Methods
Plant cultivation and treatments Experiments were conducted with melon (Cucumis melo L. cv. Kingstar) under plastic greenhouse conditions in Dam-Yang (Korea) from March 2009 to end of June 2009. Melon was grown directly on the ground. Each plot size was 33 m
2, and 3 replicate plots were used per treatment.
Planting distance was 30 cm. Soil chemical properties before transplanting are described in Table 1. Ridges were mulched with black plastic film (0.02-mm thickness). The beds were drip-irrigated (dripper flow = 1.49 L h
-1; Netafim, Fresno, CA). Standard melon cultivation practices were followed (Yoo et al., 1989)
One week before transplanting, organic fertilizer (N = 1.7%, P = 1%, K = 0.7%) was applied. Treatments were conducted at 0 N, 0.5 N, 1 N, and 2 N, which are standard rates of fertilizer application recommended by the Korea Rural Development Administration (1 N corresponds to N:P:K = 10:15:10 kg 10 a
-1).
We measured the growth rate, leaf number, leaf length, leaf width, and plant length every 2 weeks. We also sampled soil at depths of 0-30 cm and 30-60 cm every 2 weeks. Soil samples were analyzed for pH, EC, NO
3-, NH
4+, and urea.
Fruit quality parameters Fruits were harvested when fully mature (70 days after anthesis). Each melon was weighed to determine the mean fruit weight. Immediately after harvest, the fruit diameter, fruit length, skin ratio, and sugar content (using an Atago refractometer) were determined. The weight of the placenta (as proportion of the fruit weight) and the seed weight were also determined. The ascorbic acid (AsA) content was
determined in fresh tissue. Contents of sugar and starch were determined in dry tissue.
Analysis of soil pH and EC The pH of the soil was estimated in a 1:5 soil:water suspension using a pH meter (Hanna, Woonsocket, RI). The electrical conducti- vity was estimated in the supernatant of the 1:5 soil:
water suspension by using an EC meter (Hanna.
Woonsocket, RI).
Analysis of NO
3-N The concentration of NO
3-was determined using the salicylic acid method (Cataldo et al., 1975). The extracted soil sample (0.1 mL) was mixed thoroughly with 25 mM CaCl
2and 0.4 mL of 5%
(w/v) salicylic acid in concentrated H
2SO
4. After 20 min, 9.5 mL of 2 N NaOH was added slowly at room temperature to increase the pH above 12. Samples were cooled to room temperature, and absorbance at 410 nm was determined using a spectrophotometer (HANBIT, HNBT-3000).
Analysis of NH
4-N The amount of ammonium was determined using the salicylate method (Kempers and Zweers, 1986). The extracted soil sample (0.1 mL) was mixed thoroughly with 1 M KCl, 1.5 mL reagent A, and 2.5 mL reagent B. After 2 h, the absorbance was measured at 660 nm at room temperature using a spectrophotometer (HNBT-3000). Reagent A is 1:10:20 of 4% Na
2-EDTA:44% salicylic acid in 4 N NaOH:0.05% sodium nitroprusside. Reagent B is 1:4 of 0.7% sodium hypochlorite solution:75 mM NA-P buffer (pH 12.3).
Analysis of urea The urea concentration was
measured using the phenyl mercuric acetate method
(Douglas and J.M, 1970). The extracted soil sample (1
mL) was mixed thoroughly with 0.005% phenyl
mercuric acetate in 1 M KCl and 1 mL reagent A. Next,
absorbance was measured at 440 nm using a spectro-
photometer (HNBT-3000). Reagent A is 100 mM p-dimethy-
lamino benzaldehyde in 10:1 ethanol:HCl solution.
Table 2. Plant height of melon plants grown in plots with different levels of organic fertilizer.
Transplant 2-week 4-week 6-week 8-week
0N 6.0ay 12.3c 54.7a 146.7ab 175.3a
0.5N 6.0a 13.3bc 55.3a 158.2a 193.6a
1N 6.0a 15.0b 61.3a 157.7a 179.5a
2N 6.0a 17.0a 58.7a 136.0b 197.6a
yThe same letters are not significantly different of DMRT 5% (p = 0.05).
Table 3. Leaf number of melon plants grown in plots with different levels of organic fertilizer.
Transplant 2-week 4-week 6-week 8-week
0N 5.9ay 6.0a 11.0a 17.9a 23.3
0.5N 5.9a 6.7a 11.3a 19.8a 23.3a
1N 5.9a 6.7a 12.3a 19.6a 24.0a
2N 5.9a 6.3a 12.0a 20.2a 22.3a
yThe same letters are not significantly different of DMRT 5% (p = 0.05).
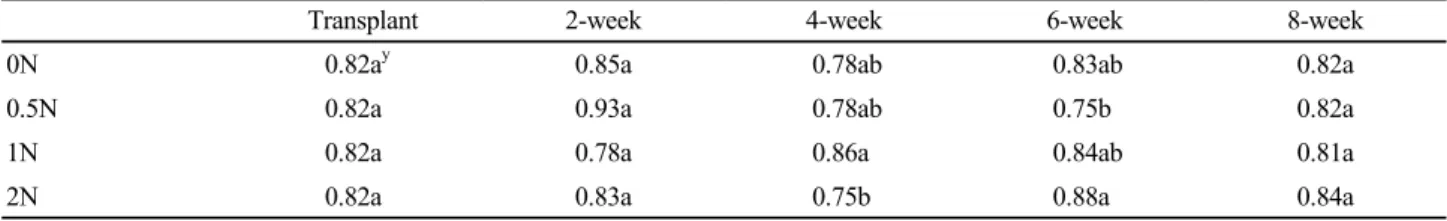
Table 4. Leaf shape index of melon plants grown in plots with different levels of organic fertilizer.
Transplant 2-week 4-week 6-week 8-week
0N 0.82ay 0.85a 0.78ab 0.83ab 0.82a
0.5N 0.82a 0.93a 0.78ab 0.75b 0.82a
1N 0.82a 0.78a 0.86a 0.84ab 0.81a
2N 0.82a 0.83a 0.75b 0.88a 0.84a
yThe same letters are not significantly different of DMRT 5% (p = 0.05).
Analysis of AsA AsA(Ascorbic acid) and dehydro- ascorbic acid (DHA) measurements were performed using the hydrazine method (Park et al., 2006). One gram of plant powder (homogenized with liquid nitrogen) was added to 10 mL of 5% (w/v) metaphosphoric acid, shaken at 140 rpm for 1 h, and passed through a NO.6 filter paper. To determine DHA and DHA plus AsA (the latter was oxidized with 2,6-dichlorophenolindophenol solution) in the 1 mL extract, 2% (w/v) thiourea was added; the mixture was placed in a water bath at 37°C for 3 h and moved to ice water. After addition of 2.5 ml of 85% (w/v) H
2SO
4and 0.5 mL of 2% (w/v) 2,4-dinitrophenylhydrazine (in 9 N H
2SO
4), the extract was placed at room temperature for 30 min. The absorption was measured at 520 nm using an HNBT-3000 spectrophotometer.
Analysis of sugar and starch Fruit samples were crushed and dried. Soluble sugars were extracted with 5 mL of boiling 80% (v/v) ethanol for 1 h, followed by centrifugation at 10,000 × g at 4°C for 10 min. The process was repeated for complete extraction. The amount of total soluble sugar was determined using
anthrone reagent and glucose as a standard (Roe, 1955).
Total soluble sugars included sucrose, hexose, pentose, and their phosphate derivatives, as well as soluble oligosaccharides. For starch extraction, the pellet obtained after soluble sugar extraction was suspended in 1 mL of 0.2 N KOH and placed in a boiling water bath for 30 min. After cooling, the pH of the mixture was adjusted to 5.5 by adding 0.2 mL of 1 M sodium acetate buffer (pH 5.5). To each sample, 10 mL of amyloglucosidase (35 µ·mL
-1in 50 mM sodium acetate buffer, pH 5.5) was added and incubated at 37°C for 16 h (Rufty and Huber, 1983). The starch content was determined using anthrone reagent.
Results
Growth rate No correlation was observed between
plant height (Table 2) or the number of leaves (Table 3)
and the amount of organic fertilizer for the first 8 weeks
after transplanting. Plant height reached 200 cm, and the
number of leaves was 22-23. The leaf shape index (leaf
length/leaf width) did not change with the level of
organic fertilizer (Table 4). The melon leaf shape was
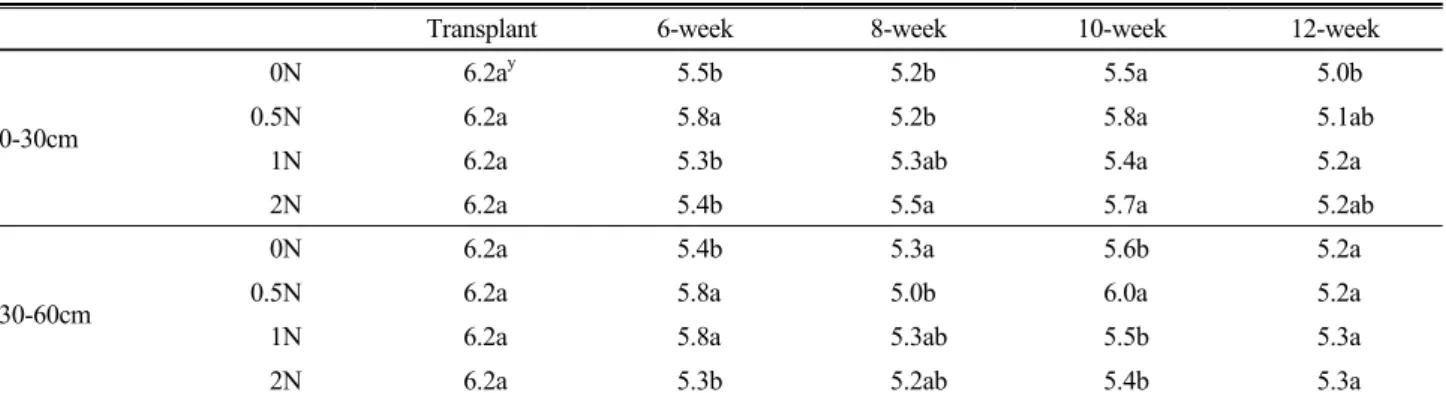
Table 5. Soil pH in plots with different levels of organic fertilizer for 12 weeks after transplanting.
Transplant 6-week 8-week 10-week 12-week
0-30cm
0N 6.2ay 5.5b 5.2b 5.5a 5.0b
0.5N 6.2a 5.8a 5.2b 5.8a 5.1ab
1N 6.2a 5.3b 5.3ab 5.4a 5.2a
2N 6.2a 5.4b 5.5a 5.7a 5.2ab
30-60cm
0N 6.2a 5.4b 5.3a 5.6b 5.2a
0.5N 6.2a 5.8a 5.0b 6.0a 5.2a
1N 6.2a 5.8a 5.3ab 5.5b 5.3a
2N 6.2a 5.3b 5.2ab 5.4b 5.3a
yThe same letters are not significantly different of DMRT 5% (p = 0.05).
Week
Week
Fig. 1. Soil EC in plots with different N levels from organic fertilizer for 12 weeks after transplanting. A corresponds to a depth of 0–30 cm and B, to a depth of 30-60 cm.
oval, with a leaf shape index of 0.8-0.9.
Changes in pH and EC In the presence of organic fertilizer, the pH of the soil decreased from 6.5 to 5 in the course of time, both at depths of 0-30 cm and 30-60 cm (Table 5). This was not dependent on the amount of organic fertilizer applied.
The soil EC at a depth of 0-30 cm decreased from 0.75 dS m
-1to 0.3 dS m
-1after treatment with organic fertilizer for 6 weeks. This decrease was independent of the N level from the fertilizer for the first 6 weeks. However, 12 weeks after treatment, the soil EC of the plot treated
with 0 N fertilizer had increased to 0.3 dS m
-1, while that of the 0.5 N fertilizer-treated plot was 0.4 dS m
-1. ECs of the plots treated with 1 N and 2 N fertilizers were 1 and 1.5 dS m
-1, respectively, and these measurements were lower than the initial EC of the soil (Fig. 1 A). The soil EC at the depth of 30-60 cm decreased until week 6.
However, the EC of the plot treated with 2 N fertilizer increased to 1.3 dS m
-1after 8 weeks, while the EC of the 1 N fertilizer-treated plot increased to 0.95 dS m
-1after 8 weeks (Fig. 1 B).
Change in N The soil nitrate content at 0-30 cm depth did not change after treatment with organic fertilizer for the first 6 weeks. However, after 6 weeks, the nitrate content in the plots treated with 2 N and 1 N fertilizers increased until week 12. The final concentrations of nitrate were 7.2 µmol g
-1FW and 6.1 µmol g
-1FW for the 2 N and 1 N fertilizer-treated plots, respectively.
There were no changes in the nitrate content in the plots treated with 0.5 N and 0 N fertilizers (Fig. 2A). The soil nitrate contents at 30-60 cm depth did not change for the first 8 weeks. This was observed in the plots treated with fertilizers of 0 N, 0.5 N, 1 N, and 2 N. However, between the end of week 8 and the end of week 10, the nitrate content increased, reaching 1.1 (0 N), 2.0 (0.5 N), 2.3 (1 N), and 2.9 (2 N) µmol·g
-1FW. The levels decreased between week 10 and week 12 (Fig. 2B).
The ammonia content at 0-30 cm depth in the plots
treated with 2 N and 1 N fertilizers increased to 525 and
500 nmol g
-1DW, respectively, over the first 6 weeks,
while there were no changes in the ammonia content in
the plots treated with 0.5 N and 0 N fertilizers during this
period. Between week 6 and week 12, the ammonia
content went down until they were as low as 10 % of the
initial level (Fig. 3A). The ammonia content at 30-60 cm
Week
Week
Fig. 2. Nitrate levels in plots with different N levels from organic fertilizer for 12 weeks after transplanting. A corres- ponds to a depth of 0-30 cm and B, to a depth of 30-60 cm.
Week
Week
Fig. 3. Ammonium levels in plots with different N levels from organic fertilizer for 12 weeks after transplanting. A corres- ponds to a depth of 0-30 cm and B, to a depth of 30-60 cm.
Week
Week
Fig. 4. Urea levels in plots with different N levels from organic fertilizer for 12 weeks after transplanting. A corres- ponds to a depth of 0-30 cm and B, to a depth of 30-60 cm
depth in the plots treated with 2 N and 1 N fertilizers increased to 620 and 551 nmol g
-1DW, respectively,
during the first 6 weeks, while there were no changes in the ammonia content in the plots treated with 0.5 N and 0 N fertilizers during this period. Between week 6 and week 12, the ammonia content decreased to only 10-20
% of the initial level (Fig. 3B).
The levels of urea at 0-30 cm depth increased gradually over the first 10 weeks. Between week 10 and week 12, they increased dramatically, except in the 0 N fertilizer-treated plot (Fig. 4A). At 30-60 cm depth, urea levels increased gradually over 10 weeks, while between week 10 and week 12, they increased dramatically even in the 0 N fertilizer-treated plot (Fig. 4B).
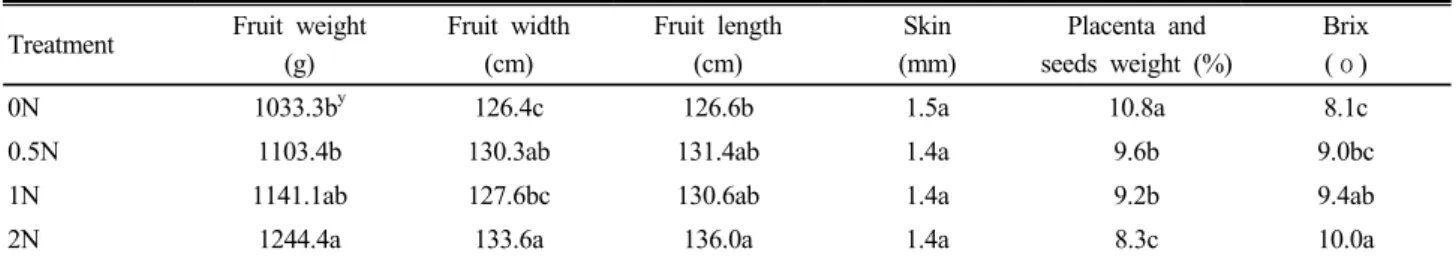
Fruit quality The fruit weight from the plots treated with 0.5 N, 1 N, and 2 N fertilizers increased by 7%, 10%, and 20%, respectively, as compared to that in the plot treated with 0 N fertilizer. The fruit width of fruits from the plots treated with 0.5N, 1 N, and 2 N fertilizers increased by 3%, 3%, and 7%, respectively, as compared to that of the fruits from unfertilized plots.
The fruit length of fruits from the plots treated with 0.5
N, 1 N, and 2 N plots increased by 4%, 3%, and 7%,
respectively, compared to the plots treated with 0 N
fertilizer. Organic fertilizer caused no changes in skin
Table 6. Melon quality as a function of the different levels of organic fertilizer.
Treatment Fruit weight (g)
Fruit width (cm)
Fruit length (cm)
Skin (mm)
Placenta and seeds weight (%)
Brix (o)
0N 1033.3by 126.4c 126.6b 1.5a 10.8a 8.1c
0.5N 1103.4b 130.3ab 131.4ab 1.4a 9.6b 9.0bc
1N 1141.1ab 127.6bc 130.6ab 1.4a 9.2b 9.4ab
2N 1244.4a 133.6a 136.0a 1.4a 8.3c 10.0a
yThe same letters are not significantly different of DMRT 5% (p = 0.05).