• 검색 결과가 없습니다.

Estimating the Amount of Nitrogen in Hairy Vetch on Paddy Fields using Unmaned Aerial Vehicle Imagery

N/A
N/A
Protected

Academic year: 2021

Share "Estimating the Amount of Nitrogen in Hairy Vetch on Paddy Fields using Unmaned Aerial Vehicle Imagery"

Copied!
7
0
0

로드 중.... (전체 텍스트 보기)

전체 글

(1)

Estimating the Amount of Nitrogen in Hairy Vetch on Paddy Fields using Unmaned Aerial Vehicle Imagery

Kyung-Do Lee, Sang-Il Na, Shin-Chul Baek, Ki-Do Park

1

, Jong-Seo Choi

1

, Suk-Jin Kim

1

, Hak-Jin Kim

2

, Hee-Sup Yun

2

, and Suk-Young Hong*

Climate Change and Agroecology Division, National Institute of Agricultural Science, RDA, Wanju 55365, Korea

1

Crop Cultivation and Environment Research Division, National Institute of Crop Science, RDA, Suwon 16616, Korea

2

Dept. of Biosystems and Biomaterals Engineering, College of Agriculture and Life Sciences, Seoul National University, Seoul, 08826, Korea

(Received: September 2 2015, Revised: October 12 2015, Accepted: October 12 2015)

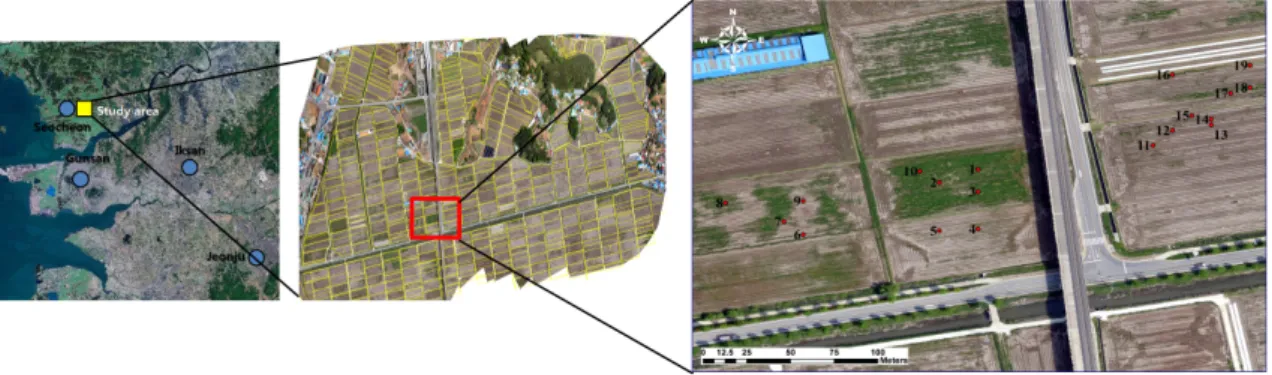
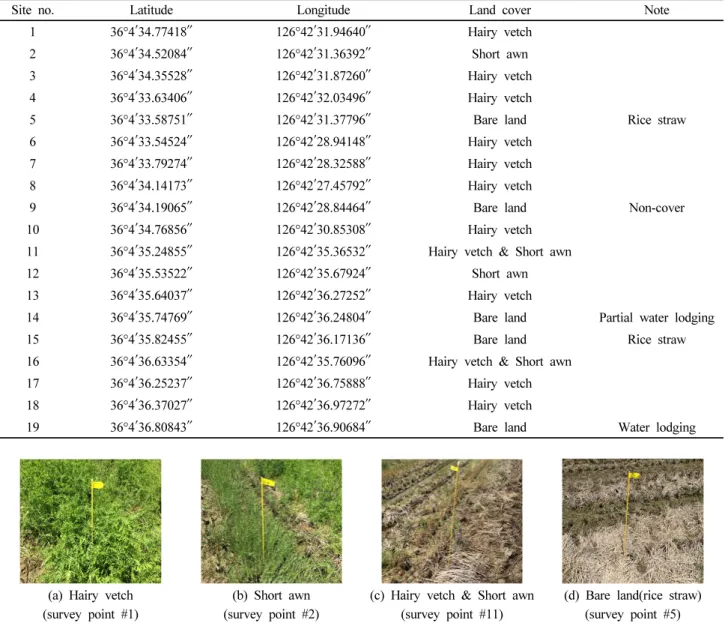
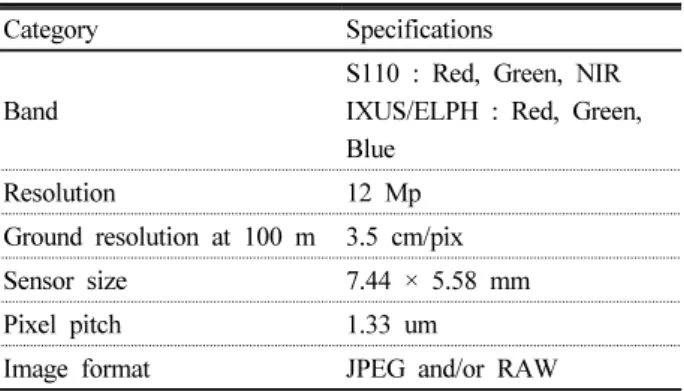
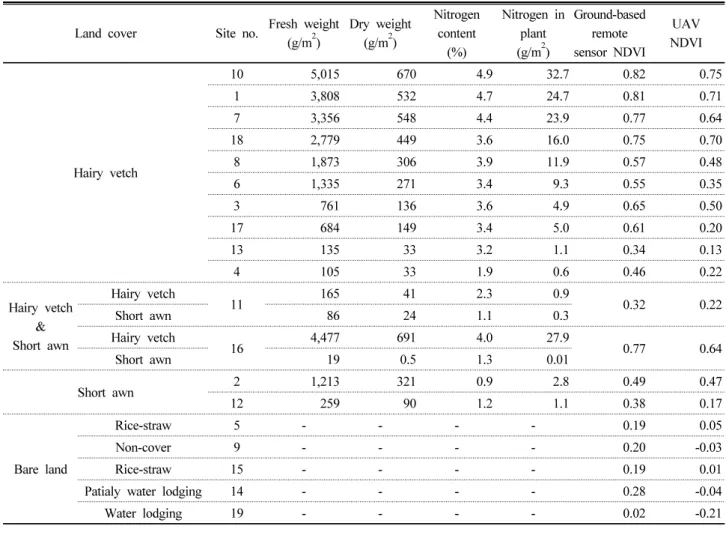
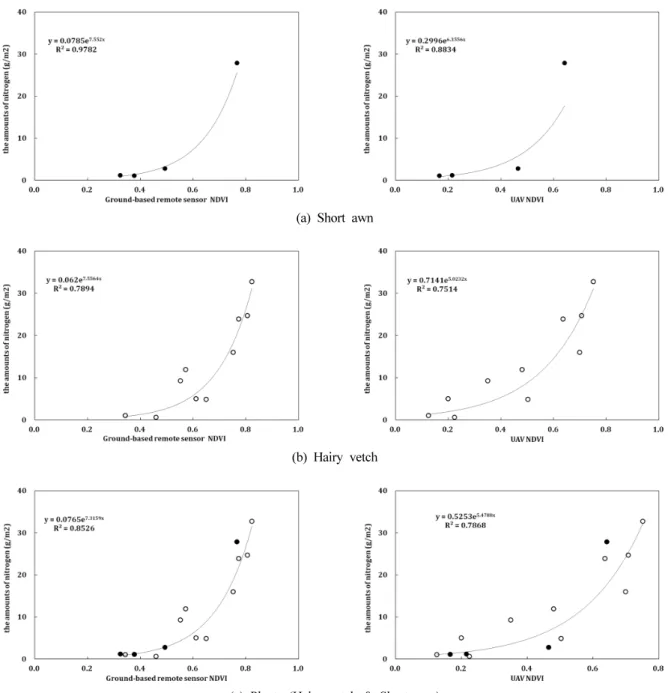
Remote sensing can be used to provide information about the monitoring of crop situation. This study was conducted to estimate the amount of nitrogen present in paddy fields by measuring the amount of nitrogen in hairy vetch using an UAV (Unmaned Aerial Vehicle). NDVIs (Normalized Difference Vegetation Index) were calculated using UAV images obtained from paddy fields in Seocheon on May 14 th 2015. There was strong relationship between UAV NDVI and the amount of nitrogen in hairy vetch (R 2 =0.79). Spatial distribution maps of green manure nitrogen were generated on each paddy field using the nitrogen-vegetation index relations to help farmers determine the amount of N fertilizers added to their rice fields after the application of green manure such as hairy vetch.

Key words: UAV, Green Manure, NDVI, Nitrogen

Mapping of the amount of nitrogen in hairy vetch on paddy fields using unmaned aerial vehicle imagery.

1)

*Corresponding author : Phone: +82632382510, Fax: +82632383823, E-mail: [email protected]

§

Acknowledgement : This study was conducted by support of NAAS research and development project (project number: PJ010897).

(2)

Fig. 1. Location of the study area and points of field survey in Seocheon paddy fields.

Introduction

녹비작물 (풋거름작물)은 푸를 때 베어 토양에 넣어주는 두과 (콩과), 화본과 등의 작물로서 (Park et al., 2008) 질 소공급, 잡초억제, 토양침식 경감, 토양 물리성 개선 등 양 분공급 및 토양개량 효과가 높아 친환경농업에 활용되고 있 다 (Jeon et al., 2008; Lee et al., 2002; Seo et al., 2000;

Seo and Lee, 2008). 그러나 풋거름을 통해 공급되는 질소 량은 추파시기, 파종량, 생육단계, 경운방법 및 배수관리 등 영농관리 방식과 기상 등의 재배환경 요인에 따라 변이가 커서 (Kim et al., 2002; Seo et al., 1998; Seo et al., 2000) 후작물의 합리적인 양분관리를 위해서는 풋거름 환원시기 에 정확한 질소 생산량 추정이 필요하다.

원격탐사는 전자기파를 감지하는 각종 센서 (인공위성, 항공기 등)를 이용하여 지표면, 물, 대기 현상에 대해 비접 촉· 비파괴적인 방법으로 필요한 정보를 얻어내는 과학 기 술로서 (Hong et al., 2010) 작물의 질소량 추정을 위해 많 은 연구가 수행되어 왔다 (Gong et al., 2011; Kang et al., 2009, 2010; Kim et al., 2005, 2006). 이는 식물체의 질소 량과 직접적인 비례관계에 있는 엽록소의 분광반사 특성이 주로 적색 (Red), 청색 (Blue) 파장은 흡수하는 반면 근적외 선 (NIR : Near Infra Red) 파장은 반사하는 현상에 기인한 것으로 이들 파장으로 조합한 식생지수 (Vegetation Index) 는 녹색 식물의 상대적 분포량과 생육특성을 평가하는 지표 로 사용되어 왔다 (Tomas and Gausman, 1977). 특히, 1974 년 Rouse 등이 개발한 정규화식생지수 (NDVI : Normalized Difference Vegetation Index)는 적색 파장과 근적외선 파 장의 반사율을 이용한 것으로 식생의 생체량, 엽록소 함량, 질소량 추정에 널리 활용되고 있다 (Cohen, 1991; Lyon et al., 1998; Richardson and Everitt, 1992).

국내에서도 Kim et al. (2005, 2006)은 식생지수를 활용 하여 벼 생육과 질소영양 상태를 진단한 결과 식생지수와 지상부 질소흡수량과는 고도로 유의한 상관관계를 보였으 며, 원격탐사 기법을 이용하여 산정한 식생지수로 벼의 목 표 수량과 단백질 함량을 조절하기 위한 수비 질소 사용량

을 결정할 수 있을 것으로 보고하였다. Kim & Hong (2008) 은 능동형 지상 광학센서를 통해 얻은 식생지수와 쌀 단백 질 함량이 높은 상관관계를 보여 식생지수를 통해 쌀 단백 질함량을 예측할 수 있을 것으로 보고하였다. Kang et at.

(2009, 2010)도 식생지수를 활용한 연초의 질소 영양상태 추정을 통해 변량시비가 가능할 것으로 보고하였으며, 지상 원격 측정센서 종류별로 산정한 식생지수와 벼의 생체량, 질소량을 비교한 결과 높은 정의 상관관계를 보여 이를 기 반으로 한 질소 비료량 결정도 가능할 것으로 보고하였다.

이들 연구는 필지 단위에서 식생지수를 활용한 작물의 질소 량 추정 및 조절 가능성을 확인시켜 준다는 데 의의가 있으 나, 이들 기술의 실용적 활용을 위해서는 대규모 면적에서 작물의 질소량을 신속히 파악하여 양분관리 계획 수립을 지 원할 수 있는 기술개발 연구가 필요하다.

1960년대부터 본격적으로 개발되기 시작된 무인비행체 (UAV : Unmaned Aerial Vehicle)는 그동안 군사적 목적으 로 주로 이용되어왔으나, 최근에는 국방 분야 뿐 아니라 공 간정보, 재난· 재해, 농업, 환경, 레저 등 다양한 분야에서 연구 및 활용되고 있다 (Choi et al., 2011). 무인비행체는 위 성, 유인항공기 등 기존 원격탐사 플랫폼에 비해서 촬영범 위는 좁지만 10 cm 안팎의 높은 해상도와 함께 사용자가 촬 영시기를 결정하여 영상자료를 수집할 수 있고, 영상의 가 격이 상대적으로 저렴하다는 장점이 있어 들녘단위 농경지 (100~1,000 ha)의 원격탐사자료 수집에 유용하다.

따라서 본 연구는 무인비행체를 이용하여 헤어리베치를 풋 거름으로 재배하는 단지를 촬영하고, 영상에서 추출한 식생지 수와 헤어리베치의 질소 생산량 비교를 통해 재배단지 내 질 소 생산량의 공간적 분포 특성을 추정하고자 수행하였다.

Materials and Methods

조사지역 및 조사지점 본 연구는 헤어리베치를 풋거

름으로 활용하여 벼 농사를 짓고 있는 충남 서천군 서천읍

화금리 논 (36°4′35″N, 126°42′33″E) 94.6 ha를 대상으로

수행하였다 (Fig. 1). 화금 친환경 벼 생산단지는 2009년부

(3)

Table 1. Location cordinates and land cover of each field survey point.

Site no. Latitude Longitude Land cover Note

1 36°4 ′34.77418″ 126°42 ′31.94640″ Hairy vetch

2 36°4 ′34.52084″ 126°42 ′31.36392″ Short awn

3 36°4 ′34.35528″ 126°42 ′31.87260″ Hairy vetch 4 36°4 ′33.63406″ 126°42 ′32.03496″ Hairy vetch

5 36°4 ′33.58751″ 126°42 ′31.37796″ Bare land Rice straw

6 36°4 ′33.54524″ 126°42 ′28.94148″ Hairy vetch 7 36°4 ′33.79274″ 126°42 ′28.32588″ Hairy vetch 8 36°4 ′34.14173″ 126°42 ′27.45792″ Hairy vetch

9 36°4 ′34.19065″ 126°42 ′28.84464″ Bare land Non-cover

10 36°4 ′34.76856″ 126°42 ′30.85308″ Hairy vetch 11 36°4 ′35.24855″ 126°42 ′35.36532″ Hairy vetch & Short awn

12 36°4 ′35.53522″ 126°42 ′35.67924″ Short awn

13 36°4 ′35.64037″ 126°42 ′36.27252″ Hairy vetch

14 36°4 ′35.74769″ 126°42 ′36.24804″ Bare land Partial water lodging

15 36°4 ′35.82455″ 126°42 ′36.17136″ Bare land Rice straw

16 36°4 ′36.63354″ 126°42 ′35.76096″ Hairy vetch & Short awn 17 36°4 ′36.25237″ 126°42 ′36.75888″ Hairy vetch 18 36°4 ′36.37027″ 126°42 ′36.97272″ Hairy vetch

19 36°4 ′36.80843″ 126°42 ′36.90684″ Bare land Water lodging

(a) Hairy vetch (survey point #1)

(b) Short awn (survey point #2)

(c) Hairy vetch & Short awn (survey point #11)

(d) Bare land(rice straw) (survey point #5) Fig. 2. Examples of land cover in filed survey points.

터 화학비료를 대체하여 풋거름작물인 헤어리베치를 재배 하여 벼 재배에 필요한 양분을 공급하여 왔으며 볏짚은 전 량환원하고 있다. 헤어리베치 품종은 호주에서 수입된 나모 이를 2014년 벼 수확 5~7일전인 10월 초순에 벼 입모상태 에서 살포기로 70 kg ha

-1

파종하였으며 벼 수확 후에는 볏 짚을 절단하여 피복하였다. 파종이후 배수 관리를 위한 배 수로 조성을 하지 않았으며 월동한 이후 헤어리베치의 토양 환원 약 2주전인 5월 14일에 질소생산량을 조사하였다.

무인비행체로 촬영되는 항공영상의 식생지수와 풋거름작 물의 질소량을 비교하기 위해 단지 내에서 토지피복 및 풋 거름작물의 무성도를 육안으로 판단하여 헤어리베치, 둑새 풀, 헤어리베치와 둑새풀 혼합지, 나지 4개 구역으로 구분 하여, 직경 1 m 이내에 토지피복이 균일한 지점 19개소를 선정하고 정밀 GNSS 측정장비 (FlexPak-G2-V2, Novatel Inc., Canada)를 이용하여 위치를 기록하였다 (Table 1, Fig.

2). 측정지점의 지상부 식생은 50 cm × 50 cm 격자 크기로 시료를 채취하여 생체중 및 건조중량을 측정하고, 건물은 CN분석기 (Vario MAX CN, Elementar Analysensysteme, Germany)를 이용하여 질소함량을 분석하였다. 식물체의 질 소량은 건중량과 질소함량을 곱하여 계산하였다.

무인비행체 영상 촬영 및 식생지수 산정 연구 대상

지역의 항공영상은 5월말 벼 기비 사용량 결정을 지원하기

위해 2015년 5월 14일 고정익 무인비행체 (Ebee, Sensefly,

Swiss)에 단지 전체의 풋거름작물 재배 현황을 육안으로 관

찰하기 위해 가시광선 영역인 Red, Green, Blue 파장 영역

의 카메라 (IXUS/ELPH, Cannon, Japan)와 식생지수 산정

을 위해 Red, Green, NIR 파장영역을 촬영할 수 있는 카메

라 (S110, Cannon, Japan)를 번갈아 탑재하여 촬영하였다

(Table 2, 3). 해상도는 4 cm로 하였으며 촬영고도는 카메라

(4)

Table 2. Specifications of UAV.

Category Specifications Model eBee Country Swiss

UAV type fixed-wing

Flight altitude 100 ~ 800 m Flight speed within 90 km/h

Size and weight size 96 cm, weight 700 g Maximum flight time 45 minutes

Nominal cruise speed 40~90 km/h (11~25 m/s) Radio linkrange Up to 3 km

Maximum coverage (single flight)

12 km

2

(at 974m altitude AGL) Wind resistance Up to 45 km/h (12 m/s) Ground Sampling

Distance(GSD) Down to 1.5 cm per pixel Relative orthomosaic /

3D model accuracy 1~3 × GSD Absolute horizontal /

vertical accuracy

w/GCPs : Down to 3 cm / 5 cm

No GCPs : 1~5 m Multi-drone operation Yes

Automatic 3D flight planning Yes

Linear landing accuracy Approx. 5 m Takeoff / landing auto/manual

Table 3. Specifications of S110, IXUS/ELPH digital camera.

Category Specifications

Band

S110 : Red, Green, NIR IXUS/ELPH : Red, Green, Blue

Resolution 12 Mp

Ground resolution at 100 m 3.5 cm/pix Sensor size 7.44 × 5.58 mm Pixel pitch 1.33 um

Image format JPEG and/or RAW

해상도 및 종류에 따라 지상에서 115~130 m의 범위를 보였 다. 낱장으로 촬영된 영상은 영상전처리 프로그램 (Emotion, Sensefly, Swiss)을 통해 촬영당시 비행체의 고도, 방향 등 위치정보와 결합한 후 파장영역별 영상 합성 및 반사율영상 을 산정해주는 프로그램 (Tera3D, Sensefly, Swiss)을 통해 단지 전체 영상 제작 및 반사율 영상을 제작하고 Leica사의 Erdas Imagine 및 ESRI사의 Arcgis Arcinfo 프로그램을 사 용하여 영상 기하보정 후 식생지수 (이하 NDVI)를 Eq. 1과 같이 계산하였다.

   









 



(Eq. 1)

여기서, ρ

NIR

은 근적외선밴드의 스펙트럼 반사율이며, ρ

RED

는 적색밴드의 스펙트럼 반사율이다. 무인비행체를 이용 한 식생지수 산정값과 비교하기 위하여 지상광학센서 (Ground- based remote sensor)인 CropCircle (Holland Scientific, USA)을 활용하여 조사지점의 NDVI 값을 측정하였다. 본 장 비의 원리는 RED 및 NIR 파장영역의 LED 광을 방사하여 지표면에서 반사되는 반사값을 NDVI로 산정하는 것이다.

측정은 식생 및 지표면에서 높이 50 cm로 하였고, 이때 관 측폭은 28 cm × 6 cm로 하였다.

풋거름 질소량 분포지도 작성 조사지점 식생 지상부 질소량과 무인비행체 영상으로 산정한 NDVI 값을 상호 비 교· 분석하고 회귀식을 구하였다. Leica사의 Erdas Imagine 및 ESRI사의 Arcgis Arcinfo 프로그램을 이용하여 작성된 회귀식을 반사율 영상에 적용하여 풋거름작물 질소량의 공 간분포도를 만들고 전자지적도를 중첩하여 필지별 풋거름 작물 질소량 분포지도를 제작하였다.

Results and Discussion

조사지점 풋거름 질소량 및 식생지수 관계 조사지

점의 토지피복별 식물체 생중량, 건중량, 질소량 및 원격탐 사 플랫폼별 NDVI는 Table 4와 같았다. 헤어리베치의 질소 함량은 1.9~4.9%의 값을 보였는데, 생중량 및 건중량이 클 수록 질소함량도 증가하는 경향을 보였다. 건중량과 질소함 량을 곱해 구한 식물체 질소량도 0.6~32.7 g/m

2

의 범위에 서 식물체의 생· 건중량이 클수록 증가하는 경향을 보였다.

둑새풀의 질소 함량은 0.9~1.3%, 식물체 질소량은 1.1~2.8 g/m

2

의 값을 나타내어 헤어리베치 보다 낮은 값을 보였다.

토지피복에 따른 원격탐사 플랫폼별 NDVI는 지상광학센서

인 Cropcircle의 경우 (이하 지상광학센서 NDVI, Ground-

based remote sensor NDVI) 헤어리베치 0.34~0.82, 둑새

풀 0.38~0.49, 헤어리베치와 둑새풀 혼재 지점 0.32~0.77,

나지 0.02~0.28의 값을 보여 식생으로 피복된 지점의 값이

높았으며 식물체의 질소량이 높을수록 증가하는 경향을 보

였다. 나지의 경우 물로 담수된 지점에서 더 낮은 값을 보였

는데 이는 물이 NIR 영역의 파장을 잘 흡수하는 특성에 기

인한 것으로 판단되었다. 무인비행체 영상으로 산정한 NDVI

의 경우 (이하 무인비행체 NDVI, UAV NDVI) 헤어리베치

0.13~0.75, 둑새풀 0.17~0.47, 헤어리베치와 둑새풀 혼재

지점 0.22~0.64, 나지 –0.21~0.05의 값을 보여 지상광학센

서 NDVI와 유사한 경향을 보였으나, 측정값 범위에서는 약

간씩 낮은 경향을 보여 측정일 조사지점의 식생과 비식생을

(5)

Table 4. Plant weight, nitrogen and NDVI in field survey points.

Land cover Site no. Fresh weight (g/m

2

)

Dry weight (g/m

2

)

Nitrogen content

(%)

Nitrogen in plant (g/m

2

)

Ground-based remote sensor NDVI

UAV NDVI

Hairy vetch

10 5,015 670 4.9 32.7 0.82 0.75

1 3,808 532 4.7 24.7 0.81 0.71

7 3,356 548 4.4 23.9 0.77 0.64

18 2,779 449 3.6 16.0 0.75 0.70

8 1,873 306 3.9 11.9 0.57 0.48

6 1,335 271 3.4 9.3 0.55 0.35

3 761 136 3.6 4.9 0.65 0.50

17 684 149 3.4 5.0 0.61 0.20

13 135 33 3.2 1.1 0.34 0.13

4 105 33 1.9 0.6 0.46 0.22

Hairy vetch

&

Short awn

Hairy vetch

11 165 41 2.3 0.9

0.32 0.22

Short awn 86 24 1.1 0.3

Hairy vetch

16 4,477 691 4.0 27.9

0.77 0.64

Short awn 19 0.5 1.3 0.01

Short awn 2 1,213 321 0.9 2.8 0.49 0.47

12 259 90 1.2 1.1 0.38 0.17

Bare land

Rice-straw 5 - - - - 0.19 0.05

Non-cover 9 - - - - 0.20 -0.03

Rice-straw 15 - - - - 0.19 0.01

Patialy water lodging 14 - - - - 0.28 -0.04

Water lodging 19 - - - - 0.02 -0.21

Fig. 3. Relationship between UAV NDVI and Ground-based remote sensor NDVI.

구분할 경우 지상광학센서 NDVI 값으로 0.3 내외, 무인비 행체 NDVI의 경우 0.1 내외가 기준이 될 것으로 추정되었다.

지상광학센서 NDVI와 무인비행체 NDVI의 관계는 Fig. 3 에서와 같이 상관계수 0.95의 높은 상관관계를 보였다. 지 상광학센서 NDVI가 무인비행체 NDVI에 비해 높은 경향을 보였는데, 이러한 경향은 NDVI 값이 낮은 영역에서 더 뚜렷 하게 나타났다 (Swain et al., 2010).

식생지수와 식물체 질소량의 상호관계를 확인한 결과

(Fig. 4), 지상광학센서 NDVI와 무인비행체 NDVI 모두 식 물체 질소량과 결정계수 0.79 이상의 양호한 관계를 보였 다. 지상광학센서 NDVI가 무인비행체 NDVI에 비해 더 높 은 상관관계를 보였는데, 이는 센서의 파장영역, 반응감도 등에 따른 기기 특성과 기상 등 촬영환경의 차이 때문인 것 으로 판단되었다 (Swain et al., 2010). 둑새풀과 헤어리베 치 모두 NDVI와 질소량 관계가 유사한 경향을 보여 식생의 구분 없이 NDVI를 기준으로 식물체의 질소량 관계를 해석 하는 것도 가능할 것으로 판단되었다.

풋거름 질소량 분포지도 작성 무인비행체 영상으로

제작한 NDVI 분포지도는 Fig. 5과 같다. 대체적으로 논의

NDVI가 일부 필지를 제외하고는 낮은 경향을 보였는데, 이

는 ‘14년 가을 풋거름작물 파종기에 잦은 강우로 인해 헤어

리베치의 발아 및 생육이 저조하였기 때문이었다. 무인비행

체로 식생을 구분할 수 있는 기준으로 판단한 NDVI 값 0.1

이상에 대하여 무인비행체 NDVI와 풋거름작물 질소량 회귀

식을 적용하고 필지별 질소량으로 계산하여 지도로 제작한

것은 Fig. 6과 같았다. 분석대상 231개 필지 94.6 ha의 논

중에서 풋거름의 질소량이 3 kg/10a 이상인 것은 14개 필지

5.9 ha로 대부분의 필지들에서 풋거름 질소량이 낮아 이를

(6)

(a) Short awn

(b) Hairy vetch

(c) Plants (Hairy vetch & Short awn)

Fig. 4. Relationship between the amounts of nitrogen in plant and NDVI of UAV and ground-based remote sensor.

Fig. 5. Mapping of NDVI on paddy fields using unmaned aerial vehicle imagery.

Fig. 6. Mapping of the amount of nitrogen in green manure on

paddy fields using unmaned aerial vehicle imagery.

(7)

고려한 합리적인 벼 양분관리 노력이 필요할 것으로 판단되 었다.

Conclusion

대규모 면적으로 재배되는 풋거름작물의 질소량을 신속 히 추정하고자 ‘15년 5월 14일 서천 헤어리베치 재배단지를 무인비행체로 촬영하고 토지피복별 NDVI 및 풋거름을 포함 한 식생의 질소량을 분석하여 비교하였다. 무인비행체 NDVI 와 식물체 질소량은 결정계수 0.79의 양호한 상관관계를 보 여 영상에서 추출한 식생지수와 풋거름 질소량을 비교하여 풋거름 질소량의 공간적 분포를 추정하고, 필지별 질소량을 계산하였다. 이처럼 무인비행체를 활용하면 풋거름작물 환 원시기 신속하게 풋거름작물의 질소량을 추정할 수 있어 작 물의 합리적인 양분관리 계획 수립에 도움을 줄 수 있을 것 으로 판단되었다.

References

Choi K.A., J.H. Lee, and I.P. Lee. 2011. Development of a close-range real-time aerial monitoring system based on a low altitude unmaned air vehicle. Korean Soc. Geo-Spatial Information System. 19(4):21-31.

Cohen, W.B. 1991. Response of vegetation indices to change in three measures of leaf water stress. Photogramm. Eng.

Remote Sensing 57(2):195-202.

Gong, H.Y., S.S. Kang, and S.D. Hong. 2011. Estimating of nitrogen uptake and biomass of rice ( Oryza Sativa L.) using ground-based remote sensing techniques. Korean J. Soil Sci.

Fert. 44(5):779-787.

Hong, S.Y., Y.H. Kim, E.Y. Choe, Y.S. Zhang, Y.K. Sonn, and C.W. Park, K.H. Jung, B.K. Hyun, S.K. Ha and K.C.

Song. 2010. Geographic Information System and Remote Sensing in Soil Science. Korean J. Soil Sci. Fert. 43(5):

684-695.

Jeon, W.T., M.T. Kim, K.Y. Seong, J.K. Lee, I.S. Oh, and S.T. Park. 2008. Changes of soil properties and temperature by green manure under rice-based cropping system. Korean J. Crop Sci. 53(4):413-416.

Kang, S.S., H.C. Jung, S.H. Jeon, and S.D. Hong. 2009.

Evaluation of biomasss and nitrogen nutrition of tobacco under sand culture by reflectance indices of ground-based remote sensors. Korean J. Soil Sci. Fert. 42(2):70-78.

Kang, S.S., H.Y. Gong, H.C. Jung, Y.H. Kim, S.Y. Hong, and S.D. Hong. 2010. Evaluation of biomasss and nitrogen

status in paddy rice using ground-based remote sensors.

Korean J. Soil Sci. Fert. 43(6):954-961.

Kim, C.G., J.H. Seo, H.S. Cho, S.H. Choi, and S.J. Kim.

2002. Effect of hairy vetch as green manure on rice cultivation. Korean J. Soil Sci. Fert. 35(3):169-174.

Kim, M.H., J.C. Shin, and B.W. Lee. 2005. Applicability of vegetation index and SPAD reading to nondestructive diagnosis of rice growth and nitrogen nutrition status.

Korean J. Crop Sci. 50(6):369-377.

Kim, M.H., J.D. Fu, and B.W. Lee. 2006. Determining nitrogen topdressing rate at panicle initiation stage of rice based on vegetation index and SPAD reading. Korean J. Crop Sci.

51(5):386-395.

Kim, Y.H and S.Y. Hong. 2008. Estimation of rice grain protein contents using ground optical remote sensors.

Korea. J. Remote Sensing. 24(6):551-558.

Lee, H.J., J.S. Lee, and J.H. Seo. 2002. Decomposition and N release of hairy vetch applied as a green manure and its effects on rice yield in paddy field. Korean J. Crop Sci.

47:137-141.

Lyon, J.G., D. Yuan, R.S. Lunetta, and C.D. Elvidge. 1998.

A change detection experiment using vegetation indices.

Photogramm. Eng. Remote Sensing 64(2):143-150.

Park, S.T., W.T. Jeon, M.T. Kim, K.Y. Sung, J.H. Ku, I.S.

Oh, B.K. Lee, Y.H. Yoon, J.K. Lee, K.H. Lee, and J.H.

Yu. 2008. Understanding of environmental friendly agriculture and rice production using green manure crops. RDA, NICS.

Sammi. Suwon. pp.20-21.

Richardson, A.J. and J.H. Everitt. 1992. Using spectral vege- tation indices to estimate rangeland productivity. Geocarto Int. 1:63-77.

Seo, J.H., H.J. Lee, S.J. Kim, and I.B. Hur. 1998. Nitrogen release from hariy vetch( Vicia villosa Roth) residue in relation to different tillages and plant growth stage. Korean J. Soil Sci. Fert. 31(2):137-142.

Seo, J.H., H.J. Lee, and S.J. Kim. 2000. Change of green manure and nitrogen yield of hairy vetch according to seeding date in autumn. Korean J. Crop Sci. 45:400-404.

Seo, J.H. and H.J. Lee. 2008. Mineral nitrogen effects of hairy vetch (Vicia villosa Roth) on Maize (Zea mays L.) by green manure amounts. J. Agron. 7:272-276.

Swain, K.C., S.J. Thomson, and H.P.W. Jayasuriya. 2010.

Adoption of an unmanned helicopter forlow-altitude remote sensing to estimate yield and total biomass of a rice crop.

Am. Soc. Agric. Biol. Eng. 53(1):21-27.

Tomas, J.R. and H.W. Gausman. 1977. Leat reflectance vs.

leaf chlorophyll and carotenoid concentrations for eight

crops. Agron. J. 69:799-802.

수치

Fig. 1. Location of the study area and points of field survey in Seocheon paddy fields.Introduction녹비작물 (풋거름작물)은 푸를 때 베어 토양에 넣어주는 두과 (콩과), 화본과 등의 작물로서 (Park et al., 2008) 질소공급, 잡초억제, 토양침식 경감, 토양 물리성 개선 등 양분공급 및 토양개량 효과가 높아 친환경농업에 활용되고 있다 (Jeon et al., 2008
Table 1.  Location cordinates and land cover of each field survey point.
Table 3. Specifications of S110, IXUS/ELPH digital camera.
Table 4. Plant weight, nitrogen and NDVI in field survey points.
+2

참조

관련 문서

Distribution of Cd in stream sediments, paddy soils, rice stalks and grains from the Kubong

The purpose of this research was to suggest the water quality improvement in streams by evaluating the distribution characteristics of organics and ammonia nitrogen

Influence of time and rate of nitrogen application on production and botanical composition of forage.. Sudangrass and sorghum-sudangrass hybrids

High level of nitrogen fertilizer application increased the nitrogen contents in all the parts of citrus trees.. But there was no change in sugar and

A laboratory experiment was performed to investigate the removal of nitrogen and phosphorus from plating factory effluent using the soil column.. Soil,

In an effort to develop a new method to remove nitrogen, this study examined the effects of C/N ratio, carbon source and nitrogen concentration on

Among these, research about unmanned aerial vehicle to perform the mission on behalf of the human has been developed in environment at difficult to reach

▪ Analyze velocity profile of plane and round jets using geometric similarity.. ▪ Determine the amount of fluid