녹비작물 및 Charcoal 처리가 생강 생육 및 토양 특성에 미치는 영향*
1)
양홍석**․김동진**․안병구***․이진호****
Impacts of Green Manure Crop and Charcoal Applications on Ginger Growth and Soil Properties
Yang, Hong-Seok․Kim, Dong-Jin․Ahn, Byung-Koo․Lee, Jin-Ho
This study was conducted to investigate ginger growth and its nutrient uptake depending on changes of soil properties as affected by applications of green manure crop and/or charcoal in continuous cropping system. The green manure crops applied were barley and hairy vetch, and charcoal was additionally treated in selected plots as a soil conditioner. Experimental plots were prepared as Plot 1 (control), Plot 2 (barley of 8kg 10a-1), Plot 3 (hairy vetch of 12kg 10a-1), Plot 4 (charcoal of 1,000kg 10a-1 and barley 8kg 10a-1), and Plot 5 (charcoal of 1,000kg 10a-1 and hairy vetch of 12kg 10a-1) with two different soil conditions (high clay content, HCC and low clay content, LCC). When comparing selected chemical properties of soils before and after cultivating ginger plant, soil pH decreased from 6.9~8.1 to 6.8~7.6, and electrical conductivity (EC) also declined from 0.45~1.25 dS m-1 to 0.30~0.61 dS m-1. However, the content of soil organic matter (SOM) and total nitrogen (T-N) increased. Thus, the soil chemical properties were improved with the applications of green manures and charcoal. Also, macro- and micro-nutrient contents of ginger plants in the different plots were various between normal and diseased plants grown in soils with HCC and LCC. In particular, the concentration of manganese (Mn) was 3~4 folds higher in the diseased plant than in the normal plants. Ginger growth status and yield was relatively improved with the applica- tions of green manures and charcoal as comparing with control plot. Especially in the Plot 4 with LCC, the ginger plant was not infected by root-rot disease.
Key words : charcoal, ginger, green manure crop, plant nutrient, soil property
*본 연구는 농촌진흥청 공동연구사업(과제번호 : PJ007358)의 연구비지원에 의하여 수행되었음.
**전북대학교 대학원 농화학과
***전라북도농업기술원 기후변화대응과
**** Corresponding author, 전북대학교 생물환경화학과([email protected])
Ⅰ. 서 론
생강(ginger, Zingiber officinale Roscoe)은 전북 완주, 충남 서산, 태안 등이 주요 생산지로 서 환금작물로 재배되고 있다(Lee and Lee, 1998). 그러나, 생강을 연작 재배하거나 다른 작 물과 윤작 할 경우 생산량이 감소하며, 뿌리썩음병은 세계적으로 생강의 생산량을 감소시 키는 주요 원인이 되고 있다(Dohroo, 2005; Lee et al., 1981). 이러한 뿌리썩음병은 주로 화 학적 방제에 의존하고 있으나 생강의 특성상 약제가 토양에 도달하기가 매우 어려워 방제 효과가 매우 낮은 실정이다. 또한, 화학적 방제는 병원균이 약제 내성을 얻게 되면 방제효 과가 떨어지게 되고, 토양오염의 원인이 되거나 수확 후 농약 잔류 등으로 품질 저하가 우 려되기도 한다(Lee et al., 1999). 그리고, 화학비료나 가축분뇨 등 과도한 비료자원의 투입 은 토양 염류집적, 양분간 불균형 심화, 연작장해 발생 등 여러 문제점이 발생되어 작물수 량 감소의 원인이 되고 있다(Lim et al., 2007; Lim et al., 2012b; Yang et al., 2011). 따라서, 최근에는 토양의 질을 개선하기 위하여 화학비료 사용을 줄이고 친환경농자재를 사용하는 친환경 유기농업의 중요성이 증대되고 있다(Choi et al., 2010b; Lim et al., 2012a). 이러한 측 면에서 화학비료의 사용량을 줄이고 토양비옥도를 높이는 동시에 화학적 방제에 의존하지 않고 작물의 품질 및 안전성을 향상 시킬 수 있는 대안의 필요성이 강조되고 있는데, 최근 그 대안으로 토양에 유기물 시용이 대두되고 있으며, 유기물 공급 방법으로는 부산물비료 시용, 농업부산물 시용, 녹비작물 재배 후 환원 등이 사용되고 있다(Cho et al., 2011; Choi et al., 2010a; Jeon et al., 2009). 그 중 녹비작물 재배 후 토양에 환원하게 되면 토양 비옥도 및 건전성을 개선시키거나 용적밀도, 토양입단, 투수성 등의 물리성이 향상되어 토양 유실 경감 효과가 있어(Bronick and Lai, 2005; Fred and Harold, 2000) 화학비료 절감, 잡초방제, 경관 조성 등의 다양한 이점이 발생하게 된다. 대표적인 녹비작물로는 녹비보리, 헤어리베 치, 자운영, 클로버 등이 있으며(Kim et al., 2002), 화본과 녹비작물은 생육이 빨라 생체수량 이 많은 반면 질소함량이 낮고 C/N율이 높아 토양의 물리 ․ 화학적 특성의 개량 효과가 우 수하며, 두과 녹비작물은 초기 생육이 늦어 생체수량이 적은 반면 공중질소 고정으로 질소 함량이 높고 C/N율이 낮아 양분공급 효과가 뛰어난 것으로 알려져 있다(Cho et al., 2011).
녹비보리는 화본과 녹비작물로서 질소함량은 1.69~1.98%으로 C/N율은 출수기에 가장 낮았 으며 출수기 이후 황숙기로 갈수록 급격히 증가하는 경향을 보였다(MFAFF, 2009). 또한, 녹비보리를 토양에 환원하면 녹비호밀보다 양분의 공급 및 분해가 빠르고 내한성이 강하 며(Cho et al., 2011; Yang et al., 2009), 보릿짚을 16년 동안 농경지에 시용한 결과, 무시용에 비하여 토양 공극률이 1.3%, 토양유기물 함량이 36% 증가되었으며, 쌀 수량도 6% 증가된 것으로 보고된바 있다(Cho et al., 2011; Kim et al., 2006). 헤어리베치는 두과 녹비작물로 내 한성과 월동력이 강하고 낮은 온도에서도 질소고정능력이 높아(Power and Zachariassen, 1993) 3.6~4.1%의 질소성분을 함유하고 있을 뿐만 아니라 전 생육기간 동안 일정한 양을
유지하고 있어(Cho et al., 2011; Lee et al., 2009; Smith et al., 1987), 후작물의 질소공급을 위 한 녹비작물로 각광 받고 있다. 헤어리베치 15~20ton ha-1를 이앙 2~3주전에 논토양에 환원 하고 벼를 재배하면 6%의 증수효과가 있는 것으로 보고된바 있다(Cho et al., 2011). 또한, 토양개량제로서 charcoal을 사용하는데, 친환경농자재로서 charcoal은 토양의 투수성, 통기 성, 보수성 등과 같은 토양 물리성 개선의 역할을 할 뿐만 아니라 토양 pH를 증가시켜 토 양산성화를 방지하고, 칼륨(potassium, K), 칼슘(calcium, Ca), 마그네슘(magnesium, Mg) 등의 양이온 함량을 증가시키고 양이온치환용량(cation exchange capacity, CEC)을 향상시키는 등 의 다양한 효과가 있는 것으로 알려져 있다(Oguntunde et al., 2004). 따라서 본 연구에서는 생강재배 시 생강 생육조건을 개선하기 위하여 친환경농자재로서 녹비보리, 헤어리베치, charcoal을 이용하였으며, 그 처리에 따라 토양특성 변화, 양분흡수 특성, 생강생육 특성을 조사하였다.
Ⅱ. 재료 및 방법
1. 생강재배 및 처리본 연구에서는 전라북도 익산시 왕궁면에 위치한 생강연작 재배지를 선정하여 생강재배 시험을 수행하였으며, 재배지는 점토함량 차이에 따라 LLC(low clay content)와 HCC(high clay content)로 구분하였다. 그리고, 모든 처리구에는 2,400kg 10a-1의 가축분부산물비료를 시비하였으며, 처리에 따라 Plot 1(control), Plot 2(녹비보리 8kg 10a-1), Plot 3(헤어리베치 12 kg 10a-1), Plot 4(녹비보리 8kg + charcoal 1,000kg 10a-1), Plot 5(헤어리베치 12kg + charcoal 1,000kg 10a-1)로 설정하였다. 시험 재배지 내의 각 plot 면적은 15m2(3×5m), 각 plot 사이의 간격은 60cm로 하였고, 생강 종강은 2주간 발아 시킨 후 5월 중순에 파종하여 11월 초에 수확하였다.
2. 토양 분석
토양시료는 시험 전과 생강 수확 후에 각 plot에서 10개 지점을 선정하여 zigzag 형태로 채취 후 잘 혼합하였고, 그 토양시료는 풍건 쇄토하여 2.0mm 토양체에 통과시킨 후 분석에 사용하였다. 토양특성 중 토성은 Gee and Bauder(1986)의 피펫침강법에 준하여 분석하였으 며, 토양의 화학적 특성은 농촌진흥청 국립농업과학원의 토양화학분석법(NAAS, 2010b)에 준하여 실시하였다. 토양의 pH와 전기전도도(electrical conductivity, EC)는 토양과 증류수를 1:5(w/v) 비율로 혼합 진탕하여 각각 pH meter(Orion 3 star, Thermo Scientific, USA)와 EC
meter(Orion star A215, Thermo Scientific, USA)를 이용하여 측정하였다. 토양유기물(soil organic matter, SOM) 함량은 Tyurin’s법을 이용하였고, 전질소(total nitrogen, T-N) 함량은 Kjeldahl equipment(Vapodest 10s, Gerhardt, German)를 이용한 Kjeldahl 증류법을 적용하였으 며, 유효인산(available phosphorus, avail. P) 함량은 Lancaster법으로 발색 후 UV/Vis Spectro- photometer(DU 720, Beckman Coulter, USA)를 이용하여 720nm 파장에서 측정하였다. 치환 성양이온(exchangeable cation)은 1.0N CH3COONH4(pH 7.0)으로 추출하여 Inductively Cou- pled Plasma Optical Emission Spectrometry(ICP-OES, Optima 7300DV, Perkin Elmer, USA)로 측정하였다.
3. 식물체 분석
생강 작물체 분석을 위하여 수확기에 수확한 작물체를 증류수로 깨끗이 세척하고 지상 부와 지하부로 구분하여 80℃에서 72시간 건조 후 분쇄하여 분석용 시료로 사용하였다. 식 물체 분석은 NIAST(2000)의 식물체 분석법에 준하였으며, 식물체 중 질소(nitrogen, N) 함량 은 Conc. H2SO4로 습식분해 후 Kjeldahl 증류법(Vapodest 10s, Gerhardt, German)을 이용하였 고, 식물체 중 인(phosphorus, P)과 양이온 분석은 HNO3-H2O2 습식분해 전처리하였다. 전처 리 후 P는 Ammonium Vanadate법으로 발색하여 UV/Vis Spectrophotometer(DU 720, Beckman Coulter, USA)로 측정하였으며, 양이온은 Inductively Coupled Plasma Optical Emission Spec- trometry(ICP-OES, Optima 7300DV, Perkin Elmer, USA)를 이용하여 측정 후 정량하였다.
4. 생강 생산량 및 병발생률 조사
생강의 전체 수확량에서 병이 확인되지 않은 정상근을 생강의 생산량으로 하였으며, 병 이 확인된 이병근을 전체 수확량 중 백분율로 환산하여 병발생률(%)을 산출하였다.
병발생률(%) = 이병근
× 100 전체 수확량
5. 통계처리
분석 자료의 통계분석은 SPSS(statistical package for the social sciences, ver. 18.0)를 사용하 였으며, 처리구간 양분함량의 유의성을 알아보고자 Duncan’s Multiple Range Test를 실행하 였고, 생강의 정상근과 이병근의 양분함량 차이 및 점토함량 차이에 따른 양분함량 차이의 유의성을 알아보고자 T-test를 실행하였다.
Ⅲ. 결과 및 고찰
1. 생강 재배지 토양의 특성 변화1) 시험 전 토양의 특성
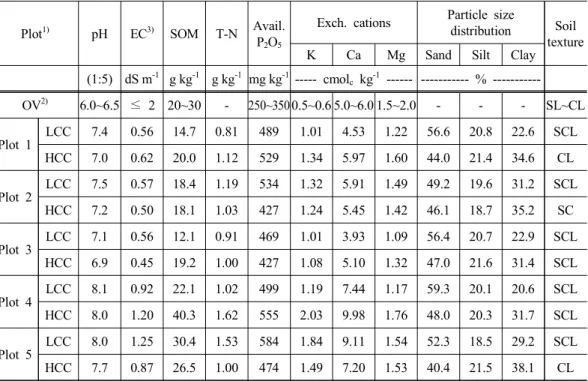
국립농업과학원(NAAS, 2010a)에서 권장하는 생강 토양특성 기준을 살펴보면, 토양 pH 6.0~6.5, 전기전도도(electrical conductivity, EC) 2dS m-1 이하, 토양유기물(soil organic matter, SOM) 함량 20~30g kg-1, 유효인산(available phosphorus, avail. P2O5) 함량 250~350mg kg-1, 치 환성칼륨(exch. K) 0.5~0.6cmolc kg-1, 치환성칼슘(exch. Ca) 5.0~6.0cmolc kg-1, 치환성마그네 슘(exch. Mg) 1.5~2.0cmolc kg-1, 토성 사양토~식양토로 나타나있다(Table 1). 시험 전 토양의 물리화학적 특성은 Table 1에 나타내었으며, Plot 별로 토양특성의 차이를 보였다. 토양 pH 는 6.9~8.1이었으며 권장기준보다 높게 나타났다. EC는 0.45~1.25dS m-1로 나타나 적정 기준
Table 1. Selected physical and chemical properties of soils used in this study
Plot1) pH EC3) SOM T-N Avail.
P2O5
Exch. cations Particle size
distribution Soil texture
K Ca Mg Sand Silt Clay
(1:5) dS m-1 g kg-1 g kg-1 mg kg-1 --- cmolc kg-1 --- --- % ---
OV2) 6.0~6.5 ≤ 2 20~30 - 250~350 0.5~0.6 5.0~6.0 1.5~2.0 - - - SL~CL
Plot 1
LCC 7.4 0.56 14.7 0.81 489 1.01 4.53 1.22 56.6 20.8 22.6 SCL
HCC 7.0 0.62 20.0 1.12 529 1.34 5.97 1.60 44.0 21.4 34.6 CL
Plot 2
LCC 7.5 0.57 18.4 1.19 534 1.32 5.91 1.49 49.2 19.6 31.2 SCL
HCC 7.2 0.50 18.1 1.03 427 1.24 5.45 1.42 46.1 18.7 35.2 SC
Plot 3
LCC 7.1 0.56 12.1 0.91 469 1.01 3.93 1.09 56.4 20.7 22.9 SCL
HCC 6.9 0.45 19.2 1.00 427 1.08 5.10 1.32 47.0 21.6 31.4 SCL
Plot 4
LCC 8.1 0.92 22.1 1.02 499 1.19 7.44 1.17 59.3 20.1 20.6 SCL
HCC 8.0 1.20 40.3 1.62 555 2.03 9.98 1.76 48.0 20.3 31.7 SCL
Plot 5
LCC 8.0 1.25 30.4 1.53 584 1.84 9.11 1.54 52.3 18.5 29.2 SCL
HCC 7.7 0.87 26.5 1.00 474 1.49 7.20 1.53 40.4 21.5 38.1 CL
1)Plot 1, control; Plot 2, barley treated; Plot 3, hairy vetch treated; Plot 4, charcoal and barley treated; Plot 5, charcoal and hairy vetch treated; LCC, low clay content; HCC, high clay content.
2)OV, optimal value (NAAS, 2010a).
3)EC, electrical conductivity; SOM, soil organic matter; T-N, total-nitrogen.
4)SL, CL, SCL, and SC are indicated sandy loam, clay loam, sandy clay loam, and sandy clay in soil texture, respectively.
이었으며, SOM 함량은 12.1~40.3g kg-1로 나타나 plot 간 큰 차이를 보였고, 총질소(total- nitrogen, T-N) 함량은 0.81~1.62g kg-1의 분포를 나타내었다. 유효인산 함량은 427~584mg kg-1로서 권장기준 보다 높은 수치를 보였다. Exch. K 함량은 1.01~2.03cmolc kg-1로서 권장 기준보다 높았고, exch. Ca 함량은 3.93~9.98cmolc kg-1로서 plot 간 큰 차이를 보였으며, exch. Mg 함량은 1.09~1.76cmolc kg-1로서 권장기준보다 약간 부족하거나 적정기준이었다.
토성(soil texture)은 사질식양토(sandy clay loam, SCL), 식양토(clay loam, CL), 사질식토(sandy clay, SC)의 분포로서 권장 토성을 나타내었다.
2) 생강 수확 후 토양의 특성 변화
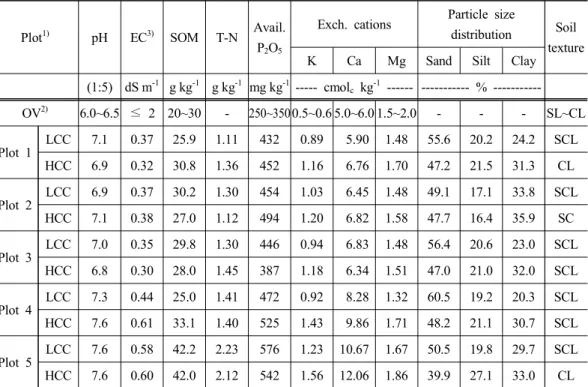
생강 수확 후 토양의 물리화학적 특성은 Table 2와 같고, 토양의 물리적 특성 중 토성은 사질식양토, 식양토, 사질식토로 나타나 시험전과 차이가 없었다. 생강 수확 후 토양의 화 학적 특성 변화를 살펴보면, 시험 전 토양 pH는 6.9~8.1, 수확 후 토양 pH는 6.8~7.6로서 생 강 수확 후 각 처리구별로 약간 감소하였으며, Van Breemen et al.(1983)은 토양 pH 감소 원 인으로 토양 중 식물의 뿌리나 미생물의 호흡으로 생성되는 CO2, 식물 뿌리가 방출하는 유 기산, 그리고 식물의 양이온(Ca, Mg, K 등) 흡수 등을 기술하였는데, 본 연구에서도 생강 생육과 관련하여 토양 pH가 감소한 것으로 판단된다. EC는 시험 전 토양(0.45~1.25dS m-1) 과 수확 후 토양(0.30~0.61dS m-1)을 비교할 때 Plot 3(헤어리베치)-HCC(high clay content)를 제외한 모든 처리구에서 감소한 것으로 나타났다. 이는 양분 및 이온이 생강 흡수 또는 용 탈되어 발생한 것으로 생각된다. 토양유기물 함량은 시험 전 토양(12.1~40.3g kg-1)에 비하 여 수확 후 토양(25.0~42.2g kg-1)에서 약간의 증가를 보였는데, 이는 퇴비 시용, 녹비작물 환원, charcoal 시용에 기인한 것으로 보인다. 총질소 함량은 시험 전 토양에서 0.81~1.62g kg-1, 수확 후 토양에서 1.11~2.23g kg-1로서 모든 처리구에서 증가하였으나, 수확 후 토양의 유효인산 함량은 Plot 2(녹비보리)-HCC와 Plot 5(헤어리베치+charcoal)-HCC를 제외한 처리 구에서 약간 감소하였다. 치환성칼륨 함량은 시험 전 토양에 비하여 수확 후 Plot 3(헤어리 베치)-HCC와 Plot 5(헤어리베치+charcoal)-HCC를 제외한 처리구에서 감소하였다. 수확 후 생강 중 칼륨 함량이 높았는데, 생강의 높은 칼륨 흡수로 인하여 수확 후 토양의 치환성칼 륨 함량이 감소한 것으로 보인다. 치환성칼슘 함량은 수확 후 Plot 4(녹비보리+charcoal)- HCC를 제외한 모든 처리구에서 증가하였으며, 치환성마그네슘 함량은 수확 후 Plot 2(녹비 보리)-LCC(low clay content)와 Plot 4(녹비보리+charcoal)-HCC를 제외한 처리구에서 약간 증 가하였다.
Table 2. Physical and chemical properties of soils after harvesting ginger
Plot1) pH EC3) SOM T-N Avail.
P2O5
Exch. cations Particle size
distribution Soil texture
K Ca Mg Sand Silt Clay
(1:5) dS m-1 g kg-1 g kg-1 mg kg-1 --- cmolc kg-1 --- --- % ---
OV2) 6.0~6.5 ≤ 2 20~30 - 250~350 0.5~0.6 5.0~6.0 1.5~2.0 - - - SL~CL
Plot 1
LCC 7.1 0.37 25.9 1.11 432 0.89 5.90 1.48 55.6 20.2 24.2 SCL
HCC 6.9 0.32 30.8 1.36 452 1.16 6.76 1.70 47.2 21.5 31.3 CL
Plot 2
LCC 6.9 0.37 30.2 1.30 454 1.03 6.45 1.48 49.1 17.1 33.8 SCL
HCC 7.1 0.38 27.0 1.12 494 1.20 6.82 1.58 47.7 16.4 35.9 SC
Plot 3
LCC 7.0 0.35 29.8 1.30 446 0.94 6.83 1.48 56.4 20.6 23.0 SCL
HCC 6.8 0.30 28.0 1.45 387 1.18 6.34 1.51 47.0 21.0 32.0 SCL
Plot 4
LCC 7.3 0.44 25.0 1.41 472 0.92 8.28 1.32 60.5 19.2 20.3 SCL
HCC 7.6 0.61 33.1 1.40 525 1.43 9.86 1.71 48.2 21.1 30.7 SCL
Plot 5
LCC 7.6 0.58 42.2 2.23 576 1.23 10.67 1.67 50.5 19.8 29.7 SCL
HCC 7.6 0.60 42.0 2.12 542 1.56 12.06 1.86 39.9 27.1 33.0 CL
1)Plot 1, control; Plot 2, barley treated; Plot 3, hairy vetch treated; Plot 4, charcoal and barley treated; Plot 5, charcoal and hairy vetch treated; LCC, low clay content; HCC, high clay content.
2)OV, optimal value (NAAS, 2010a).
3)EC, electrical conductivity; SOM, soil organic matter; T-N, total-nitrogen.
4)SL, CL, SCL, and SC are indicated sandy loam, clay loam, sandy clay loam, and sandy clay in soil texture, respectively.
2. 생강의 양분흡수 특성
1) 생강 지하부의 양분흡수 특성
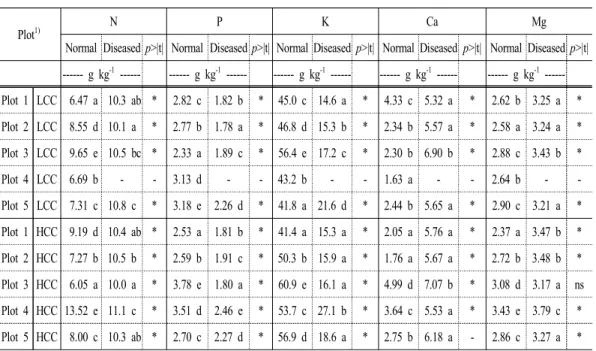
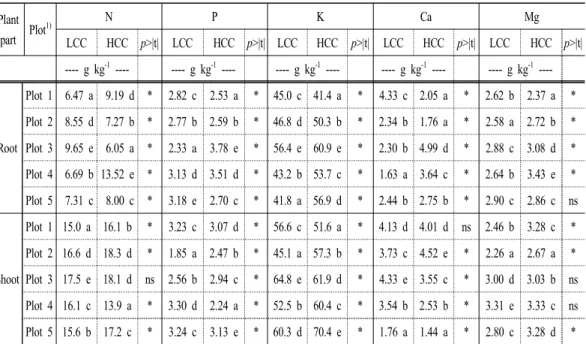
생강 지하부의 양분 흡수 특성은 다량원소와 미량원소로 구분하여 살펴보았다. 그 중 다 량원소의 경우(Table 3), LCC(low clay content)-정상근(normal ginger)에서 질소(nitrogen, N) 는 Plot 3(헤어리베치)이 9.65g kg-1로서 가장 높았고, 인(phosphorus, P)은 Plot 5(헤어리베치 +charcoal)에서 3.18g kg-1로서 가장 높았다. 칼륨(potassium, K)은 Plot 3(헤어리베치, 56.4g kg-1)에서, 칼슘(calcium, Ca)은 Plot 1(control, 4.33g kg-1)에서, 마그네슘(magnesium, Mg)은 Plot 3과 Plot 5에서 높게 나타났다. HCC(high clay content)-정상근(normal ginger)에서는 N은 Plot 4(13.52g kg-1), P는 Plot 3(3.78g kg-1), K는 Plot 5(60.9g kg-1), Ca는 Plot 3(4.99g kg-1), Mg 는 Plot 4(3.43g kg-1)에서 높은 함량을 보였다. 정상근과 이병근의 다량원소 흡수량에 대한 차이를 조사한 결과, Plot 3-HCC의 Mg을 제외하고는 모두 유의적 차이가 있는 것으로 나타
났고, N, Ca, Mg는 이병근에서 그 함량이 높은 반면, P, K는 정상근에서 그 함량이 높게 나 타났다.
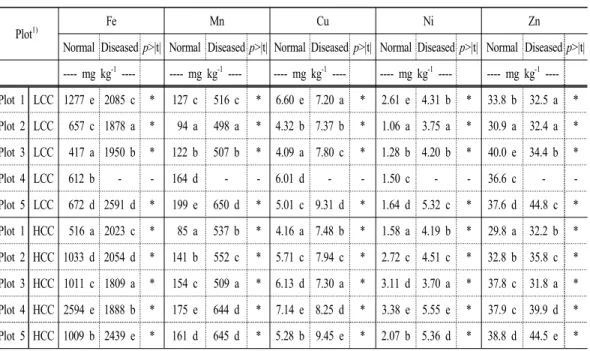
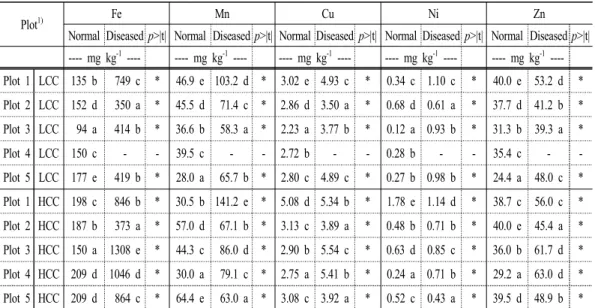
미량원소의 경우(Table 4), LCC-정상근에서 철(iron, Fe)은 Plot 1(1277mg kg-1), 망간(man- ganese, Mn)은 Plot 5(199mg kg-1), 구리(copper, Cu)는 Plot 1(6.60mg kg-1), 니켈(nickel, Ni)은 Plot 1(2.61mg kg-1), 아연(zinc, Zn)은 Plot 3(40.0mg kg-1)에서 높은 함량을 보였다. HCC-정상 근에서는 Fe는 Plot 4(2594mg kg-1), Mn은 Plot 4(175mg kg-1), Cu는 Plot 4(7.14mg kg-1), Ni은 Plot 4(3.38mg kg-1), Zn은 Plot 5(38.8mg kg-1)에서 높게 나타났다. 정상근과 이병근의 미량원 소 흡수량에 대한 차이를 조사한 결과 모든 처리구에서 유의성이 있는 것으로 나타났고, Fe, Mn, Cu, Ni. Zn는 대체적으로 이병근에서 그 함량이 높은 것으로 나타났다. 특히, Mn의 경우, 이병근에서 3~4배 정도 높은 것으로 나타났는데, 망간(Mn)은 식물 뿌리에 대한 독성 작용으로 뿌리를 갈변시키고 균열을 일으키는 것으로 보고된바 있으며(Foy et al., 1995; Le Bot et al., 1990), 뿌리썩음병의 발생으로 Mn이 작용하여 이병근의 Mn 함량이 높은 것으로 보인다.
Table 3. Contents of macro-nutrients in roots of ginger plant Plot1)
N P K Ca Mg
Normal Diseased p>|t| Normal Diseased p>|t| Normal Diseased p>|t| Normal Diseased p>|t| Normal Diseased p>|t|
--- g kg-1 --- --- g kg-1 --- --- g kg-1 --- --- g kg-1 --- --- g kg-1 --- Plot 1 LCC 6.47 a 10.3 ab * 2.82 c 1.82 b * 45.0 c 14.6 a * 4.33 c 5.32 a * 2.62 b 3.25 a * Plot 2 LCC 8.55 d 10.1 a * 2.77 b 1.78 a * 46.8 d 15.3 b * 2.34 b 5.57 a * 2.58 a 3.24 a * Plot 3 LCC 9.65 e 10.5 bc * 2.33 a 1.89 c * 56.4 e 17.2 c * 2.30 b 6.90 b * 2.88 c 3.43 b *
Plot 4 LCC 6.69 b - - 3.13 d - - 43.2 b - - 1.63 a - - 2.64 b - -
Plot 5 LCC 7.31 c 10.8 c * 3.18 e 2.26 d * 41.8 a 21.6 d * 2.44 b 5.65 a * 2.90 c 3.21 a * Plot 1 HCC 9.19 d 10.4 ab * 2.53 a 1.81 b * 41.4 a 15.3 a * 2.05 a 5.76 a * 2.37 a 3.47 b * Plot 2 HCC 7.27 b 10.5 b * 2.59 b 1.91 c * 50.3 b 15.9 a * 1.76 a 5.67 a * 2.72 b 3.48 b * Plot 3 HCC 6.05 a 10.0 a * 3.78 e 1.80 a * 60.9 e 16.1 a * 4.99 d 7.07 b * 3.08 d 3.17 a ns Plot 4 HCC 13.52 e 11.1 c * 3.51 d 2.46 e * 53.7 c 27.1 b * 3.64 c 5.53 a * 3.43 e 3.79 c * Plot 5 HCC 8.00 c 10.3 ab * 2.70 c 2.27 d * 56.9 d 18.6 a * 2.75 b 6.18 a - 2.86 c 3.27 a *
1)Plot 1, control; Plot 2, barley treated; Plot 3, hairy vetch treated; Plot 4, charcoal and barley treated; Plot 5, charcoal and hairy vetch treated; LCC, low clay content; HCC, high clay content.
2)*=significant at p<0.05 t-test; ns=not significant at t-test.
3)Plot 4-LC is a plot of 100 percentage of normal condition.
Table 4. Contents of selected micro-nutrients in roots of ginger plant Plot1)
Fe Mn Cu Ni Zn
Normal Diseased p>|t| Normal Diseased p>|t| Normal Diseased p>|t| Normal Diseased p>|t| Normal Diseased p>|t|
---- mg kg-1 ---- ---- mg kg-1 ---- ---- mg kg-1 ---- ---- mg kg-1 ---- ---- mg kg-1 ---- Plot 1 LCC 1277 e 2085 c * 127 c 516 c * 6.60 e 7.20 a * 2.61 e 4.31 b * 33.8 b 32.5 a * Plot 2 LCC 657 c 1878 a * 94 a 498 a * 4.32 b 7.37 b * 1.06 a 3.75 a * 30.9 a 32.4 a * Plot 3 LCC 417 a 1950 b * 122 b 507 b * 4.09 a 7.80 c * 1.28 b 4.20 b * 40.0 e 34.4 b *
Plot 4 LCC 612 b - - 164 d - - 6.01 d - - 1.50 c - - 36.6 c - -
Plot 5 LCC 672 d 2591 d * 199 e 650 d * 5.01 c 9.31 d * 1.64 d 5.32 c * 37.6 d 44.8 c * Plot 1 HCC 516 a 2023 c * 85 a 537 b * 4.16 a 7.48 b * 1.58 a 4.19 b * 29.8 a 32.2 b * Plot 2 HCC 1033 d 2054 d * 141 b 552 c * 5.71 c 7.94 c * 2.72 c 4.51 c * 32.8 b 35.8 c * Plot 3 HCC 1011 c 1809 a * 154 c 509 a * 6.13 d 7.30 a * 3.11 d 3.70 a * 37.8 c 31.8 a * Plot 4 HCC 2594 e 1888 b * 175 e 644 d * 7.14 e 8.25 d * 3.38 e 5.55 e * 37.9 c 39.9 d * Plot 5 HCC 1009 b 2439 e * 161 d 645 d * 5.28 b 9.45 e * 2.07 b 5.36 d * 38.8 d 44.5 e *
1)Plot 1, control; Plot 2, barley treated; Plot 3, hairy vetch treated; Plot 4, charcoal and barley treated; Plot 5, charcoal and hairy vetch treated; LCC, low clay content; HCC, high clay content.
2)*=significant at p<0.05 t-test; ns=not significant at t-test.
3)Plot 4-LC is a plot of 100 percentage of normal condition.
2) 생강 지상부의 양분흡수 특성
생강 지상부의 양분흡수 특성을 다량원소와 미량원소로 구분하여 살펴보면, 다량원소의 경우(Table 5), LCC-정상근에서 N은 Plot 3(17.5g kg-1), P는 Plot 4(3.30g kg-1), K는 Plot 3 (64.8g kg-1), Ca는 Plot 3(4.33g kg-1), Mg는 Plot 4(3.31g kg-1)에서 높게 나타났고, HCC-정상 근에서 N은 Plot 2와 Plot 3, P는 Plot 5(3.13g kg-1), K는 Plot 5(70.4g kg-1), Ca는 Plot 2(4.52g kg-1), Mg는 Plot 1, 4, 5에서 높은 함량을 보였다. 정상근과 이병근의 다량원소 흡수량에 대 한 차이를 조사한 결과, Plot 5-LC와 Plot 3-LC를 제외하고 모든 처리구에서 유의적 차이가 있는 것으로 나타났다. N과 P는 대체적으로 정상근이 이병근보다 높은 함량을 보였으나, K, Ca, Mg는 처리구별로 다소 차이가 있었다.
미량원소의 경우(Table 6), LCC-정상근에서 Fe는 Plot 5(177mg kg-1), Mn은 Plot 1(46.9mg kg-1), Cu는 Plot 1(3.02mg kg-1), Ni는 Plot 2(0.68mg kg-1), Zn은 Plot 1(40.0mg kg-1)에서 높은 함량을 보였다. HCC-정상근에서 Fe는 Plot 4와 Plot 5, Mn은 Plot 5(64.4mg kg-1), Cu는 Plot 1(5.08mg kg-1), Ni는 Plot 1(1.78mg kg-1), Zn은 Plot 2(40.0mg kg-1)에서 높게 나타났다. 정상 근과 이병근의 미량원소 흡수량에 대한 차이를 조사한 결과, 모든 처리구에서 유의성을 보 였고, Fe, Mn, Cu, Zn은 이병근에서 그 함량이 높았으며, Ni은 처리구간 차이가 있었다.
Table 5. Contents of macro-nutrients in shoots of ginger plant
Plot1) N P K Ca Mg
Normal Diseased p>|t| Normal Diseased p>|t| Normal Diseased p>|t| Normal Diseased p>|t| Normal Diseased p>|t|
---- g kg-1 ---- ---- g kg-1 ---- ---- g kg-1 ---- ---- g kg-1 ---- ---- g kg-1 ---- Plot 1 LCC 15.0 a 13.1 a * 3.23 c 2.78 c * 56.6 c 38.4 a * 4.13 d 4.35 b * 2.46 b 3.01 d * Plot 2 LCC 16.6 d 13.8 b * 1.85 a 2.27 b * 45.1 a 50.7 bc * 3.73 c 3.22 a * 2.26 a 2.54 b * Plot 3 LCC 17.5 e 14.3 c * 2.56 b 1.87 a * 64.8 e 52.1 c * 4.33 e 3.95 b ns 3.00 d 2.47 a *
Plot 4 LCC 16.1 c - - 3.30 d - - 52.5 b - - 3.54 b - - 3.31 e - -
Plot 5 LCC 15.6 b 15.5 d ns 3.24 c 3.13 d * 60.3 d 48.7 b * 1.76 a 5.36 c * 2.80 c 2.97 c * Plot 1 HCC 16.1 b 13.6 b * 3.07 d 2.49 c * 51.6 a 43.0 c * 4.01 d 7.46 e * 3.28 c 3.23 e * Plot 2 HCC 18.3 d 13.8 b * 2.47 b 2.66 e * 57.3 b 49.8 d * 4.52 e 3.10 a * 2.67 a 2.49 b * Plot 3 HCC 18.1 d 11.5 a * 2.94 c 2.40 b * 61.9 d 31.4 b * 3.55 c 6.18 c * 3.03 b 2.90 d * Plot 4 HCC 13.9 a 11.2 a * 2.24 a 2.57 d * 60.4 c 31.6 b * 2.53 b 6.63 d * 3.33 c 2.72 c * Plot 5 HCC 17.2 c 11.3 a * 3.13 e 2.13 a * 70.4 e 24.8 a * 1.44 a 4.50 b * 3.28 c 2.44 a *
1)Plot 1, control; Plot 2, barley treated; Plot 3, hairy vetch treated; Plot 4, charcoal and barley treated; Plot 5, charcoal and hairy vetch treated; LCC, low clay content; HCC, high clay content.
2)*=significant at p<0.05 t-test; ns=not significant at t-test.
3)Plot 4-LC is a plot of 100 percentage of normal condition.
Table 6. Contents of selected micro-nutrients in shoots of ginger plant
Plot1) Fe Mn Cu Ni Zn
Normal Diseased p>|t| Normal Diseased p>|t| Normal Diseased p>|t| Normal Diseased p>|t| Normal Diseased p>|t|
---- mg kg-1 ---- ---- mg kg-1 ---- ---- mg kg-1 ---- ---- mg kg-1 ---- ---- mg kg-1 ---- Plot 1 LCC 135 b 749 c * 46.9 e 103.2 d * 3.02 e 4.93 c * 0.34 c 1.10 c * 40.0 e 53.2 d * Plot 2 LCC 152 d 350 a * 45.5 d 71.4 c * 2.86 d 3.50 a * 0.68 d 0.61 a * 37.7 d 41.2 b * Plot 3 LCC 94 a 414 b * 36.6 b 58.3 a * 2.23 a 3.77 b * 0.12 a 0.93 b * 31.3 b 39.3 a *
Plot 4 LCC 150 c - - 39.5 c - - 2.72 b - - 0.28 b - - 35.4 c - -
Plot 5 LCC 177 e 419 b * 28.0 a 65.7 b * 2.80 c 4.89 c * 0.27 b 0.98 b * 24.4 a 48.0 c * Plot 1 HCC 198 c 846 b * 30.5 b 141.2 e * 5.08 d 5.34 b * 1.78 e 1.14 d * 38.7 c 56.0 c * Plot 2 HCC 187 b 373 a * 57.0 d 67.1 b * 3.13 c 3.89 a * 0.48 b 0.71 b * 40.0 e 45.4 a * Plot 3 HCC 150 a 1308 e * 44.3 c 86.0 d * 2.90 b 5.54 c * 0.63 d 0.85 c * 36.0 b 61.7 d * Plot 4 HCC 209 d 1046 d * 30.0 a 79.1 c * 2.75 a 5.41 b * 0.24 a 0.71 b * 29.2 a 63.0 d * Plot 5 HCC 209 d 864 c * 64.4 e 63.0 a * 3.08 c 3.92 a * 0.52 c 0.43 a * 39.5 d 48.9 b *
1)Plot 1, control; Plot 2, barley treated; Plot 3, hairy vetch treated; Plot 4, charcoal and barley treated; Plot 5, charcoal and hairy vetch treated; LCC, low clay content; HCC, high clay content.
2)*=significant at p<0.05 t-test; ns=not significant at t-test.
3)Plot 4-LC is a plot of 100 percentage of normal condition.
3) 점토함량별 양분흡수 특성
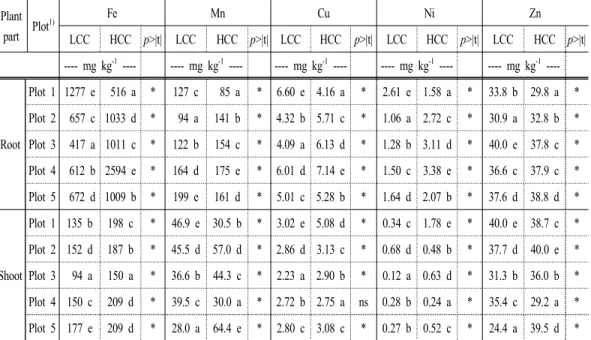
정상근 지하부에서 다량원소 함량을 점토함량 별로 차이를 조사한 결과(Table 7), N, P, K, Ca, Mg는 대체적으로 토양의 점토함량에 따라 생강 지하부 내 양분 함량이 유의적 차이 가 있는 것으로 나타났고, Plot 5의 Mg은 유의성이 없는 것으로 나타났다. 그러나, 처리구 별로 양분 함량의 차이가 나타났다. 정상근 지상부의 다량원소 함량을 점토함량 별로 비교 하였을 때(Table 7), 대부분의 처리구에서 토양의 점토함량이 높을수록 다량원소 함량도 높 았으며, Plot 3의 N, Plot 1의 Ca, Plot 3과 Plot 4의 Mg는 유의적 차이가 없는 것으로 나타났 다. Plot 1은 P, K, Plot 3은 K, Ca, Plot 4는 N, P, Ca, Plot 5는 P, Ca에서 점토함량이 낮은 토양에서 그 함량이 낮게 나타났다. 정상근의 지하부와 지상부에서 미량원소 함량을 점토 함량 별로 차이를 조사한 결과, 지상부 Plot 4의 Cu를 제외한 모든 처리구에서 유의성 있는 차이가 나타났다. 토양의 점토함량이 높을수록 식물체 중 미량원소의 함량이 대체적으로 높게 나타났으나, Root-Plot 1의 Fe, Mn, Cu, Ni, Zn, Root-Plot 3의 Zn, Root-Plot 5의 Mn, Shoot-Plot 1의 Mn, Zn, Shoot-Plot 2의 Ni, Shoot-Plot 4의 Mn, Ni, Zn 등과 같이 점토함량이 적은 토양에서 지상부와 지하부 별 특정 원소의 흡수량이 높게 나타났다.
Table 7. Contents of macro-nutrients in normal ginger plants grown in soils with different clay contents
Plant part Plot1)
N P K Ca Mg
LCC HCC p>|t| LCC HCC p>|t| LCC HCC p>|t| LCC HCC p>|t| LCC HCC p>|t|
---- g kg-1 ---- ---- g kg-1 ---- ---- g kg-1 ---- ---- g kg-1 ---- ---- g kg-1 ----
Root
Plot 1 6.47 a 9.19 d * 2.82 c 2.53 a * 45.0 c 41.4 a * 4.33 c 2.05 a * 2.62 b 2.37 a * Plot 2 8.55 d 7.27 b * 2.77 b 2.59 b * 46.8 d 50.3 b * 2.34 b 1.76 a * 2.58 a 2.72 b * Plot 3 9.65 e 6.05 a * 2.33 a 3.78 e * 56.4 e 60.9 e * 2.30 b 4.99 d * 2.88 c 3.08 d * Plot 4 6.69 b 13.52 e * 3.13 d 3.51 d * 43.2 b 53.7 c * 1.63 a 3.64 c * 2.64 b 3.43 e * Plot 5 7.31 c 8.00 c * 3.18 e 2.70 c * 41.8 a 56.9 d * 2.44 b 2.75 b * 2.90 c 2.86 c ns
Shoot
Plot 1 15.0 a 16.1 b * 3.23 c 3.07 d * 56.6 c 51.6 a * 4.13 d 4.01 d ns 2.46 b 3.28 c * Plot 2 16.6 d 18.3 d * 1.85 a 2.47 b * 45.1 a 57.3 b * 3.73 c 4.52 e * 2.26 a 2.67 a * Plot 3 17.5 e 18.1 d ns 2.56 b 2.94 c * 64.8 e 61.9 d * 4.33 e 3.55 c * 3.00 d 3.03 b ns Plot 4 16.1 c 13.9 a * 3.30 d 2.24 a * 52.5 b 60.4 c * 3.54 b 2.53 b * 3.31 e 3.33 c ns Plot 5 15.6 b 17.2 c * 3.24 c 3.13 e * 60.3 d 70.4 e * 1.76 a 1.44 a * 2.80 c 3.28 d *
1)Plot 1, control; Plot 2, barley treated; Plot 3, hairy vetch treated; Plot 4, charcoal and barley treated; Plot 5, charcoal and hairy vetch treated; LCC, low clay content; HCC, high clay content.
2)*=significant at p<0.05 t-test; ns=not significant at t-test.
3)Plot 4-LC is a plot of 100 percentage of normal condition.
Table 8. Contents of selected micro-nutrients in normal ginger plants grown in soils with different clay contents
Plant part Plot1)
Fe Mn Cu Ni Zn
LCC HCC p>|t| LCC HCC p>|t| LCC HCC p>|t| LCC HCC p>|t| LCC HCC p>|t|
---- mg kg-1 ---- ---- mg kg-1 ---- ---- mg kg-1 ---- ---- mg kg-1 ---- ---- mg kg-1 ----
Root
Plot 1 1277 e 516 a * 127 c 85 a * 6.60 e 4.16 a * 2.61 e 1.58 a * 33.8 b 29.8 a * Plot 2 657 c 1033 d * 94 a 141 b * 4.32 b 5.71 c * 1.06 a 2.72 c * 30.9 a 32.8 b * Plot 3 417 a 1011 c * 122 b 154 c * 4.09 a 6.13 d * 1.28 b 3.11 d * 40.0 e 37.8 c * Plot 4 612 b 2594 e * 164 d 175 e * 6.01 d 7.14 e * 1.50 c 3.38 e * 36.6 c 37.9 c * Plot 5 672 d 1009 b * 199 e 161 d * 5.01 c 5.28 b * 1.64 d 2.07 b * 37.6 d 38.8 d *
Shoot
Plot 1 135 b 198 c * 46.9 e 30.5 b * 3.02 e 5.08 d * 0.34 c 1.78 e * 40.0 e 38.7 c * Plot 2 152 d 187 b * 45.5 d 57.0 d * 2.86 d 3.13 c * 0.68 d 0.48 b * 37.7 d 40.0 e * Plot 3 94 a 150 a * 36.6 b 44.3 c * 2.23 a 2.90 b * 0.12 a 0.63 d * 31.3 b 36.0 b * Plot 4 150 c 209 d * 39.5 c 30.0 a * 2.72 b 2.75 a ns 0.28 b 0.24 a * 35.4 c 29.2 a * Plot 5 177 e 209 d * 28.0 a 64.4 e * 2.80 c 3.08 c * 0.27 b 0.52 c * 24.4 a 39.5 d *
1)Plot 1, control; Plot 2, barley treated; Plot 3, hairy vetch treated; Plot 4, charcoal and barley treated; Plot 5, charcoal and hairy vetch treated; LCC, low clay content; HCC, high clay content.
2)*=significant at p<0.05 t-test; ns=not significant at t-test.
3)Plot 4-LC is a plot of 100 percentage of normal condition.
3. 생강생육 및 생산량
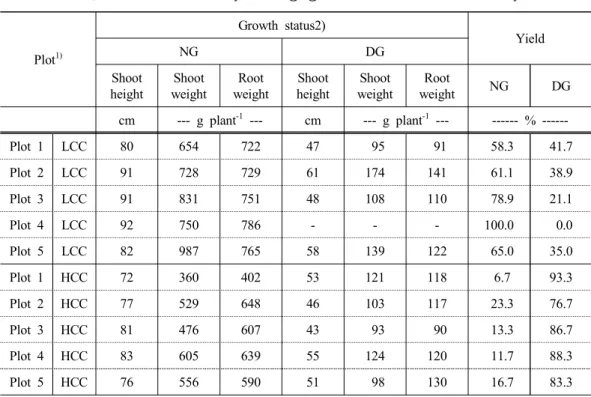
생강연작 재배지에서 생산된 생강의 생육상태 및 생산량은 Table 9와 같다. 점토함량이 상대적으로 낮은 토양(LCC, low clay content)에서 정상 생육된 생강의 지상부 길이는 80~
92cm, 생체 지상부 무게는 654~987g plant-1, 생체 지하부 무게는 722~786g plant-1이고, 이병 생강의 지상부 길이는 47~61cm, 생체 지상부 무게는 95~174g plant-1, 생체 지하부 무게는 91~140.75g plant-1이었다. 점토함량이 상대적으로 높은 토양(HCC, high clay content)에서 정 상 생육된 생강의 지상부 길이는 72~83cm, 생체 지상부 무게는 360~605g plant-1, 생체 지하 부 무게는 402~648g plant-1이고, 이병 생강의 지상부 길이는 43~55cm, 생체 지상부 무게는 93~124g plant-1, 생체 지하부 무게는 90~130g plant-1으로 나타났다. 뿌리썩음병의 발생으로 생강의 생육이 저하되는 것을 알 수 있다. Plot 4(헤어리베치+charcoal)에서 정상근 생산량은 100%로서 가장 높은 생산량을 보였고, 점토함량에 차이에 따른 생산량을 살펴보면, LCC는 58.3~100%, HCC는 6.7~23.3으로서 점토함량에 따른 토성 차이에 따라 생강의 생산량에 큰 차이가 나타났다.
Table 9. Growth status and yield of ginger on continuous cultivation system
Plot1)
Growth status2)
Yield
NG DG
Shoot height
Shoot weight
Root weight
Shoot height
Shoot weight
Root
weight NG DG
cm --- g plant-1 --- cm --- g plant-1 --- --- % ---
Plot 1 LCC 80 654 722 47 95 91 58.3 41.7
Plot 2 LCC 91 728 729 61 174 141 61.1 38.9
Plot 3 LCC 91 831 751 48 108 110 78.9 21.1
Plot 4 LCC 92 750 786 - - - 100.0 0.0
Plot 5 LCC 82 987 765 58 139 122 65.0 35.0
Plot 1 HCC 72 360 402 53 121 118 6.7 93.3
Plot 2 HCC 77 529 648 46 103 117 23.3 76.7
Plot 3 HCC 81 476 607 43 93 90 13.3 86.7
Plot 4 HCC 83 605 639 55 124 120 11.7 88.3
Plot 5 HCC 76 556 590 51 98 130 16.7 83.3
1)Plot 1, control; Plot 2, barley treated; Plot 3, hairy vetch treated; Plot 4, charcoal and barley treated; Plot 5, charcoal and hairy vetch treated; LCC, low clay content; HCC, high clay content.
2)NG, normal ginger; DG, diseased ginger.
Plot 2, Plot 3, Plot 4, Plot 5의 처리구가 Plot 1(control) 보다 생산량이 높고, 병발생률이 낮으며, 생육상태도 더욱 양호한 것으로 나타났다. 이는 녹비작물 및 charcoal 처리가 생강 생육에 긍정적인 영향을 준 것으로 판단된다. 그러나 녹비작물 및 charcoal 처리보다 점토 함량의 차이에 따라 생강의 생산량, 병발생률, 생육 상태의 차이가 더 큰 것으로 보아 토성 에 따른 수분보유율 등 물리적 특성이 생강생육에 더 큰 영향을 미치는 것으로 판단된다.
Kim et al.(1996)은 뿌리썩음병의 발생은 재배지의 물빠짐과 직 ․ 간접적으로 깊은 관련이 있 다고 하였다. Cho et al.(1996)은 양토보다 사양토에서 토양수분의 감소가 심하다고 하였는 데, 이는 모래가 많은 사양토가 대공극의 비율이 높아 모세관현상과 배수로 인하여 토양수 분의 감소율이 큰 반면, 미사와 점토의 비율이 높은 양토는 상대적으로 물빠짐이 나쁘고, 토양수분 보유력이 높기 때문이다. 본 연구에서도 모래의 비율이 낮고 점토함량이 높을수 록 뿌리썩음병 발생률이 높았으며, 이는 모래의 비율이 높은 처리구에서 상대적으로 배수 가 잘되었기 때문으로 판단된다.
Ⅳ. 적 요
녹비작물로서 녹비보리와 헤어리베치를 환원하고, 토양개량제로서 charcoal을 시용하여 생강연작 재배지에서 생강을 재배한 결과, 토양 pH가 시험 전 6.9~8.1에서 수확 후 6.8~7.6 로 감소하였으며, 전기전도도(electrical conductivity, EC)는 한 시험 전 0.45~1.25dS m-1에서 수확 후 0.30~0.61dS m-1로 감소하였다. 토양유기물(soil organic matter, SOM) 함량과 토양 중 총질소(total-nitrogen, T-N) 함량은 증가하였다. 유효인산 함량과 치환성 K, Ca, Mg 함량 은 유의성 있는 차이가 나타나지 않았다. 그러나, 토양 pH를 중성화시키고, EC 경감, SOM 과 T-N 함량의 증가는 토양 화학성 변화에 있어 긍정적으로 평가할 수 있다. 생강양분의 함량적 차이를 정상근과 이병근의 함량 차이, 토양의 점토함량 별 양분 함량 차이로 조사 한 결과, 유의성이 있는 결과를 얻었으며, 처리구별로 차이가 있는 것으로 나타났다. 특히, 망간(manganese, Mn)의 경우, 이병근의 지하부에서 3~4배 정도 높은 것으로 나타났는데, 망 간(Mn)은 식물 뿌리에 대한 독성 작용으로 뿌리를 갈변시키고 균열을 일으키는 것으로 보 고된바, 뿌리썩음병의 발생으로 Mn이 작용하여 이병근의 Mn 함량이 높은 것으로 보인다.
따라서, 뿌리썩음병과 Mn의 상관관계를 밝히는 추가 연구가 필요할 것으로 판단된다. 또 한, 생강 수확 후 생강 생육 상태와 생산량을 조사한 결과, 녹비보리, 헤어리베치, 녹비보리 +charcoal, 헤어리베치+charcoal을 처리한 시험구(Plot 2, Plot 3, Plot 4, Plot 5)에서 생강의 생 육상태가 양호하고 생산량이 높아 병발생률이 상대적으로 낮게 나타났다. 특히, Plot 4(헤어 리베치+charcoal)-LCC에서는 100%의 생산량을 보였다. 녹비작물과 charcoal의 처리가 생강 생육과 생산에 있어 긍정적인 영향을 미친 것으로 판단된다. 그리고, 상대적으로 점토함량 이 낮은 처리구가 점토함량이 높은 처리구보다 생육 상태와 생산량에서 우세하였는데, 모 래와 점토 함량 차이에 따른 배수와 토양의 수분보유력이 생강생육에 큰 영향을 준 것으로 판단된다.
[논문접수일 : 2014. 8. 21. 논문수정일 : 2014. 8. 28. 최종논문접수일 : 2014. 9. 1.]
Reference
1. Bronick, C. J. and R. Lai. 2005. Soil structure and management: a review. Geoderma. 124 (1-2): 3-22.
2. Cho, H. S., W. Y. Park, W. T. Jeon, K. Y. Seong, C. G. Kim, T. S. Park, and J. D. Kim.
2011. Effect of green manure barley and hairy vetch on soil characteristics and rice yield in
paddy. CNU J. Agric. Sci. 38(4): 703-709.
3. Cho, J. H., S. M. Oh, S. P. Lee, and S. D. Bea. 1996. Research report: Effects of irrigation time on growth and yield of Dioscorea batatas DECNE. Korean J. Med. Crop Sci. 4(3):
205-211.
4. Choi, B. S., J. A. Jung, M. K. Oh, S. H. Jeon, H. G. Goh, Y. S. Ok, and J. K. Sung.
2010a. Effects of green manure crops on improvement of chemical and biological properties in soil. Korean J. Soil Sci. Fert. 43(5): 650-658.
5. Choi, B. S., J. K. Sung, S. S. Lee, J. J. Nam, S. G. Hong, R. Y. Kim, J. E. Yang, and Y.
S. Ok. 2010b. Effects of rape residue as green manure on rice growth and weed suppression.
Korean J. Environ. Agric. 29: 109-114.
6. Dohroo, N. P. 2005. Disease of ginger, p. 305-340. In: Ravindran, P.N. and K. Nirmal Babu. Ginger: The Genus Zingiber. CRC Press, Boca Raton, FL, USA.
7. Foy, C. D., R. Weil, and C. A. Coradetti. 1995. Differential manganese tolerances of cotton genotypes in nutrient solution. J. Plant Nutr. 18(4): 685-706.
8. Fred, M. and E. Harold. 2000. Building soils for better crops. Part 2. Ecological soil & crop management. Chapter 10. Cover crops. 87-98, Sustainable Agriculture Mnetwork.
9. Gee, G. W. and J. W. Bauder. 1986. Particle size analysis, p. 383-411. In: Klute, A. Method of soil analysis part Ⅰ. (2nd ed.). America Society of Agronomy, Madison, WI, USA.
10. Jeon, W. T., K. Y. Seong, J. K. Lee, M. T. Kim, and H. S. Cho. 2009. Effects of seeding rate on hairy vetch (Vicia villosa) - rye (Secale cereale) mixtures for green manure produc- tion in upland soil. Korean J. Crop Sci. 54(3): 327-331.
11. Kim, C. G., J. H. Seo, S. H. Cho, and S. J. Kim. 2002. Effect of hairy vetch as green manure on rice cultivation. Korean J. Soil Sci. Fert. 35(3): 159-174.
12. Kim, C. H., K. D. Hahn, and K. S. Park. 1996. Survey of rhizome rot incidence of ginger in major production areas in Korea. Korean J. Plant Pathol. 12(3): 336-344.
13. Kim, S. Y., S. O. Shin, Y. C. Ku, and S. T. Park. 2006. Effect of long-term dry-seeded rice on growth, rice yield and soil physicochemical properties in rice-barley double cropping system. Korean J. Int. Agric. 18(4): 281-286.
14. Le Bot, J., E. A. Kirkby, and M. L. Van Beusichem. 1990. Manganese toxicity in tomato plants: Effects on cation uptake and distribution. J. Plant Nutr. 13(5): 513-525.
15. Lee, D. K., J. S. Shim, H. K. Shim, Y. H. Lee, and H. K. Park. 1999. Incubational charac- teristics of Bacillus polymyxa ‘HB26-5’ antagonistic to ginger rhizome rot and its formula- tion. Korean J. Plant Resour. 12(4): 289-296.
16. Lee, M. T., C. J. Asher, and A. W. Whilley. 1981. Nitrogen nutrition of ginger effect of
nitrogen supply on growth and development. Field Crops Res. 4: 55-68.
17. Lee, S. H., W. T. Jeon, M. T. Kim, H. S. Cho, and B. H. Song. 2009. Study on produc- tivity, mineral contents, and the uptake amounts of hairy vetch as green manure crop with different seeding dates and amounts. J. Agric. Sci. 25(1): 1-6.
18. Lee, W. H. and D. K. Lee. 1998. Ecology of rhizome rot incidence of ginger and relation of soil texture, chemistry and biology. Korean J. Environ. Agric. 17(1): 1-4.
19. Lee, W. H. and D. K. Lee. 1998. Ecology of rhizome rot incidence of ginger and relation of soil texture, chemistry and biology. Korean J. Environ. Agric. 17(1): 1-4.
20. Lim, J. E, S. S. Lee, S. H. Jeong, Y. B. Choi, S. W. Kim, Y. B. Lee, and Y. S. Ok. 2012a.
Evaluation of C and N mineralization in soil incroporated with green manure. Korean J.
Agric. Life Environ. Sci. 24(4): 8-16.
21. Lim, T. J., K. I. Kim, J. M. Park, S. E. Lee, and S. D. Hong. 2012b. The use of green manure crops as a nitrogen source for lettuce and chinese cabbage production in greenhouse.
Korean J. Environ. Agric. 31(3): 212-216.
22. Lim, T. J., S. D. Hong, S. H. Kim, and J. M. Park. 2007. Recommendation of nitrogen fertilization for cucumber from relationship between soil nitrate nitrogen and yield. Korean J. Environ. Agric. 26(3): 223-227.
23. MFAFF(Ministry for Food, Agriculture, Forestry and Fisheries). 2009. Selection of barley varieties for replacing imported seeds of green manure crops and identification of effects on environment friendly agriculture. p. 190, Ministry for Food, Agriculture, Forestry and Fisheries, Korea.
24. NAAS (National Academy of Agricultural Science). 2010a. Fertilization standard on crops.
National Academy of Agricultural Science, Rural Development Administration, Suwon, Korea.
25. NAAS (National Academy of Agricultural Science). 2010b. Methods of soil chemical analysis. National Academy of Agricultural Science, Rural Development Administration, Suwon, Korea.
26. NIAST (National Institute of Agricultural Science and Technology). 2000. Method of soil and plant analysis. National Institute of Agricultural Science and Technology, Rural Devel- opment Administration, Suwon, Korea.
27. Oguntunde, P. G., M. Fosu, A. E. Ajayi, and N. van de Giesen. 2004. Effects of charcoal production on maize yield, chemical properties and texture of soil. Biol. Fertil. Soils 39:
295-299.
28. Power, J. F. and J. A. Zachariassen. 1993. Relative nitrogen utilization by legume cover crop species at three soil temperatures. Agron. J. 85: 1134-1140.
29. Smith M. S., W. W. Frye, and J. J. Varco. 1987. Legume winter cover crops. Soil Sci. 7:
95-139.
30. Van Breemen, N., J. Mulder, and C. T. Driscoll. 1983. Acidification and alkalinization of soils. Plant Soil 75: 283-308.
31. Yang, C. H., J. H. Ryu, T. K. Kim, S. B. Lee, J. D. Kim, N. H. Baek, S. Kim, W. Y.
Choi, and S. J. Kim. 2009. Effect of green manure crops incorporation with rice cultivation on soil fertility improvement in paddy field. Korean J. Soil Sci. Fert. 42(5): 371-378.
32. Yang, S. K., Y. W. Seo, Y. S. Kim, S. K. Lim, K. H. Choi, J. H. Lee, and W. J. Jung.
2011. Changes of pepper yield and chemical properties of soil in the application of different green manure crops and no-tillage organic cultivation. Korean J. Org. Agric. 17(3): 381-389.